Geographic Information Systems help to detect suitable crops for specific ... part of Precision Agriculture - use information technologies like GPS, GIS, Remote.
Probability Modeling to Reduce Decision Uncertainty in Environmental Niche Identification and Driving Factor Analysis: CaNaSTA Case Studies Karl ATZMANSTORFER, Thomas OBERTHUER, Peter LAEDERACH, Rachel O’BRIEN, Laura COLLET, Gettsy Elisabeth QUIŇONEZ
Summary Hillside agro-ecosystems have a complex spatial and temporal distribution of natural resources. Farmers generally possess a vast body of knowledge about environmental resources on their farms but this knowledge is largely based on locally observable features rather than generalized knowledge. The lack of process-based knowledge concerning agroecosystem function creates uncertainty that obstructs sound decision-making under conditions of rising economic and ecologic pressure in many developing countries. Since the past decade, Precision Agriculture provides tools to reduce uncertainty caused by environmental variation. By describing spatial and temporal variation of the environment, Geographic Information Systems help to detect suitable crops for specific environmental niches and support farmers to find optimal management practices for their plot of land. Hence Precision Agriculture helps to raise the economic benefits of farming, ensures consistent product quality and reduces negative environmental impacts caused by inappropriate management practices. A spatial decision support system called CaNaSTA was developed to aid the decision making process of crop adoption in tropical agriculture. Using Bayesian probability statistics, CaNaSTA integrates trial data, spatial data and expert knowledge and provides maps, tables and graphs analyzing and interpreting the probability distributions of spatial phenomena. The International Centre for Tropical Agriculture (CIAT) has applied CaNaSTA to three case studies related to tropical agriculture. The first case study identifies niches for specialty coffee production, the second analyses the potential of cowpea (Vigna unguiculata (L.) Walp.) for tropical hillside environments in Colombia. Finally, Canasta was applied to a non-crop related area by performing a study of carbon concentration in tropical soils.
1
Introduction
A complex spatial and temporal distribution of natural resources is characteristic for hillside agro-ecosystems. Site-specific management further compounds the naturally introduced, uncontrollable spatial and temporal variation. Considerable evidence exists that farmers identify and use variation at scales relevant for management. Encouraging as this is, increasing land degradation and remaining poverty in developing countries suggest that locally devised methods, on their own, are no longer effective enough to cope with rapidly changing pressures. Farmers generally possess a vast body of knowledge about
K. Atzmanstorfer et al.
environmental resources on their farms but this knowledge is largely based on observable features rather than generalized knowledge. The lack of process-based knowledge concerning agro-ecosystem function and its temporal or spatial variability creates uncertainty that obstructs sound decision-making under conditions of change and provokes farmers to generally underestimate existing environmental variability (COOK, 1999; COOK and BRAMLEY, 2000). Hence this uncertainty prevents farmers from taking decisions that are too risky and may have contributed to their reputation of being risk-averse. Over the past decade, Precision Agriculture has provided tools to reduce uncertainty caused by environmental variation, in order to improve crop management (DIXON and MCCAIN, 1997; COOK and BRAMLEY, 2000). Site-specific management practices - as an integrative part of Precision Agriculture - use information technologies like GPS, GIS, Remote Sensing and computer models tailoring crop management to fit specific environmental conditions (LOWENBERG-DEBOER, 2000). By describing spatial and temporal variation of the environment, these techniques help to detect environmental niches and support farmers to find optimal management practices for their plot of land (ROBERT, 1996). They enable farming to be analyzed as controllable systems, rather than a disaggregated set of agronomic and environmental factors and therefore help to better estimate the influence of environmental factors like climate, soil or topography on crop production or product quality (COOK et al., 2004). Hence site-specific management practices help to raise the economic benefits of farming, ensure consistent product quality and reduce negative environmental impacts caused by inappropriate management practices (BLACKMORE, 2002; COOK and BRAMLEY, 2000). In the 1990s, a number of models for predicting crop respond to climate, water, light and other conditions (SADLER and RUSSEL, 1997) or for predicting the geographic distribution of species in the wild (JARVIS et al., 2002; JONES and GLADKOV, 1999) have been developed. However, only a few of them included a spatial component precise enough for site-specific management practices, which in general require numerous data points. Hence the statistical approaches used in these models are not appropriate for many high value crops, which are not widely cultivated due to a lack of information.
2
Tools and Methods
2.1 CaNaSTA Especially in heterogeneous hillsides where many cultivars can vary within a very small area (OBERTHUER et al., 2004) it is of interest to predict which crop or variety can produce well in a given niche. Lately, researchers at CIAT have initiated the development of the “Crop Niche Selection for Tropical Agriculture” tool “CaNaSTA”. CaNaSTA combines expert and local knowledge on the requirements of given crops or varieties, with the identification and characterization of a small number of specific sites where a crop or variety is known to grow well. CaNaSTA uses this information in order to identify other similar niches where a crop or variety is likely to perform in the same way (OBERTHUER et al., 2004). By making the spatial variability of environmental factors explicit, CaNaSTA supports farmers in order to make less risky agronomic decisions even when there is just
Probability Modeling in Environmental Niche Identification
limited data available, helping to rapidly identify potential production areas for agricultural products saving time and money. The main difficulty in modelling environmental variability is related to the attempt to represent complex, spatially and temporally variable behaviour with simplified models, which use sparse input data (COOK and ADAMS, 1999). CaNaSTA was particularly designed for such situations, when only sparse data is available or data generation is too expensive. The tool operates on the basis that the state of a particular property, which may be difficult to measure directly over a wide area (e. g. soil carbon content or the incidence of speciality coffee), can be inferred from the state of other more easily measurable entities (e. g. climate or topographic data) and the knowledge of their interrelationships. CaNaSTA uses probability theory (Bayesian statistics) to combine these disparate data sets and provides maps, tables and graphs in order to visualize and interpret the probability distributions of spatial phenomena at specified levels (O’BRIEN et al., 2004).
2.2 Environmental Factor Generation As a first step of the CaNaSTA model set-up, decisive environmental variables have to be identified and mapped in order to calculate probability surfaces for the model’s response variable (which can be e. g. sensorial coffee quality, crop yield or soil carbon content). For the case studies mentioned in Chapter 3.1 – 3.3, we selected up to 14 different environmental factors representing environmental variability, mapped and integrated them to CaNaSTA as the model’s predictor variables. Resolution for the factor maps is 30 arc and 3 arc seconds, which correspond in Colombia to a 1 km and a 90 m grid size, respectively (O’BRIEN, 2004). For generating data of climatic factors in the tropics, it has to be often resorted on interpolated climate surfaces, as generally data of only a few weather stations is available in these regions (JONES and THORNTON, 2000). In our model we extracted and mapped climate data using WorldClim data, which is a set of global climate layers at a resolution of 30 arc seconds. The layers were generated through interpolation of average monthly climate data, collected from up to 47.000 weather stations of a period from 1960 to 1990 (HIJMANS et al., 2005). We extracted and generated the following climate factors using WorldClim data: Annual precipitation, annual temperature, dry months per year, diurnal temperature range, dew point and solar radiation. We defined dry months as months with less than 90 mm of precipitation. We calculated mean diurnal temperature range according to JONES et al. (2002) as the difference between mean monthly maximum and mean monthly minimum temperature. We mapped dew point by the method of LINACRE (1977) and calculated mean annual solar radiation according to the method of KUMAR et al. (1997) using digital elevation and latitude data. Identifying and preparing pedologic factors for CaNaSTA use was the most challenging task during the data preparation process as it was not possible to map specific soil attributes, which heavily influence the models’ response variables. Soil characteristics vary widely at a small scale in the study area, but unfortunately there are no soil maps at a high enough resolution to represent this soil heterogeneity available for Colombia. Although various general characteristics such as pH-value and fertility can be derived from maps representing soil types, direct correspondence between soil type and other soil
K. Atzmanstorfer et al.
characteristics is less certain (O’BRIEN, 2004). Therefore, we digitized the 1:500 000 soil map of the Agustín Codazzi Geographic Institute (IGAC, 1981) and simply used the corresponding soil types for the analysis. We generated and mapped topographic factors (elevation, aspect and slope) using a processed DEM of the Shuttle Radar Topography Mission (SRTM).
3
Applications in CIAT – case studies
CIAT applied CaNaSTA to three case studies related to tropical agriculture, which are presented in the following chapter. The first case study identifies niches for high quality coffee production, the second study analyses the potential of cowpea (Vigna Unguiculata (L.) Walp.) as component of animal feed concentrates. Both analyses were performed for tropical hillside environments in the Colombian Province of Cauca. Finally, CaNaSTa was applied to a non-crop related area by performing a study of carbon concentration in the tropical soils of Fúquene Lagoon Basin in Cundinamarca Province, Colombia.
3.1 Coffee Case Study Around 25 million families in hillside regions of the tropics depend on cultivation of coffee as the major source of their income. Steadily declining and highly volatile coffee prices are jeopardizing the livelihood of thousands of smallholder farmers for nearly 40 years now. From 1977 to 2001 real international prices for coffee fell by 5.1 % yearly; in 2002 the price of coffee was at a 30 year low – 25 % less of that in 1960 (GRESSER and TICKELL, 2002). This alarming development and its related socio-economic and ecological consequences (FLORES et al., 2002; VARANGIS et al., 2003) have shifted the attention of coffee-related research from increasing production volumes to specialty coffee. Within the framework of the “Diversification Agriculture Project Alliance” DAPA, CIAT is investigating promising economic alternatives for diversifying smallholder coffee agroecosystems. In this context specialty coffee was identified as one promising economic alternative to commodity coffee, besides other cultivars like tropical fruits, honey, medicinal plants and cowpea.
3.1.1 Materials Sensorial coffee quality depends on environmental and genetic factors, as well as on agronomic management of the crop and post-harvest practices. In order to analyze the barley investigated dependency of coffee cup quality on environmental factors, we carried out a case study linking coffee quality data from 88 farms to the ten climatic, topographic and pedologic factors, mentioned in Chapter 2.2. Study area was the Province of Cauca in Southern Colombia. Cauca is a rural department with agricultural production as the main source of income. More than 60.000 ha coffee was cultivated in 2002 by more than 90.000 mainly small and medium producers (COLLET, 2005). We used data from literature and expert consultations as indicators in order to identify sample farms with potential to produce speciality coffee. Within each farm, the coffee samples were harvested on Management Unit (MU) base. We defined a MU as one or several fields with homogenous environmental and agricultural management
Probability Modeling in Environmental Niche Identification
characteristics, with a minimum of about 5.000 coffee trees. We geo-referenced each MU by the latitude, longitude, and elevation in the centre of each MU using GPS. 90 percent of the samples were harvested from the variety Caturra, the remaining ten percent from the varieties Colombia and Bourbon. Samples were subject to standardized post-harvest management, in order to assure comparable results. All the samples of the study were cupped by a panel of five cuppers according to international cupping standards including e. g. aroma, flavour, after-taste, acidity and uniformity of the coffee.
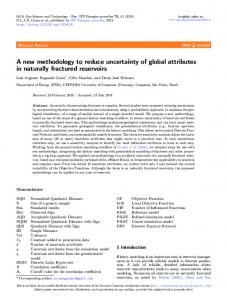
3.1.2 Results We carried out different analyses using CaNaSTA for relating environmental conditions to cup coffee quality (only selected results are presented here). In order to delimitate the study area to zones with specific quality characteristics, we used CaNaSTA for estimating the most probable quality per niche (Figure 1). This probability surface shows that large area produce mediocre coffee but only very limited areas can produce superior quality coffee. Nevertheless, we can identify ecological niches with high probabilities of producing specialty coffee using CaNaSTA. The niches identified are situated in the municipalities of Tambo and Timbío in the Popayán area and the municipality of Inzá on the eastern border of Cauca Province. These municipalities are commonly known as areas where specialty coffee is produced.
K. Atzmanstorfer et al.
Fig. 1:
Most probable coffee quality class, Cauca Province
The localization of niches in the same areas can be observed when we generate maps for individual coffee quality characteristics such as acidity, sweetness, and body. Besides identifying environmental niches that are able to carry high quality coffee, it is also of interest to know which environmental factors are prone to improve or derogate coffee quality. When analysing the factors that most affect cup quality (“driving factors”) with CaNaSTA, it became obvious that especially the combination of specific factors drive coffee quality. The impact of elevation on coffee quality, for example, seems to depend on the aspect of a slope where coffee is grown. Not only specific factor combinations, but also specific factor ranges seem to be important for coffee quality. CaNaSTA showed that altitudes from 1800 – 2000 m in the study area have a positive impact on quality, whereas other altitude categories have a negative or not a significant impact. Regarding annual median temperature as a driving factor for coffee quality, a range of 16 – 18 °C show a positive influence, while a range of 19 – 20 °C show a negative one.
3.2 Cowpea Case Study As argued in the coffee case study above, one promising alternative for diversifying commodity coffee cultivations is speciality coffee, commonly grown at altitudes above 1500 m. Coffee cultivated in so called “marginal coffee growing areas” at lower altitudes between 1000 – 1500 m is usually of marginal quality and therefore relies on the highly volatile markets for volume coffees (GRESSSER and TICKELL, 2002). Hence alternative crops should be found for cultivation in these areas. CIAT identified forage seed and leaf meals produced from cowpea (Vigna Unguiculata (L.) Walp.) as a possible way for many smallholders in these regions to substitute commodity coffee cultivation. Cowpea, one of the most widely grown legumes in tropical and subtropical regions, is of major importance to the livelihoods of millions of poor people, especially in Africa and China (PEREZ-LOPEZ et al, 2003). Cowpea provides inexpensive and nutritious food (grain, pods), gives excellent forage (grain concentrate, leaves and haulm), hay and silage. The plant improves soil quality by fixing soil nitrogen. It is drought and heat resistant, and as a fast-growing ground-cover plant it prevents erosion (QUIN, 1997; COOK et al, 2005). At present, cowpea is not widely grown in most of Colombia or other tropical hillsides in Latin America and the Caribbean (LAC). Very scarce evidence exists of its use as an input to commercial feeds and its production potential. Moreover its performance in the hillside eco-region is not yet fully understood. Therefore the general objectives of this case study were (a) to identify optimal growing areas for cowpea by examining the effects of environmental variability on grain and biomass production using CaNaSTA, and (b) to estimate financial viability of cowpea as component of animal feed concentrates cultivated by smallholders in remote areas as substitute crop for locally traded soy.
Probability Modeling in Environmental Niche Identification
3.2.1 Materials and Methods We established four different cowpea accessions (DICTA 9611, IITA 5234, IITA 1088-4 and IITA 1069-6) at seven different sites located in contrasting landscape positions in the study area, the Cauca Province. Trial sites were 2100 m2 each - areas big enough to give farm-size agronomic and therefore economically valid data. We measured coordinates and areas of each trial site with GPS and integrated grain and biomass yield data as point data to the CaNaSTA model. We identified more yield data at sites in the Colombian Provinces of Valle de Cauca and Nariño as well as in Honduras revising the literature and added it to the model as one way of integrating expert knowledge to CaNaSTA in a data sparse situation. In order to represent environmental variation in the study area, we mapped 14 different environmental factors. In addition to the climatic, topographic and pedologic factors used in the coffee case study, we derived four hydrologic indices from the DEM. These indices are considered as good indirect measures for the spatial variability of hydrological processes (MOORE et al., 1991), which play an important role in the local composition of soils. For modeling soil water content and surface saturation zones we derived a “Topographic Wetness Index”, TWI (MOORE et al., 1991) and a “Slope-length factor” (MOORE and WILSON, 1992) using Arc View 3.2 “Topocrop Terrain Indices” Extension (SCHMIDT, 2003). Furthermore, we used “plan curvature” and “profile curvature” for describing the spatial pattern of the deposition of nutrients and other soil components in our model (ZEVERBERGEN et al., 1997).
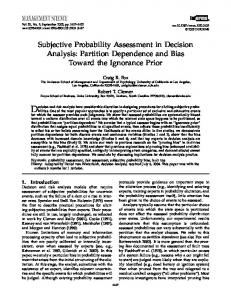
3.2.2 Results In (a) the spatial analysis we examined the adaptation of the above-mentioned cowpea accessions to specific environmental conditions analysing grain and biomass yield. We used CaNaSTA to identify areas in marginal coffee growing regions of Cauca Province between 1000 – 1500 m where cowpea is likely to adapt well. This data was required to estimate the potential area for cowpea production and hence the potential quantities available as animal feed concentrate. Figure 2 shows the probability of cowpea adaptation dark areas show high probabilities of adaptation (up to 75%), light areas low probabilities. CaNaSTA also mapped the certainty of the prediction based on the number of trial data entries, the stability of cowpea adaptation in case of changing environmental conditions and the specific influence of each of the environmental factors used in the model on cowpea adaptation (results not presented). We also determined the best cowpea accession for selected locations (farms) using CaNaSTA. Driving factor analysis revealed several ranges of environmental factors driving cowpea adaptation. As positive driving factor ranges CaNaSTA identified warm temperatures (24.1 - 27.5 °C), low altitudes (0 – 700 m), a low diurnal temperature range (6.8 – 9 °C), a high dew point (18.1 - 23.4 °C) and a high TWI (9-15; that means areas, highly saturated with water). Negative driving factor ranges are slightly flat to medium slopes (6 – 10 °) and slopes with northern aspect (NW - NE). CaNaSTA enabled us to calculate the most likely cowpea yield category occurring at each cell of the study area. We used this information in (b) the financial analysis for deriving income surfaces, showing possible revenues of cowpea cultivation at an estimated cowpea price for each cell. Revenues up to nearly 2.400.000 Colombian Pesos (approximately 1.050 U$) could be achieved per hectare in the best performing niches. For deriving this
K. Atzmanstorfer et al.
map, we examined production costs at each trial site in order to determine yield-price-profit thresholds. CaNaSTA results showed that cowpea could be an alternative crop for diversifying marginal coffee regions in specific environmental niches.
Fig. 2:
3.3
Probability of cowpea adaptation, marginal coffee growing areas, Cauca Province
Fúquene Lagoon Basin Case Study
In a third case study, researchers of CIAT are using CaNaSTA for deriving probability surfaces of carbon concentration in the soils of Fúquene Lagoon Basin in the Colombian Province of Cundinamarca. In this area the decrease of natural vegetation cover due to intensive agriculture use over the past decades resulted in a constant loss of organic matter, resulting in diminishing carbon content in the Lagoon Basin’s soils (RONDON and AMEZQUITA, 2005). The main aim of the investigation is to analyze under which environmental conditions, and in which soil horizons a maximum of carbon is absorbed. This case study should give an example, how CaNaSTA can be applied also on non-crop related topics in the near future. Preliminary results will be available in autumn 2006.
Probability Modeling in Environmental Niche Identification
4
Discussion and Conclusion
The CaNaSTA methodology used in the above-mentioned case studies provides insight into the interaction of agronomic and ecologic variables (e. g. sensorial coffee quality, cowpea yield, carbon soil concentration) with environmental conditions that was not previously available. Considerable results can be achieved by calculating probability surfaces integrating trial data and expert knowledge to a GIS-based model instead of exclusively using time and resource-costly field trials. CaNaSTA proved to be an effective modelling tool in data sparse situations when not enough data is available for common statistical analyses. Using local and expert knowledge, CaNaSTA approximated coffee quality and cowpea yield for very small-scale areas (90 m grid-resolution) with highly varying environmental conditions. The results proved that CaNaSTA can provide farmers valuable information for choosing the right cultivar for a specific environmental niche or for choosing appropriate management practices in order to reducing agronomic decision uncertainty rooting in temporal and spatial variability of the surrounding environment. The most limiting factor for CaNaSTA application is the lack environmental data of highresolution. In particular, soil data is not commonly available at a resolution high enough to represent its spatial variability. In the near future CIAT will focus on the use of CaNaSTA as a spatial analysis tool in order to delimit environmental niches where specialty coffee has a high probability to grow well. The approach used in the case studies will be applied for denomination of origin in coffee by identifying environments that are capable of producing coffee of similar quality profiles. CaNaSTA will also allow definition of zones that are less appropriate for coffee production where coffee should be replaced with other crops like cowpea, tropical fruits, honey or medicinal plants in order to ensure sustainable farmer income. Over the longer term, CaNaSTA should provide means for quickly identifying potential production areas for agricultural products, thereby helping farmers to engage in profitable supply chains on national and international agricultural markets.
References BLACKMORE, S. 2002. Developing the principles of precision farming. The Center of Precision Farming, The Royal Veterinary and Agricultural University, Denmark. COLLET, L. 2005. Impact of Environmental Factors to Manage Coffee Cup Quality. Université Paris 12 Val de Marne. Créteil, France. COOK, S. AND M.L. ADAMS. 1999. Uncertainty and Interpretation of Spatial Information. Wembley, Australia: CSIRO Land and Water Department. COOK, S. AND R. BRAMLEY. 2000. Precision Agriculture: Using paddock information to make cropping systems internationally competitive. Conference Proceedings, Emerging Technologies in Agriculture Conference. Sydney, Australia. COOK, S., R. O’BRIEN, T. OBERTHUER AND J. RUBIANO. 2004. Is precision agriculture irrelevant to developing countries? Conference Proceedings, 7th International Precision Agriculture Conference. Minneapolis, USA. COOK, B.G., B.C. PENGELLY, S.D. BROWN, J.L. DONELLY, D.A. EAGLES, M.A. FRANCO, J. HANSON, B.F. MULLEN, I.J. PATRTRIDGE, M. PETERS AND R. SCHULTZE-KRAFT. 2005.
K. Atzmanstorfer et al.
Tropical Forages: an interactive selection tool. CD-ROM. Brisbane, Australia: CSIRO, DPI&F, CIAT and ILRI. DIXON, J. AND M. MCCAIN. 1997. Precision Agriculture in the 21st Century. Washington D.C., USA. FLORES M., A. BRATESCU, J.O. MARTINEZ, J.A. OVIEDO AND A. ACOSTA. 2002. Centroamérica: El impacto de la caida de los precios del cafe. NY, USA: United Nations. GRESSER, C. AND TICKELL. 2002. Mugged – Poverty in your cup. Oxfam International. Online Report. www.maketradefair.com/assets/english/mugged.pdf HIJMANNS, R.J., S.E. CAMERON, J.L. PARRA, P.G. JONES AND A. JARVIS. 2005. Very high resolution interpolated climate surfaces for global land areas. International Journal of Climatology, Vol. 25, pp. 1965-1978. IGAC (Augustin Codazzi Geographic Institute). 1981. República de Colombia: Mapa de suelos. Escala 1:1.500.000.Bogotá, DE, Colombia. JARVIS, A., L. GUARINO, D. WILLIAMS, K. WILLIAMS, G. HYMANN. 2002. Spatial analysis of wild peanut distributions and the implications for plant genetic resource conservation. Plant Genetic Research Newsletter, Vol. 131, pp. 29-35. JONES, P. AND A. GLADKOV. 1999. FloraMap: A computer tool for the distribution of plants and other organisms in the wild. Cali, Colombia: CIAT. JONES, P. AND P. THORNTON. 2000. MarkSim – Software to Generate Daily Weather Data for Latin America and Africa. Agronomy Journal, Vol. 92, pp. 445-453. JONES, P., P. THORNTON, W. DIAZ AND P. WILKENS. 2002. MarkSim - A computer tool that generates simulated weather data for crop modeling and risk assessment. CDROM. Cali, Colombia: CIAT. KUMAR, L., A.K. SKIDMORE AND E. KNOWLES. 1997. Modeling topographic variation in solar radiation in a GIS environment. International Journal for Geographical Information Science, Vol. 1, No. 5, pp. 475-497. LINACRE, E. 1977. A simple formula for estimating evaporation rates in various climates, using temperature data alone. Journal of Agricultural Meteorology, Vol. 18, pp. 409424. LOWENBERG-DEBOER, J. 2000. Precision Farming Profitability. Site-Specific Management Center, Purdue University, West Lafayette, Indiana, USA. MAIZELS, A. 1994. The Continuing Commodity Crisis of Developing Countries. World Development Journal, Vol. 22, No. 11, pp. 1685-1695. MOORE, I.D., R.B. GRAYSON AND A.R. LADSON. 1991. Digital Terrain Modeling: A Review Of. Hydrological, Geomorphologic and Biological Applications. Hydrological Processes, Vol. 5, pp. 3-30. MOORE, I.D. AND J. WILSON. 1992. Length-slope factors for the Revised Universal Soil Loss Equitation: Simplified method of estimation. Journal of Soil and Water Conservation, Vol. 47, No. 5, pp. 423-428. OBERTHUER, T., S. COOK, M. LUNDY, G. WATTS, R. O’BRIEN AND P. JONES. 2004. Research Framework that support sustainable diversification of coffee-based cropping systems with higher value crops. CIAT, Cali, Colombia. O’BRIEN, R. 2004. Spatial decision support for selecting tropical crops and forages in uncertain environments. Thesis Doct. Philosophy. Curtin University of Technology, Australia.
Probability Modeling in Environmental Niche Identification
O’BRIEN, R., M. PETERS, R. CORNER AND S. COOK. 2004. CaNaSTA – Crop Niche Selection for Tropical Agriculture, a spatial decision support system. Annual Report 2004, Project IP-5. CIAT, Cali, Colombia. PEREZ-LOPEZ, O., R.A., PEREZ-BONNA, G. GUZMAN AND J.E. MOJICA-RODRUIGEZ. 2003. Cultivos para alimentación animal en sistemas de producción bovina de la Orinoquia colombiana. Bogotá, Colombia: Corpoica, Ministerio de Agricultura y Desarrollo Rural de Colombia and CIAT. QUIN, F.M. 1997. Introduction. B.B. SINGH, D.R. MOHAN RAJ, K.E. DASHIELL AND L.E.N. JACKAI (Eds.). Advances in Cowpea Research. Co-Publication of International Institute of Tropical Agriculture (IITA) and Japan International Research Center for Agricultural Sciences (JIRCAS). Ibadan, Nigeria. pp. ix-xv. ROBERT, P.C. 1996. Precision Agriculture. Proceedings of the 5th Precision Agriculture Conference on Precision Agriculture, Precision Agriculture Center, University of Minnesota, USA. RONDON, M. AND E. AMEZQUITA. 2005. Propuesta para la realización de inventarios de Carbonos y medición de Gases de efecto invernadero en los sistemas de uso dominante en la Cuenca de la Laguna de Fúquene. Unpublished Document. CIAT, Cali, Colombia. SADLER, E.J., AND G. RUSSELL. 1997. Modeling crop yield for site-specific management. P.C. ROBERT, R.H. RUST AND W.E. LARSON (Eds.). The State of Site-Specific Management for Agricultural Systems. Madison, USA. pp. 69-80. SCHMIDT, F. 2003. Hochgenaue Digitale Gelaendemodelle – Untersuchungen zur Erstellung, Analyse und Anwendung in der Landwirtschaft. Universiaet Rostock, Germany. VARANGIS, P., P. SIEGEL, D. GIOVANNUCCI AND B. LEWIN. 2003. Dealing with the Coffee Crisis in Central America: Impacts and Strategies. The World Bank, Washington D.C., USA. ZEVERBERGEN, L.W. AND C.R. THORNTON. 1997. Quantitative Analysis of Land Surface Topography. Earth Surface Processes and Landforms. Vol. 12, pp. 47-56.