Abstract. We proposed two process algorithms for resolution improvement and contrast enhancement in the images of optical coherence tomography (OCT).
OPTICAL REVIEW Vol. 10, No. 6 (2003) 567-571 O 2003 The Optical Society of Japan
ProceSS Algorlthms for Resolutlon Improvement and Contrast Enhancement in Optical Coherence Tomography I-Jen HSU, Chia-Wei SUN, Chih-Wei LU, Chih-Chung YANG*, Chun-Ping CHIANGl, Chii-Wann LIN2 Graduate Institute of Electro-Optical Engineering and Depa"tnrent of Electrical Engineering, National Taiwan University, J, Roosevelt Road, Section 4, Taipei, Taiwan, R.O. C. IDepartlnent ofDentistry, National Taiwan University, 1, Roosevelt Road, Section 4, Taipei, Taiwan, R. O. C. 2Graduate Institute ofBioengineering, National Taivvan University, J, Roosevelt Road, Section 4, Taipei, Taiwan, R. O. C. (Received March 6, 2003; Accepted october 9, 2003)
We proposed two process algorithms for resolution improvement and contrast enhancement in the images of optical coherence tomography (OCT). An OCT system with a non-Gaussian light source spectrum or dispersion mismatch usually results in sidelobes in the interference fringe envelope that may produce artifacts and reduce image contrast.
Based on the concept of deconvolution, we proposed two different process algorithms and demonstrated their effectiveness in retrieving sample structures. The effects of the process algorithms were examined by numerical simulations and real OCT scanning images. After processing with the proposed procedures, the effects of sidelobes were tremendously suppressed and the image qualities were improved.
Key words: optical coherence tomography, process algorithm, image resolution, image contrast, deconvolution
process algorithms to improve the resolution and to enhance the contrast of OCT images. The effects of these algorithms are demonstrated with numerical simulations and shown with real OCT scanning images. The applicability and limitation of the process algorithms are also discussed. In section 2 of
1. Introduction Optical coherence tomography (OCT) is a noninvasive imaging technique and has been widely studied for biomedical applications.1) Because the longitudinal resolution of an
OCT system is inversely proportional to the spectral width of
this paper, the concepts of the proposed algorithms are
its light source, broadband light sources are required for high-
discussed, and their procedures are described in section 3. The results of numerical simulations are presented in section
resolution OCT systems. Current developments for improving the spatial resolution of OCT systems by use of ultra-
4. Application of the proposed algorithms to practical OCT scanning results is shown in section 5. Finally, conclusions
broadband light sources include the use of a photonic crystal
fiber in combination with a compact sub-10fs Ti:sapphire laser to generate a spectrum ranging from 550 to 950nm. This broad spectrum results in submicrometer axial resolu-
and discussion are given in section 6.
tion in an OCT system 2) Also, the use of a spectral
2. Concepts of the process Algorithms
continuum from 800 to 1400 nm generated from a photonic crystal fiber to produce longitudinal resolution of I .3-um in
An OCT image iS a collectiOn of A-scan signals that are Obtained from the diStributiOns of interference patterns of
biological tissue was reported.3) Meanwhile, a continuum
PhOtons backScattered by the interfaces of the sample
generation through an ultrahigh-numerical-aperture fiber 4)
interfering with the phOtons from the reference arm. The
and a superluminescent light source using a Ti:A1203 crystal
detected signal in an A-scan iS
pumped by a frequency doubled diode-pumped laser5) were
I )Ir)2l+E* (t+ 12) (1( I(r) ::: ~E (t+ T)
used for high-resolution OCT systems. Although an ultra-broadband light source can result in
(1)
ultra-high resolution in an OCT system, it usually has a nonGaussian spectrum and produces sidelobes in the interference
:= 11 + 12 + 2Re ~~(E1(t + r )E (t + T))
fringe envelope. The sidelobes can be suppressed by shaping the spectrum into a Gaussian form. However, such a process will reduce the spectral width and degrade the longitudinal
Here, El and E2 stand fOr the wave fieldS from the sample and reference arms, respectively, and 11 and 12 are the intensities
in the two arms. They are defined as
resolution of the OCT system. If appropriate process
l =: I~EI 12) (t + T)
algorithms can be applied to suppress the sidelobes in the
(1 1 ,
interference fringe envelope, the ultra-broadband light source
can be used without spectral shaping and the ultra-high resolution of the OCT system can be preserved. Several signal-processing methods have been developed to increase
12 =: ( E2(t) 2). (3) The time delay T is measured between the reflection at the
the resolution of OCT images, such as deconvolution with the iterative restoration algorithms6~8) and reduction of the side10bes with a spectral shaping technique.
mirrOr in the reference arm and that at the first interface of the
9)
sample. ri denotes the time delay of the photons from the ith
interface of the sample relative to those from the first
In this paper, we propose and demonstrate two different
interface. The first two terms in Eq. ( 1) correspond to dc
components during scan and will be neglected in the
*E-mail address: ccy@cc,ee.ntu.edu,tw 567
I-J. HSU et al.
568 OPTICAL REVIEW Vol. lO, No. 6 (2003)
following discussion. For a light source with the spectral
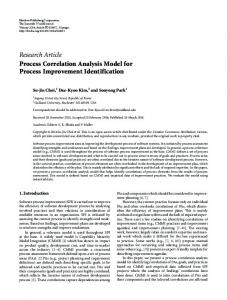
algorithm is to find a certain function as an assumed sample
function S((D), the wave field can be expressed as the inverse-
structure to be the initial guess in the procedure of iterations.
Fourier transform of the spectral function as
The function of the assumed sample structure is then modified to approach the real one by comparing the
1 c O
Output I' Ir If ,1~
ro I= r
l, 7' 3"" (a)
I; = I;"'
Input I 1'I I2', 3"" IN Output lr lr I' Il'
l, 2' 3""'
Fig.
I ,>i-lI and
2. Flowchart showing the retrieval iteration procedure.
I =0 ,
i
li > Ii+]
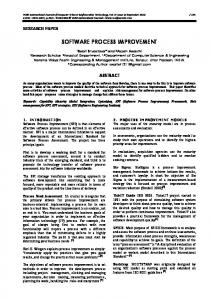
structure can be calculated through Eq. (6) or (8) and is shown in Fig. 3(b). The corresponding one-dimensional OCT image is obtained by demodulating the detected signal and is
i]
shown in Fig. 3(c). One can see that the individual interfaces
Output I;, I~, I~,•••, I~ (b)
can be well identified when the separation between two neighboring interfaces is larger than 3 um. When the separation is smaller than 2 um, the interfering signals resulting from different interfaces overlap each other. Hence,
the positions of the interfaces can no longer be correctly Fig. I . Flowcharts showing the procedures of constructing the
identified.
initial guess functions with (a) the first method and (b) the second
The signals were processed with the proposed algorithms. Figure 3(d) shows the processed results with the first method
method.
tions of the proposed algorithms, we use the iteration procedures for simulating the imaging operation of an assumed sample structure with six interfaces, as shown in Fig. 3(a). Here, the separations between two neighboring interfaces range from I to 5 um. Such a sample structure is scanned with an OCT system with the spectral distribution of the light source described in Eq. (7). The center frequency a)o
is assumed to be 2.355 x 10¹⁵ Hz, which corresponds to the
center wavelength of 800 nm. The full-width at half maximum (FWHM) of the spectrum was chosen to be 100 nm by setting Aco = 0.176 x 10¹⁵ Hz. Under these conditions, the
FWHM of the interference fringe envelope of a single-facet reflection can be calculated through the equation
Az 2ln2 A~ (10) JT AA
after 10 (dotted curves) and 100 (solid curves) iterations, respectively. When the separation between two neighboring interfaces is larger than 3 um, the width of each envelope becomes smaller, corresponding to the contrast enhancement of the image. When the separation is smaller than 2 um, the original interfaces cannot be retrieved. Figure 3(e) shows the processed result with the second method after 10 iterations. In this situation, the retrieved result looks better when the interface separation is larger than 3 um. The interfaces with
separations smaller than 2 um cannot be retrieved with the second method either. In both methods, the processed signals approach the convergent results after 10 iterations when the parameter c is set at 0.02. The limitation of the proposed
algorithms was estimated by considering a two-interface
structure. From the raw data of OCT image, we cannot distinguish the two interfaces or correctly identify their positions when the separation is less than 3 um. Figures 4(a)
to obtain Az = 2.84 um. This value is conventionally
and (b) show the simulated signal and its envelope of the two-
regarded as the longitudinal resolution of the OCT system. In simulation, the detected signal for the assumed sample
interface structure with 2 um in spacing. The interference fringe patterns from the two interfaces overlap each other and
569
570 OPTICAL REVIEW Vol. 10, No. 6 (2003)
I-J. HSU et al.
1~]-
15
l O-
I~-
:~ OS
~ O~-
~Q
~Q
- OJ]-
- Oi5~~
~~ (!)
(!~
c ~Oj;-
c 04(D c:
(D
-~-1 O-
- O~}-
-1 5
O J)
O
5
i5
lo
20
~ ~ I b I ~ i ~ 2b 2~ ~
O
25
~
l'4
l~
Depth [~m)
Depth (um) 1 5-
IS
(b) Ifl-
:i IJ]-
O~-
:~ (Q
(Q
;~
~~
- OJ]-
~) ~: O;
(J1)
L: *OS-
G)
(D
4~ ~:
2:
- -1J~-1 5
5
O
10 '
15
o o lb I~ l~ 20 22 d
2s
20
~
~
~
1'4
~
1'6
Depth (um)
Depth (hLm)
O 03 -
l 5-
(c) :~ 0.02-
:~ IJDCQ
(Q
~~
~
cr) OOl
(!)
c OS
c c (1)
(L)
c:
O~ 5
o
Is
10
20
2s
o oo rb l~ 1~ 2~ d
~
~
~
1'4
~
1'5
2b
Depth (urr])
Depth (~tm)
Fig. 4. (a) The simulated interfering signal and (b) its fringe envelope of a two-interface structure with 2 um spacing. (c) The processed results after 10 (dotted curves) and 100 (solid curves)
O Os -
(d) O J:)4 -
~ OJD3
iterations by the first method.
~O
~~vl OJ]2-
c
(1>
~i 0~il
5. Experimental Results
O J~0
O
s
lo
15
20
2s
Depth (~Lm) 1 S-
In experiments, we used a typical free-space OCT system with a mode-10cked Ti:sapphire laser (Femtosource) as its
light source to scan various samples. The light source
(e)
provides a non-Gaussian spectrum with the spectral width of :~ I~-
about 80nm. Figure 5(a) shows the one-dimensional OCT
~Q
image of a human buccal mucosa sample. Before the retrieval
~~ (j' OS c: Q)
procedure, the raw data were smoothed through a low-pass filter to eliminate the high-frequency noise. Figure 5(b)
c OO O
s
10
15
20
25
Depth (~rn)
Fig. 3. (a) Assumed sample structure with six interfaces. (b) The simulated detected signal from the assumed sample structure and (c) its fringe envelope. (d) The processed results with the first method after 10 (dotted curves) and 100 (solid curves) iterations. (e) The processed result with the second method after 10 iterations.
cannot be distinguished. The processed results after 10 and lOO iterations with the first method are shown in Fig. 4(c)
(dotted curve for 10 iterations and solid curve for 100 iterations). The two interfaces become distinguishable and their positions can be correctly identified after the retrieval
shows the image of filtered data. This set of data was then processed by the first method. The processed image after 10 iterations is shown in Fig. 5(c). One can see that not only does
the front boundary become sharper, but also the sample structure becomes clearer, and the image contrast is significantly enhanced.
Figure 6(a) shows a two-dimensional OCT image of the same sample. Figure 6(b) shows the same image after lowpass filtering. The image after processing with 10 iterations of the first method is shown in Fig. 6(c). Here, we can easily distinguish the layered structures including the (i) keratin, (ii)
epithelium, (iii) connective tissue and (iv) salivary glands, as
indicated in the figure. The image contrast was significantly
enhanced and the boundaries between the layers are clearer.
process. This means that the longitudinal resolution can be improved with the proposed algorithms if the image feature separation is not much smaller than the resolution cell size. We have found that the two interfaces can be well resolved if the interface separation is larger than 0.8 um, although their
retrieve the sample structure and enhance the image contrast
positions might not be correctly identified.
in OCT images. Based on the concept of deconvolution, we
6. Conclusrons In conclusion, we have proposed two process algorithms to
10, No. OPTICAL REVIEW Vol.
I-J. HSU et al. 571
6 (2003)
04
03::;
CQ_02
~~ ~ co ~:
~~~ O1-
c -max
OO
SO ISO 100
O
200 2so 300 3so 400 450 500 Depth (um)
.{~;
03 (b) -m n
=; 0~CQ
~
(i)
(!) O1
C (D
(ii)
C:
(iii)
cO
50 1 OO 1 50
O
200 250 300 3so 400 4so 500
(iv)
Depth (um) O O1
Fig. 6. Two-dimensional OCT images of the human buccal
(c)
mucosa sample (2 mm x 0.5mm): (a) before the low-pass filter, (b) after the low-pass filter, and (c) after 10 iterations with the first
CQ
method.
~~ oD
C Q) C O OO
O
SO IdO I~O
200 250 300 3so 400 4so soo
The Republic of China, under the grant NHRI-EX92-9220EI.
Depth (um)
Fig. 5. One-dimensional backward-scattered intensity distribution in the OCT image of a human buccal mucosa sample: (a) before the low-pass filter, (b) after the low-pass filter, and (c) after 10 iterations
with the first method.
Ref erences
1) D. Huang, E. A. Swanson, C. P. Lin, J. S. Schuman, W. G. Stinson. W. Chang, M. R. Hee, T. Flotte, K. Gregory, C. A. Puliafito and J. G. Fujimoto: Science 254 (1991) 1 178. 2) B.Povazay, K. Bizheva, A,Unterhuber, B.Hermann. H. Sattmann, A. F. Fercher, W. Drexler, A. Apolonski, W. J. Wadsworth, J. C. Knight, P. St.
used the methods of iteration to approach the real structure of
the sample. The effects of the process algorithms were demonstrated with numerical simulations and real OCT scanning images. The application limitation of the algorithms
was also examined. In real OCT operation, a human buccal mucosa sample was scanned with a free-space OCT system. After processing with the proposed algorithm, the sample
J. Russel, M. Vetterlein and E. Scherzer: Opt. Lett. 27 (2002) 1800. 3) Y. Wang, Y. Zhao, J. S. Nelson, Z. Chen and R. S. Windeler: Opt. Lett.
28 (2003) 182. 4) D. L. Marks, A. L. Oldenburg, J. J. Reynolds and S. A. Boppart: Opt. Lett. 27 (2002) 2010. 5) A. M. Kowalevicz, T. Ko. I. Hartl, J. G. Fujimoto, M. Pollnau and R. P.
Salath~: Opt. Express 10 (2002) 349. 6) M. D. Kulkarni, C. W. Thomas and J. A. Izatt: Electron. Lett. 33 (1997) 1365.
structure became clearer and the image contrast was
7) M. Bashkansky, M. D. Duncan and J. Reintjes: App. Opt. 37 (1998)
significantly enhanced.
8137. 8) I. J. Hsu. C. W. Sun, C. W. Lu, C. C. Yang, C. P. Chiang and C. W. Lin:
Acknowledgement This research was supported by the National Health Research Institute of
Appl. Opt. 42 (2003) 227. 9) R. Tripathi, N. Nassif. J. S. Nelson, B. H. Park and J. F. de Boer: Opt. Lett. 27 (2002) 406.