To tune application jobs, our tool needs to ... Internet based technologies like the web became the standard ... environment, its execution request of job processes are delivered ... application development have advantage to cover the big set.
JCS&T Vol. 7 No. 1
April 2007
Process Tracking for Dynamic Tuning Applications on the Grid 1 Genaro Costa, Anna Morajko, Tomás Margalef and Emilio Luque Department of Computer Architecture & Operating Systems Universitat Autònoma de Barcelona, UAB Bellaterra, 08193, Barcelona, Spain
accessible by others and others are not. Data communication between different resources may have different throughput and latencies. Typical problems of distributed systems like load balance, synchronization bottlenecks are hard to locate and much hard to solve. Another interesting system property is the configuration. Each Grid system configuration is unique and that has different application optimization requirements. The system configuration is not static, that may change frequently by events like machine and software upgrades, machines acquisitions, new member joins sharing its resources or organization polices changes [3]. Once an application is sent to execution on a Grid environment, its execution request of job processes are delivered through a set of software layers until reach the processor machine node. These layers are required to enforce Grid VO polices, organization polices and scheduling polices. Using these layers, application job processes could be running on any processor machine node that match the execution request job profile, and such information may be available only at runtime. At machine layer, or fabric layer using the Grid terminology presented by Foster in [5], the application execution spawns parallel processes jobs through middleware layers and controlled by a batch queue system. The application can use a single cluster to avoid communication overheads or can spawn itself over more than one cluster, possibly dealing with high latency message passing communication problems [3]. To reach performance goals, users need to parallelize and optimize their applications. With computer cluster popularity users should have more expertise on build parallel applications. Indeed, this expertise is generally bound to the system configuration they have. There are some researches to make this work easier by framework creation, auto-tuning libraries, programming language abstractions and execution environments [6-10]. The techniques that do not require changes in the adopted application development have advantage to cover the big set of currently existing applications. Application optimization is not a trivial task. In distributed systems the machine communication topology and processor computational capacity are key property to the optimization work. Characteristics of Grid system makes that work even harder. Due to dynamic system configuration, different application executions can get different system configurations. In such conditions autotuning libraries and tuning environment could help users support configuration or network characteristics changes [810]. We have built a Monitoring, Analysis and Tuning Environment (MATE), a tool that enables dynamic tuning of parallel applications running on a cluster using DyninstAPI [11]. MATE has is capable of dynamic application instrumentation to get execution trace events, analyzes these events and dynamic tune the application based on a performance model. It uses the concept of tuning
ABSTRACT The computational resources need by the scientific community to solve problems is beyond the current available infrastructure. Performance requirements are needed due constant research progress, new problems studies or detail increase of the current ones. Users create new wide distributed systems such as computational Grids to achieve desired performance goals. Grid systems are generally built on top of available computational resources as cluster, parallel machines or storage devices distributed within different organizations and those resources are interconnected by a network. Application tuning on Grid environment is a hard task due system characteristics like multi-cluster job distribution among different local schedulers and dynamic network bandwidth behavior. We had a Monitoring, Analysis and Tuning Environment (MATE) that allows dynamic performance tuning applications within a cluster. Due to the many software layers present on the grid, similar job submission may execute on different places. To tune application jobs, our tool needs to locate and follow the jobs execution within the system. We call this a process tracking problem. This paper presents MATE integration to the Grid and the two process tracking approaches implemented in order to solve the process tracking problem within Grid systems. Keywords: Grid Monitoring, Dynamic Instrumentation, Dynamic Performance Analysis. 1. INTRODUCTION The Internet age made possible cooperation in many levels. Internet based technologies like the web became the standard interface for human to machine as machine to machine communication. Other important characteristic of Internet age is the large number of resources plugged online. Clusters like Beowulf, NOW and HNOW concepts are popular and widely used [1, 2]. Different level of details, new scientific problems and bigger s imulation scenarios pushes users to build new wide systems based on current available computational resources. These wide systems configurations are currently studied as Computational Grid technologies. Grid System generally belongs to more than one organization. These organizations join resources in a high level abstraction called Virtual Organization (VO). Its resources are shared relying on local organization polices and the system abstraction is provided by a software layer. Key concepts are interoperability and openness [3-5]. Although, applications need to be modified in order to have benefits from execution in such environment. These modifications are more complex that a simply application parallelization. The Grid is a distributed system architecture generally composed by different levels of interconnect network between its resources. Some resources are 1
Research supported by the MEyC-Spain under contract TIN 2004-03388.
28
JCS&T Vol. 7 No. 1
April 2007
components called tunlets holds all logic for monitoring, analysis and tuning. With that architecture, the application instrumentation is guided by each tunlet contained performance model, what minimize intrusion overhead due that only the measure points required by the performance model are instrumented [12, 13]. This paper presents the MATE techniques for process tracking on Grid system, (i) system service approach and (ii) binary packaging approach, implementation detail and discuss about advantages of each approach. Section 2 describes our target Grid environment. Section 3 presents some background information about performance analysis and describes our Monitoring, Analysis and Tuning Environment (MATE). Section 4 presents the approaches for process tracking in Grid used by MATE. Section 5 presents some findings and the conclusion of this work.
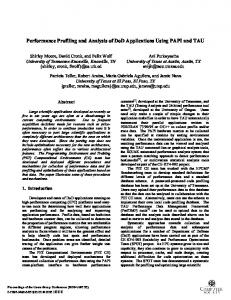
Figure 1: Grid Protocol Stack presented on [5] with layer component examples.
2. COMPUTATIONAL GRID
An important problem that the application may deal with in a Grid environment execution is that such system generally have a heterogeneous infrastructure and in most cases, a dynamic system configuration. That behavior could lead to performance drawbacks such load imbalance problems, high latencies caused by improper message fragmentation or inadequate buffer sizes [17]. If the target platform is modified (number of processors, processor speed, network bandwidth, etc.) the required optimizations should be different. Grid brings new challenges in performance analysis and tuning making classical approaches less useful. For example, post-mortem analysis, as presented on [18], presumes repeatability and may not be used as the Grid platform. System configuration is highly dynamic and rarely repeatable. In this sense, a dynamic tuning tool seems to be relevant approach that could adapt applications to system changes or runtime configuration.
An oversimplification of Computational Grid could be a wide collection of interconnected resources distributed under different administrative domains. These resources could be workstation machines, high performance parallel machines, homogeneous or heterogeneous clusters, storage sites or even data input device like measure sensors [3]. The idea behind Computational Grids is that these resources belong to different organizations and these organizations need an infrastructure that enables cooperation between them. For each cooperation project, organization members are grouped on a concept named Virtual Organization (VO). One organization can participate on one or more VOs. The VO concept also groups each organization available resources, users, and resource use polices. One organization XYZ can share its cluster A exclusively to the VO Genome, for example. Each resource has its access polices, characterization and interface. To fulfill VO resource use requirements, software layers like Globus Toolkit [3] and Legion [14] were built on top of existing resource. We can use Globus toolkit to solve problems like data replication, resource allocation, VO to resource security mapping, interorganization communication, service deployment and another Grid wide services [3, 5]. Figure 1 presents the software stack proposed by Foster on [5] with extended information about layer example components. The Fabric Layer provides the interface used on direct resource level operations. The Connectivity Layer solve problems like security requirements, resource security trust and communication abstractions. The Resource Layer solves problems like resource negotiation, accounting and monitoring. The Collective Layer solves resource group wide operations like meta-schedulers, resource broker and data replication. A common way of use the computational power of a Grid is to spawn the processes of a massive parallel application within the available processing node resource. A user can interact to a Grid Web Portal and submit his batch application. That application should enter a meta-scheduler queue like Condor-G [15] or Community Scheduler Framework (CSF), services of Collective Layer [3]. The meta-scheduler negotiates to Resource Layer services in order to do resource reservation using authenticated and secure communication services provided by Connectivity Layer. Following the Grid Protocol Stack, that request is translated in Fabric Layer to a local cluster scheduler like Condor, PBS, LSF or SGE, where the application job is executed [16].
3. PERFORMANCE ANALYSIS AND MATE Application performance depends of many properties in many levels. At hardware level, it depends on cache size, memory size, and jump prediction techniques, for example. At operating system level, it can be affected by quantum size, buffers size and scheduling police. At libraries level, it can be affected by thread model, data alignment, buffers sizes, and parameters configuration [12]. On parallel machine level, the communication topology hardly affects application performance. To achieve performance on a distributed system, the users should attack on all levels. At hardware level, the hard work is done by compilers, although is not easy to get the best performance for an application in a select machine. Other important point is that optimization done to an application to run on a target machine may not be used on a different machine. The optimization is deeply bound to machine configuration. At parallel machine level, machine configuration can easily lead to load balance or synchronization problems [12]. In all levels, the performance optimization steps are very similar. The application should be instrumented to generate performance data; executed, to be monitored; the gathered data must be analyzed; and the application should be modified to solve the identified problems. These steps are performed until performance goals are satisfied or reach machine performance peak. The instrumentation generally introduces some overhead and change the default behavior of the application. With the increase of instrumentation detail inserted, the more application execution behavior differs from original executions.
29
JCS&T Vol. 7 No. 1
April 2007
The instrumentation insertion process can be static or dynamic. In static instrumentation, the application developer changes application code in order to generate performance data. This is not a hard task due the existence of tools that perform all the required code instrumentation automatically. After the static instrumentation, the application must be recompiled. The dynamic instrumentation is done without need of application code. The binary of application is instrumented online during application execution [11, 13]. The data collected by the application execution can be data sampling or trace event. On data sampling, execution times are accumulated and on trace events, it should generate an event on code region entry and another for code region exit. Event tracing generally introduce more overhead than data sampling due the amount of generated data bound to application execution. With data sampling, it is easier the verify what function spend more time, but more complex of causes can be obtained from event trace analysis. To analyze the collected data, the developer can use visualization tools. This is widely used in all levels, thought hardware counters to message parsing events analysis. But, these tools use require developer expertise about performance problems and machine configuration [18, 19].
Machine 1 Task1
Execution
l
Events
Dynamic
and
events
As presented of figure 3, MATE has two main components: (i) the Application Controller (AC) and (ii) the Analyzer. The AC is the component which interacts with the application process, by inserting instrumentation code and by doing the dynamic tuning modifications [12, 13]. The AC uses DyninstAPI to attach to the application process and load within the application process space a MATE dynamically linked library called DMLib in order to help the instrumentation and tune process. In current architecture, it is need to runt just one AC process instance per processor nodes [11-13]. One AC process instance can monitor and tune many application job processes on the same machine. The Analyzer component consists of a software container of tuning components called tunlets. It has the responsibility of coordinate the tune session in cooperation with the AC components distributed over the system. Each tunlet can encapsulate the logic of what should be measured, how data can be interpreted by a performance model and what can be changed to accomplish better execution time or better resource utilization.
Performance analysis
Analysis
instr.
Machine 3
Tuning
Monitoring,
DMLib
Figure 3: Components Iteration within MATE.
Problem / Solution
Figure 2: Approach.
Task2
Analyzer
Instrumentation Monitoring
T oo
DMLib
instr.
Modifications
DynInst Performance data
AC
Task3
events
r Use
Application
AC
DMLib
Application development Source
Machine 2 modif.
Tuning
Analyzer
The Monitoring, Analysis and Tuning Environment (MATE) consists of execution environment that permits dynamic tuning of application without need of code modification, compilation or linkage, based on DyninstAPI [11]. The idea is that the developer does not need to be an expert to tune his/her application. Internally, the tool has the knowledge about the performance bottlenecks problems, how to detect and solve them. The figure 2 shows which work part is done by the user and which is done the tool. MATE inserts the instrumentation need to do the performance analysis within the running application. The instrumentation inserted by the monitoring process, generates performance data that is colleted and represented by execution events. These evens information are analyzed using performance models, which are used to verify the existence of bottlenecks. For example, the instrumentation can be used to measure the size of message used on transport operations and its buffer sizes. Performance model could relate message sizes to optimal buffer size. With this information, MATE may introduce modifications in the application in order to improve its execution. The optimization process is done without user interaction.
DTAPI
Tunlet Measure points Performance model
Tuning point, action, sync
Figure 4: Internal representation of the Analyzer.
The Analyzer interacts with the tunlets though the Dynamic Tunlet Application Programming Interface (DTAPI) as presented on figure 4. That API allows that the tunlet receives functions calls associated with events like application startup, job process startup, instrumentation generated event receive. Within these function calls, each tunlet can request for application process instrumentation or application modification. All request generated by tunlets are forwarded to the AC. The AC receives the requests, instruments the application and forwards the trace back to the Analyzer. By DTAPI, these trace events are dispatched to the desired tunlets. The tunlet may decide, based on its performance model, what should be changed on the program in order to tune the application and requests to the Analyzer application changes. These requests are forwarded to the AC and the requested dynamic changes are made on the application [12, 13].
30
JCS&T Vol. 7 No. 1
April 2007 The glue code acts as a wrapper process to AC or the application based on target system execution properties.
4. GRID PROCESS TRACKING To instrument an application in such environment, a monitoring tool should track down the application process components to gather instrumentation data. This starts to be a problem because resource utilization is indirectly selected through the Grid Protocol Stack. To track down process in a Grid environment, two main approaches can be used: • Binary Packaging approach – bind the application and the MATE AC component together with a tracking process in a single binary • System Service approach – have a tracking process running on the target execution machine waiting for the application process. In the first approach, the execution of the application process is controlled by the bound tracking process, which may be responsible for gathering instrumentation or doing the dynamic tuning. In the second approach, the tool can look for application start in a pooling method or can monitor the scheduler tracing the application startup. The first approach can be done by application developers and users, targeting better application execution time, and the second can be done by site administrators interested in efficiency, since installation requires administrative privileges. In the current version of MATE it has the feature of PVM process tracking. The application is started under the control of the Analyzer component. The track down application job processes, the AC component bounds itself as PVM Tasker, so, when the Analyzer spawns the application the AC is notified to spawn each process. After the application job spawn, the AC component register itself into the Analyzer component. By this sequence, MATE has total control of the application and does steering execution of its controlled processes [12, 13].
AC
Task
DMLib
Remote Machine new ‘Task’
new ‘Task’ Task AC
Remote Machine
detects Dyninst
create
create Job submission
AC
AC
Taskn
DMLib control
DMLib Analyzer subscription
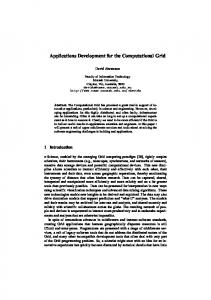
Figure 5: Creation of the ‘new’ application binary and its execution.
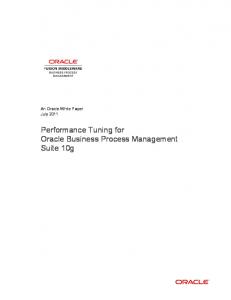
Using the Binary Packaging approach, MATE has total control of the application execution. In a scenario where a user submits an application to Grid, the execution request should enter a Condor-G [15] queue. The request properties are used by Condor-G to elect which grid resource should be used. The elected resource can be a cluster exposed to Globus Resource and Allocation Manager (GRAM) component [20]. The binary is so transferred automatically by GridFTP service carrying out the MATE bound binary and libraries [3, 20]. System Service Approach This approach consists of have the AC daemon running on the processor nodes waiting for tuning sessions. This approach requires administration privileges. The key idea is to enable the machine with dynamic tuning services that can be used by any registered application. With the AC daemon running on each machine of a cluster, this cluster is ready to do tuning sections by user request. The application to tuned should be registered to the Analyzer by the user in order to start the tuning session. By doing this, the Analyzer broadcasts the location request containing application identification with the name and binary checksum hash to all registered AC process. This is necessary due possible process name coincidences. The AC can operate in pooling mode or pull mode. In pooling mode, it monitors changes in proc file system to detect applications process startup, as presented on figure 6. When an application process name is found, AC ensures that the binary belongs to the application, attaches to the found process and starts the steering execution. In pull mode, the AC instruments the batch scheduler with DyninstAPI and waits for the callback event generated by exec system call [11]. This allows application startup detection and control. We currently support OpenPBS [16] as proof of concept. In each of presented models of execution, the target execution machine should support DyninstAPI, without that, the dynamic tuning cannot be done [11].
Binary Packaging Approach To work in a Grid environment, the first change is that, the Analyzer is started independently of the application and the AC is in charge to start the tuning session. The idea of Binary Packaging approach is to track down application processes using the same binary distribution and execution used by the application. It is done by generating a composed binary using three applications: a glue code, the current application and the AC binary. That preparation step can be done by the developer or even by the application users before the execution. By doing that composition, at runtime, the first executed code is the one that is loaded on memory. The key idea is to put the glue code as the first application in the composed binary. In startup phase, the glue code locates the application and AC code within the composed binary, does some checkups initializations and executes the AC code. When the AC executes, it starts the application child process using the DyninstAPI library. The information needed at runtime by the glue code is a fixed size information record append at the end of the composed binary in preparation phase. When the glue code runs, it uses the information record to un-pack the AC and application code. After that, the glue code verifies if the environment has DyninstAPI installed by checking its environment variables. It the environment permits dynamic instrumentation, the glue code executes the AC code; elsewhere, it executes the application without instrumentation. If the AC is started, it creates the child process controlled by DyninstAPI as presented on figure 5.
MATE Enabled Machine
MATE Enabled Machine Taskn
AC
AC receives Analyzer information
startup detection
MATE Enabled Machine attach
AC
Taskn
DMLib control
Analyzer subscription
Figure 6: Sequence of process tracking using AC in System Service approach.
The distribution of MATE components over the Grid generates some problems. The application can use some Grid enable message parse interface such MPICH-G2 to perform inter-process communication [21]. To group by all
31
JCS&T Vol. 7 No. 1
April 2007 enable MATE to be used in a Grid, working within the Fabric Layer of the Grid Protocol Stack. With the selected communication mechanism, the tool respects the organization requirements and provides the security semantic characteristics to work on the Grid. Even with the tunlets already implemented in MATE, new tunlets should be developed to cover Grid specific performance models and its optimizations.
process from an execution session apart from other executions of same binary, process environment variable information is used. To locate the correct Analyzer instance running on the Grid, the MATE AC component may use the process environment variable GLOBUS_GRAM_JOB_HANDLE than contains the URL location of the process contract. The contract information contains the Job ID. With this identification the AC component uses the services provided by MATE Grid integration to register itself in the tuning session. Grid integration is done by a new component called AC Service Wrapper. This component provides web services compliant to WSRF [22] and exposes services which allows the Analyzer and AC components to locate each other. As presented on figure 7, the integration uses the Grid Information Services available from MDS [23]. The AC Service Wrapper registers itself to receive notification of tuning session startups. When the Analyzer register itself as responsible for a tuning session the registered ACs Wrapper receives this information and informs the AC daemon, represented as AC Service Daemon on Figure 7. The AC Service Daemon performs the System Service Approach and, in case of application process detection, it uses the MDS to publish the execution information. In response to that, the Analyzer uses the AC Service Wrapper services to establish communication channels between the AC back to Analyzer.
REFERENCES [1]
[2]
[3]
[4] [5]
Cluster Machine 1 Taskn
Globus Container AC Service Daemon AC Service Wrapper
Publishing of Execution Information
MDS
Subscription of Application Information
[6]
Management Channels
Management Channel
Event Data Channel
[7]
Analyzer
Figure 7: MATE Grid services integration sequence.
The communication between the Analyzer and AC is done by two different channels. The Management Channel transports messages of instrumentation request and change request. The Event Data Channel transports the generated event trace data resulted of the instrumentation. In order to respect the requirements of each VO component organization, the communication channels used between the AC and Analyzer components where modified to use middleware transport services. The communication between the AC and the Analyzer is done using Globus-XIO communication library [24] configured with the GSI driver over the TCP provided driver. By that implementation strategy, organization network use polices like available TCP ports are respected. The security access is restricted by PKI certificates used to submit application execution to the Grid.
[8]
[9]
[10]
[11]
[12]
5. CONCLUSIONS
[13]
Performance tuning of Grid application becomes very complicated due to unique Grid dynamic characteristics. Some properties are hard to predict such network bandwidth or selected resources through execution. The dynamic behavior of Grid environment reinforces the need of dynamic tuning tools since the user has less control about the application target execution hosts. The literature is not clear about what makes a tool enabled for Grids, although, if this tool could work within the Grid Protocol Stack, it is part of the system. We presented two alternatives that
[14]
[15]
[16]
32
J. L. Hennessy, D. A. Patterson, and D. A. Patterson, Computer architecture : a quantitative approach, 3rd ed. San Francisco, CA: Morgan Kaufmann Publishers, 2003. K. Castagnera, D. Cheng, R. Fatoohi, E. Hook, B. Kramer, C. Manning, J. Musch, C. Niggley, W. Saphir, D. Sheppard, M. Smith, I. Stockdale, S. Welch, R. Williams, and D. Yip, "Clustered Workstations and their Potential Role as High Speed Compute Processors," NAS Computational Services, Technical Report 1994. I. Foster and C. Kesselman, The Grid 2: Blueprint for a New Computing Infrastructure. San Francisco: Morgan Kauffman, 2003. I. Foster, C. Kesselman, J. M. Nick, and S. Tuecke, "The Physiology of the Grid," pp. 217--249, 2003. I. T. Foster, C. Kesselman, and S. Tuecke, "The Anatomy of the Grid - Enabling Scalable Virtual Organizations," in International Journal of High Performance Computing. vol. 15, 2001, p. 200. L. DeRose and D. A. Reed, "SvPablo: A MultiLanguage Architecture-Independent Performance Analysis System," in Proceedings of the ICPP 99 Japan, 1999, pp. 311-318. B. P. Miller, M. D. Callaghan, J. M. Cargille, J. K. Hollingsworth, R. B. Irvin, K. L. Karavanic, K. Kunchithapadam, and T. Newhall, "The Paradyn parallel performance measurement tool," Computer, vol. 28, pp. 37--46, 1995. C. Tapus, I.-H. Chung, and J. K. Hollingsworth, "Active Harmony: Towards Automated Performance Tuning," SC’02, November 2002. R. L. Ribler, H. Simitci, and D. A. Reed, "The Autopilot performance-directed adaptive control system," Future Gener. Comput. Syst., vol. 18, pp. 175--187, 2001. R. L. Ribler, J. S. Vetter, H. Simitci, and D. A. Reed, "Autopilot: Adaptive Control of Distributed Applications," in HPDC, 1998, pp. 172-179. B. Buck and J. K. Hollingsworth, "An API for Runtime Code Patching," Journal of High Performance Computing Applications, 2000. A. Morajko, "Dynamic Tuning of Parallel/Distributed Applications." vol. Phd: Universitat Autonoma de Barcelona, 2004. A. Morajko, O. Morajko, T. Margalef, and E. Luque, "MATE : Dynamic Performance Tuning Environment," LNCS, vol. 3149, pp. 98-107, 2004. A. S. Grimshaw, W. A. Wulf, and C. T. L. Team, "The Legion vision of a worldwide virtual computer," Commun. ACM, vol. 40, pp. 39--45, 1997. J. Frey, T. Tannenbaum, I. Foster, M. Livny, and S. Tuecke, "Condor-G: A Computation Management Agent for Multi-Institutional Grids," in Cluster Computing, 2002, pp. 237-246. "Portable Batch System Administrator Guide," Veridian Systems PBS Products Dept. 2672 Bayshore
JCS&T Vol. 7 No. 1
[17]
[18]
[19]
[20] [21]
[22]
[23]
[24]
April 2007
Parkway, Suite 810 Mountain View, CA 94043: Veridian Information Solutions, Inc., 2000. "Automatic TCP Window Tuning and Applications," in Issue of NLANR Packets: http://www.nlanr.net/NLANRPackets/v2.1/autotcpwi ndowtuning.html. M. T. Heath, Etheridge, J.A, "Visualizing the performance of parallel programs," IEEE Computer, vol. 28, pp. 21-28, November 1995. W. E. Nagel, A. Arnold, M. Weber, H. C. Hoppe, and K. Solchenbach, "Vampir: Visualization and Analysis of MPI Resources," Supercomputer, vol. 12, pp. 6980, 1996. I. T. Foster, "Globus Toolkit Version 4: Software for Service-Oriented Systems," in NPC, 2005, pp. 2-13. N. T. Karonis, B. Toonen, and I. Foster, "MPICHG2: A Grid-enabled implementation of the Message Passing Interface," Journal of Parallel and Distributed Computing, vol. 63, pp. 551--563, May 2003. K. Czajkowski, D. F. Ferguson, I. Foster, J. Frey, S. Graham, I. Sedukhin, D. Snelling, S. Tuecke, and W. Vambenepe, "The WS-Resource Framework," White Paper, 2005. K. Czajkowski, S. Fitzgerald, I. Foster, and C. Kesselman, "Grid information services for distributed resource sharing," in High Performance Distributed Computing, 2001. Proceedings. 10th IEEE International Symposium on, 2001, pp. 181--194. W. Allcock, J. Bresnahan, R. Kettimuthu, and J. Link, "Globus eXtensible Input/Output System (XIO): A Protocol Independent IO System for the Grid," ipdps, p. 179a, 2005.
33