OpenGL ES 2.0 API, adapted for JavaScript, which needs some special considerations as a ... Figure 1: SDK Architecture Outline (Christen and Nebiker, 2011) ...
Processing and Rendering Massive 3D Geospatial Environments using WebGL – The examples of OpenWebGlobe and SmartMobileMapping Robert Wüest, Hannes Eugster, Stephan Nebiker and Martin Christen Institute of Geomatics Engineering, FHNW University of Applied Sciences and Arts Northwestern Switzerland, Muttenz, Switzerland – (robert.wueest, hannes.eugster, stephan.nebiker, martin.christen)@fhnw.ch Generating and visualizing rich and interactive (geospatial) 3D contents over the World Wide Web (WWW) using state of the art web technologies such as WebGL as a native component of modern web browsers is a continuously growing approach to modern geospatial data exploitation. In this paper we are introducing OpenWebGlobe and 3DCityTV as two showcase applications to demonstrate the capabilities for exploiting massive 3d geospatial environments with current web technologies without the extensive use of third-party technologies such as browser plugins or extensions. Real time rendering of massive 3d virtual worlds using WebGL as well as the parallel processing and storage within common cloud computing services of large scale datasets will be discussed. Using an imaged-based approach to 3d modeling on vast stereo-vision based mobile mapping data will be introduced using an entirely web based 3d exploitation solution.
1 Introduction Over the last few years we have witnessed an explosion in the acquisition of geospatial data, most of all in geospatial imagery but also in terrestrial and airborne LiDAR data. These data provide the basis for global 3d geoinformation environments on the one hand and for very rich and detailed local or specialized 3d geoinformation environments on the other. The global 3d geoinformation environments are often referred to as virtual globes, with Google Earth as the most prominent example. Data capture for virtual globes is mainly based on satellite imagery and increasingly on highperformance digital airborne camera systems. Data for the second type of environments is typically acquired using imaging or LiDAR sensors of vehicle-based mobile mapping systems. Both types of 3d geospatial environments have in common that the amount of underlying geospatial data is massive. Data capture rates of image-based mobile mapping systems, such as presented in the paper, are in the excess of 1 TeraByte per hour leading to geospatial data repositories in the order of hundreds of TeraBytes to even PetaBytes. Recent developments in storage capacities, cloud computing technologies and new web technologies are gradually enabling the interactive web-based exploitation of such 3d environments by a broad spectrum of users – geospatial experts and non-experts alike. Generating and exploiting rich and interactive (geospatial) 3D contents over the World Wide Web (WWW) has been a constant ambition, ever since the creation of the WWW almost 20 years ago. Despite some early formats and standards such as VRML (Bell et al., 1995) and GeoVRML (Reddy et al., 2000), most efforts of delivering interactive and scalable geospatial contents over the Web required the installation of (proprietary) applications, specific run-time environments (e.g. Java Virtual Machine) or of browser-specific plugins. The emerging WebGL standard (Marrin, 2011) finally promises to provide a universal mechanism for exploiting even massive geometry-based 3d virtual worlds as well as 3d vision-based urban models directly within most Web browsers.
2 WebGL WebGL is a cross-platform, royalty-free web standard for a low-level 3D graphics API based on OpenGL ES 2.0. It is exposed through the HTML5 Canvas element as Document Object Model interfaces. WebGL is a shader-based API using the OpenGL Shading Language (GLSL), with constructs that are semantically similar to those of the underlying
OpenGL ES 2.0 API, adapted for JavaScript, which needs some special considerations as a memory-managed language (Khronos, 2012). In March 2011 Version 1.0 of the WebGL specification was released. Today WebGL runs in desktop and mobile web-browsers like Mozilla Firefox, Google Chrome, Safari, and Opera. In the Internet Explorer WebGL can currently only be used through plugins.
3 Creation and Dissemination of Massive 3D Geospatial Environments Data processing algorithms have been developed with a focus on scalability to very large data volumes – including imagery, such as orthophotos, georeferenced high resolution 3d imagery along street or rail corridors, as well as map and terrain data – and have been optimized for parallelism. We adapted these algorithms to support as many simultaneously working cores as possible and came up with a set of processing tools. All commands run on normal computers (regular laptops and work stations) and on HPC systems, including cloud computing services. The Message Passing Interface (MPI) is used to communicate and distribute the workload on our HPC cluster and uses OpenMP for multiprocessing.
3.1 HPC-based Development and Test Platform The development and test platform runs on the Microsoft Windows HPC Server 2008 R2. However, the code is cross platform and runs on Linux, too. The processing workflow can also be deployed on commercial clouds, for example using the implementation on Amazon Elastic Compute Cloud (Amazon, 2012) is possible. The local test cluster had the following setup: It consists of a head node DELL PowerEdge R710 with two quad-core processors and 16 GB RAM. The compute nodes are integrated into a M1000e blade chassis. Each compute node consists of two 6-core processors with 12 GB RAM and a NVIDIA Tesla M2050 GPU. Therefore we have a total of 48 CPU cores and 4 GPUs for computing.
3.2 Cloud-based Processing and Dissemination Considering commercial cloud providers, Amazon Web Services (AWS) was employed for testing the processing workflow on the cloud. By simply ordering EC2 instances running Microsoft Windows 2008 R2 SP1 Datacenter edition and 64-bit architecture the workflow can be deployed. For file based storage the elastic block storage (EBS) services of AWS was used.
4 Showcase 1: OpenWebGlobe – An Open Source Virtual Globe SDK
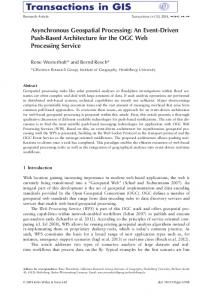
Figure 1: SDK Architecture Outline (Christen and Nebiker, 2011)
With the advent of WebGL it is possible to use out-of-core rendering algorithms in the web browser, which allows rendering massive geometries and textures, including city models, digital elevation models, or even virtual globes which must be capable to stream huge amounts of imagery, elevation data and other geospatial contents over the Internet. The OpenWebGlobe project (www.openwebglobe.org) was initiated by the Institute of Geomatics Engineering (IVGI) of the FHNW University of Applied Sciences and Arts Northwestern Switzerland (IVGI). It started in April 2011 as an Open Source Project following nearly a decade of 3d geobrowser development at the Institute. Together with developers from industry and from other universities, the functionality of the SDK is being extended continuously. The OpenWebGlobe SDK consists of two main parts: first, the OpenWebGlobe Viewer part, a JavaScript Library which allows the integration of the OpenWebGlobe into custom web-applications. Second, the OpenWebGlobe Processing Tools, a bundle of tools for bulk data processing, e.g. tiling, resampling or rectifying large geospatial data sets.
4.1 OpenWebGlobe Viewer SDK The included SDK is building up a scenegraph like structure at runtime with various interaction capabilities. The advantages of this approach derive from common architectures of 3d graphics engines. Among the basic objects (see Figure 1) is the context object which is the combination of a render window and a graphics engine. It corresponds to the WebGL context but in an abstracted form. The scene object describes the type of virtual globe visualization. A virtual globe is usually represented as 3d ellipsoid (WGS84), but it is also planned to create flat earth representations – especially for local scenes – or to create a 2d visualization which is usually a 2d map-type application. In the scene there is a camera object which controls what is visible. There can be several cameras in a scene, but only one is active at a given time. The camera has a navigation controller which allows navigation through the scene – for example with the mouse and keyboard as input. There is a default navigation controller available, but a custom navigation can also be implemented. A sample of a minimal application generated using the OpenWebGlobe SDK is shown below (see Figure 2). Using just a few lines of code to create a 3D virtual globe scene: 1 2 3 4 5 6 7 8 9 10 11 12 13 14 15 16 17 18 19 20 21 22 23 24
function main() { var ctx = ogCreateContextFromCanvas("canvas", true); var globe = ogCreateGlobe(ctx); var imgBlueMarble500 = { url : ["http://www.openwebglobe.org/data/img"], layer : "World500", service : "i3d" }; ogAddImageLayer(globe, imgBlueMarble500); }
4.2 OpenWebGlobe Processing Toolkit The processing tool kit consists of a set C/C++ console applications that are optimized for parallel processing. The implementations are genuinely platform independent and can be used on various platforms. The following processing possibilities (see Figure 3) have been implemented:
Tiling, rectifying and resampling image data
Processing elevation data: Triangulation, Hillshading
Spatializing pointclouds using voxel octrees
Rendering vector data (Shapefiles, PostGIS)
Figure 3: Processing various types of data
4.3 OpenWebGlobe Applications and Results
Figure 4: Swiss 3D Demo Viewer (Data: swissimage, DHM25 © swisstopo JD100033)
Swiss3D (http://swiss3d.openwebglobe.org) is a demo 3D viewer that has been developed using OpenWebGlobe in cooperation with the Swiss Federal Office of Topography (swisstopo). It shows rich image and elevation data in great detail (see Figure 4).
Figure 5: Armasuisse Mobile Enviroment Viewer showing large pointcloud data using OpenWebGlobe
Another project using large pointcloud data and embedding jQuery components can be seen in the following figure. This application was optimized for mobile clients as well. OpenWebGlobe is used to render the pointcloud and 3D objects.
Figure 6: SwizzQuiz: An interactive geographic exploration game
Along with a marketing campaign for the Insitute of Geomatics Engineering at the University of Applied Sciences Northwestern Switzerland a geographical quiz game was developed featuring challenging tasks and illustrates them using OpenWebGlobe with detailed image and elevation data and HTML 5 Canvas for overlay rendering.
5 Showcase 2: 3DCityTV® - A 3D Vision-based Mobile Mapping Technology While the primary focus in 3d geoinformation solutions had been on explicit 3d modelling, recently introduced imagebased modelling approaches offer interesting alternatives. Stereovision-based mobile mapping systems, for example, enable the efficient and highly detailed image-based digitizing of street or railway corridors (Burkhard et al., 2012; Eugster et al., 2012; Nebiker et al., 2012.Additionally), recent dense stereo matching algorithms allow the automatic extraction of real 3d images from the captured stereo image pairs. The captured imagery can be directly georeferenced with the additionally recorded INS/GNSS-based navigation data. The resulting precisely georeferenced 3d images allow the accurate 3d mapping of arbitrary street or rail infrastructure objects or the precise overlaying of existing geodata.
5.1 Mobile Data Capture
Figure 7: IVGI stereovision mobile mapping system, configured with a forward and a backward looking stereo system and a downward looking profile scanner
The stereo imagery for 3DCityTV services is captured using a stereovision mobile mapping system such as shown in Fig. 7. The system has been developed at the IVGI since 2009 as part of the SmartMobileMapping research project. The system was originally intended for road sign management and has since been developed into a multi-stereo mobile mapping system for a wide range of applications. The system consists of an Applanix POS LV 210 navigation system which is used to directly georeference the digital industrial cameras. Typically, the system is configured with multiple stereo camera systems with sensors of two (FullHD) and eleven megapixels respectively. All systems use GigE cameras with CCD sensors, global shutters, 12 bit radiometric resolution and a pixel size larger than 7 µm. The cameras are equipped with wide-angle lenses providing a large field of view of around 80 degrees and still preserving a high geometric accuracy. The sensors are mounted on a rigid platform and can be setup in various configurations with stereo bases of up to 1.5 m. Depending on the mapping mission the sensors are operated at 5 to 30 frames per second, leading to dense stereo image sequences and raw imagery in the order of one to several TB per hour.
5.2 Stereovision processing and exploitation software As part of the SmartMobileMapping project a comprehensive processing and exploitation pipeline (see Fig. 8) was developed covering the following aspects:
Figure 8: Stereovision processing pipeline and workflow for the multi-stereo imagery acquired using the stereovision mobile systems
System calibration including calibration procedures for interior orientation, relative orientation, misalignment and lever arm parameter estimation for multiple stereo systems.
Direct or integrated georeferencing of the captured stereo sequences, the latter integrating GNSS/INS- and vision-based observations (Eugster, 2012)
Stereo image pre-processing yielding radiometrically corrected, distortion free and normalised high resolution image sequences (Burkhard et al., 2012)
Dense depth map extraction and 3d point cloud generation. The current dense matching solution is based on a semi-global block matching algorithm as it is implemented in the OpenCV library.
Automated feature extraction, e.g. automated mapping of road signs, exploiting the depth information gained from dense stereo matching (Cavegn and Nebiker, 2012).
Cloud-based hosting and interactive exploitation either using a stereo client for stereoscopic measurements by geospatial professionals or a mono client supporting accurate 3d measurements by means of 3d monoplotting.
5.3 Cloud-based Data Handling While the data processing is entirely taking place on our HPC-System, the serving of the 3d imagery and metadata is done in the cloud using several services of Amazon AWS. The processed data is being uploaded and stored on EBSVolumes which can then be attached to an EC2-Instance acting as Webserver. The same Server is running a PostgreSQL Database containing metainformation of the uploaded Dataset. This Metadata is actually the key to being able to exploit the vast amount of data. It holds the spatial as well as the time context of the imagery and thus allows for the easy navigation through the otherwise unmanageable number of images. The 3DCityTV-Services currently running on the smallest possible instance available from Amazon Web Services, also called Micro-Instance. This type of Instance has proven to be able to well serve around ten parallel users. This straight-forward server architecture can be used for up to a few hundreds of parallel users by using more powerful Instances. However for massive user volumes a more complex architecture would be needed but this is not typically an issue with 3DCityTV-Services since they are only disclosed to a limited and previously defined group of users.
5.4 The 3DCityTV WebSDK
Figure 9: Web-based 3DCityTV service featuring a range of 3d monoplotting measuring functionality (including automatic determination of heights above ground as shown in case of the bridge).
For the web-based exploitation of the georeferenced 3d imagery, the 3DCityTV WebSDK was designed and implemented. The 3DCityTV WebSDK is also entirely based on HTML5/WebGL. It provides the 3d measurement functionality, the overlaying of geospatial content, the spatial and time-based navigation within the image database and the streaming of the high-resolution imagery over the web. Using the very dense stereo disparity information obtained from dense image matching, a dense depth map with a distance value for every pixel is streamed together with the corresponding image. This enables very simple but powerful image exploitation by means of 3d monoplotting (see Fig. 10). Based on the 3DCityTV architecture, for example, distributed web-based road infrastructure asset management solutions can be implemented. In such a solution, the 3d imagery can be fully integrated into existing geoinformation services and exploited by the various domains experts throughout major organisations such as national or regional departments of transportation. For this kind of application, a cloud based hosting of the service is employed. In combination with the 3DCityTV-WebSDK the cloud service can easy and flexibly be integrated with various existing (Web-) GIS and geo web services on different end user devices.
Fig. 10: Example of integration of the 3DCityTV technology with 3d monoplotting functionality into the Logo software by Geologix AG based on the 3DCityTV WebSDK
7 Conclusion As the web technologies progress and even larger amounts of data can be handled over the web directly, there are still challenges to be faced considering data transfer. Not just the amount of data being transferred is of importance but the effective costs arising from providing large scale data to multiple customers. This paper addresses just some of the tasks that come with the transition from desktop applications to web based solutions especially when talking about geospatial data exploitation. Using commercial cloud providers such as amazon is of greater importance to handle the described showcases in a sensible manner.
8 Weblinks
OpenWebGlobe: http://www.openwebglobe.org
Swiss3D Demo Viewer: http://swiss3d.openwebglobe.org
Institute of Geomatics Engineering (FHNW): http://www.fhnw.ch/habg/ivgi
iNovitas Mobile Mapping Solutions: http://www.inovitas.ch
9 References
Amazon, 2012. Amazon Elastic Compute Cloud (Amazon EC2) [WWW Document]. URL http://aws.amazon.com/de/ec2/
Bell, G., Parisi, A., Pesce, M., 1995. The Virtual Reality Modeling Language.
Burkhard, J., Cavegn, S., Barmettler, A., Nebiker, S., 2012. STEREOVISION MOBILE MAPPING: SYSTEM DESIGN AND PERFORMANCE EVALUATION. ISPRS - International Archives of the Photogrammetry, Remote Sensing and Spatial Information Sciences XXXIX-B5, 453–458.
Cavegn, S., Nebiker, S., 2012. AUTOMATED 3D ROAD SIGN MAPPING WITH STEREOVISION-BASED MOBILE MAPPING EXPLOITING DISPARITY INFORMATION FROM DENSE STEREO MATCHING. ISPRS International Archives of the Photogrammetry, Remote Sensing and Spatial Information Sciences XXXIX-B4, 61– 66.
Christen, M., Nebiker, S., 2011. OpenWebGlobe SDK - An Open Source High-Performance Virtual Globe SDK for Open Maps. Presented at the State of the map 2011.
Eugster, H., 2012. Echtzeit-Georegistrierung von Videodaten mit Hilfe von Navigationssensoren geringer Qualität und digitalen 3D-Landschaftsmodellen (Dissertation).
Eugster, H., Huber, F., Nebiker, S., Gisi, A., 2012. INTEGRATED GEOREFERENCING OF STEREO IMAGE SEQUENCES CAPTURED WITH A STEREOVISION MOBILE MAPPING SYSTEM – APPROACHES AND PRACTICAL RESULTS. ISPRS - International Archives of the Photogrammetry, Remote Sensing and Spatial Information Sciences XXXIX-B1, 309–314.
Khronos, 2012. WebGL - OpenGL ES 2.0 for the Web [WWW Document]. URL http://www.khronos.org/webgl/
Marrin, C., 2011. WebGL Specification, Version 1.0.
Nebiker, S., Cavegn, S., Eugster, H., Laemmer, K., Markram, J., Wagner, R., 2012. FUSION OF AIRBORNE AND TERRESTRIAL IMAGE-BASED 3D MODELLING FOR ROAD INFRASTRUCTURE MANAGEMENT – VISION AND FIRST EXPERIMENTS. ISPRS - International Archives of the Photogrammetry, Remote Sensing and Spatial Information Sciences XXXIX-B4, 79–84.
Reddy, M., Iverson, L., Leclerc, Y.G., 2000. Under the hood of GeoVRML 1.0, in: Web3DVRML 2000 Fifth Symposium on Virtual Reality Modeling Language, VRML ’00. ACM Press, pp. 23–28.