morphologies, and mechanical properties of polymer/clay nanocomposite foams
were ..... From figure 2, it was demonstrated that clay particles provide favorable.
Journal of Physics: Conference Series
Related content
Processing, Characterization, and Modeling of Polymer/Clay Nanocomposite Foams To cite this article: Choonghee Jo and Hani E Naguib 2007 J. Phys.: Conf. Ser. 61 861
View the article online for updates and enhancements.
- Effect of nanoclay loading on the thermal decomposition of nanoclay polyurethane elastomers obtained by bulk polymerization Javier Quagliano and Javier Bocchio - Accounting for the lack of nano-effect in a thermoset/clay nanocomposite: A positron annihilation study S K Rath, K Sudarshan, M Patri et al. - Novel thermoplastic starch–clay nanocomposite foams Meng Chen, Biqiong Chen and Julian R G Evans
Recent citations - Investigation of cell structure and expansion ratio of microcellular polypropylene nano-homocomposites prepared by a solid-state process Seifollah Jamlpour and Seyed Reza Ghaffarian - Amphiphilic poly(N-vinyl pyrrolidone) grafted graphene by reversible addition and fragmentation polymerization and the reinforcement of poly(vinyl acetate) films Rama K. Layek et al - High-Performance Nanocomposites of Sodium Carboxymethylcellulose and Graphene Oxide Rama K. Layek et al
This content was downloaded from IP address 185.107.94.33 on 06/10/2017 at 20:08
IOP Publishing doi:10.1088/1742-6596/61/1/172
Journal of Physics: Conference Series 61 (2007) 861–868 International Conference on Nanoscience and Technology (ICN&T 2006)
Processing, Characterization, and Modeling of Polymer/Clay Nanocomposite Foams Choonghee Jo1 and Hani E Naguib2,3 1
Department of Mechanical Engineering, University of Ottawa, Ottawa, Ontario, Canada 2
Department of Mechanical and Industrial Engineering, University of Toronto, Toronto, Ontario, Canada E-mail:
[email protected]
Abstract. The effects of the material parameters and processing conditions on the foam morphologies, and mechanical properties of polymer/clay nanocomposite foams were studied. Microcellular closed-cell nanocomposite foams were manufactured with poly(methylmethacrylate) (PMMA) and high density polyethylene (HDPE), where the nanoclay loadings of 0.5, 1.0, and 2.0 wt% were used. The effect of clay contents and foaming conditions on the volume expansion ratio, cell size, elastic modulus, tensile strength, and elongation at break were investigated and compared between amorphous and semicrystalline polymers. An elastic modulus model for tensile behavior of foams was proposed by using the micromechanics theory. The model was expressed in terms of microstructural properties of polymer and physical properties of the foams. The tensile experimental data of the foams were compared with those predicted by the theoretical model.
1. Introduction Polymer/clay nanocomposites are of interest because the nanometer scaled filler can be used as a nucleation agent in the foaming process. The nanometer scaled silicate pellets with a high aspect ratio and their nanometer scale dispersibility tend to produce a good reinforcement and improve the mechanical properties of the polymer [1-2]. Also, nanocomposites generally provide improvements in transport barrier, thermal resistivity, and flame-retardance in comparison with the original polymers [3-5]. The mechanical properties of microcellular foams have been of great interest in recent years because of their unique microstructure. Microcellular foams are usually defined as foams having average cell sizes in the order of 10 µm and cell densities in the order of 109–1015 cells/cm3 [6]. The effect of the nanoparticles on the elastic modulus of polymer nanocomposites has been studied experimentally [7-12]. Generally, the elastic modulus of polymer/clay composites increases with augmenting the clay volume fractions [13-15]. The enhancing phenomenon is due to the exfoliation of the clays in the matrix, and the high aspect ratio of clay particles. In general, compared to the amorphous polymer, foaming of the semicrystalline polymer is difficult because of the crystalline structures in the semicrystalline polymer. _____________________________________ 3
To whom any correspondence should be addressed.
© 2007 IOP Publishing Ltd
861
862
In this study, microcellular PMMA and HDPE/clay nanocomposite foams were manufactured using a batch processing method with nanoclay loadings of 0.5, 1.0, and 2.0 wt%. The effects of the nanoclay, and foaming conditions on the foam morphology, as well as the mechanical properties of the foams, were investigated. The results were compared. Models for estimating the tensile elastic modulus of closed-cell PMMA and HDPE/clay foams were presented and compared with the experimental results. 2. Experimental 2.1. Materials PMMA resin with a Mw=108,500 and a Mn=56,700 was supplied by Canus Plastics. HDPE (SCLAIR 59A, Nova Chemicals) with a density of 0.962 (ASTM D792) and a melt index of 0.72 g/10 min (ASTM D1238) was used. The maleic anhydride-grafted HDPE (PE-g-MAn, Fusabond MB100D, DuPont, Canada) was used as a coupling agent Organically modified clay with dimethyl dehydrogenated tallow alkyl ammonium (Cloisite 20A, Southern Clay Products) was employed as a layered silicate. A commercial grade carbon dioxide provided by Praxair was utilized as a blowing agent. Analytical reagents methanol and toluene were supplied by Fisher Scientific. 2.2. Preparation of polymer/clay nanocomposites The PMMA/clay nanocomposite powders with clay contents of 0.5, 1, and 2 wt% were prepared using a solvent co-precipitation method. In this method, dispersions of 0.4 wt% Cloisite 20A in toluene and solutions of 10 wt% PMMA in toluene were prepared. After being stored at room temperature for three days, the organoclay dispersions were sonicated in an ultrasonic bath (model FS140 which was supplied by Fisher Scientific) for one hour. The sonicated materials were then added to the PMMAtoluene solution while stirring with a magnetic stirrer. The mixtures were then precipitated in methanol/toluene (20:1 volume parts) with vigorous stirring. The resultant PMMA/clay precipitate was then washed two more times with methanol/toluene (10:1 volume parts), and dried at room temperature for two days, and finally placed under a vacuum at 90ºC for three days [16]. HDPE/clay nanocomposites were prepared using a counter-rotating intermeshing twin-screw extruder (Model D6/2, C.W. Brabender) having a barrel temperature profile ranging from 140 to 180°C from the feeding zone to the die zone at a screw speed of 70 rpm. The PE-g-MAn content was fixed at 15 wt% and the clay contents were varied at 0.5, 1.0, and 2.0 wt%. The extrudate was palletized. The pelletized HDPE/clay nanocomposites and the resulting PMMA/clay powders were then compression molded with a hydraulic heated press machine (Caver Inc.) using five tons of force (14.5 MPa). The temperature of the hot pressing plates was 160ºC (for 10 minutes) and 180ºC (for 4 minutes) for HDPE and PMMA/clay nanocomposites, respectively. The molded samples were quenched in cold water to room temperature. The size of compression-molded samples was 6 mm × 50 mm × 1.55 mm (width × length × thickness). 2.3. Microcellular foaming A batch foaming process was used for foaming of the PMMA and HDPE/clay nanocomposites. In the first stage, the compression-molded samples were saturated in a highly pressurized CO2 chamber at 5.8 MPa, at room temperature, for three days. Then, the pressure was released rapidly to supersaturate samples with CO2. The HDPE/clay nanocomposite samples were immersed in a hot glycerin bath for foaming, where the foaming temperature was 130°C. The saturated PMMA/clay nanocomposite samples were put in a water bath with a temperature of 60°C. In order to control the expansion ratio, variable foaming times were used. The foamed samples were immediately quenched in cold water to prevent cell deterioration. 2.4. Sample characterization and mechanical testing Foam density was measured by a buoyancy method using a density determination kit supplied by Denver Instruments. The Archimedean principle was applied for determining the specific gravity of
863
the foams. The relative foam density is defined as the ratio of the foamed to unfoamed polymer density, whereas the expansion ratio is defined as its inverse. The foam samples were examined using scanning electron microscopy (SEM). The samples were coated using a cold coating process by applying a thin layer of gold with the aid of a sputter coater (SEM Coating Unit PS3). The gas pressure was set at 2 kPa (20 mbar) and the current was applied at 9–10 mA. The entire coating time lasted 70 seconds. The edges of the coated samples and the SEM mounts were then painted with a conductive carbon paste. A JSM scanning electron microscope (Model 6060) was then operated at 20 kV, and images were acquired from several locations on each sample. Uniaxial tensile tests were performed with an Instron 4482 machine with a 100 kN load cell at room temperature. A crosshead speed of 50 mm/min for HDPE/clay foams and 1.0 mm/min for PMMA/clay foams was used, and the strain was measured based on the change in the displacement of the crosshead. The elastic modulus was obtained from the maximum slope at the initial elastic portion of the stress-strain curves. The tensile strength and elongation at break were also reported. A minimum of five specimens were tested for each data point, and the averages were reported. 3. Modeling of polymer/clay nanocomposite foams The mechanical properties of polymer/clay nanocomposites were functions of the intercalated and agglomerated clay particles in the polymer matrix. In this respect, a model for the elastic modulus of PMMA/clay nanocomposite foams was developed [17] as:
(
Ec = Em + v pi′T vm′ + v pi′T *
)
32 2 (1 − ν 2 ) 2 2 φ ρ r + (1 − φ ) ρ r . ( E p − Em ) 1 + fa v p 15 −1
−1
(1)
In Eq. (1), Em and E p are elastic moduli of polymer matrix and clay particulates, respectively. Also, v p , vm′ , and v pi′ are volume fractions of clay particles, polymer matrix, and intercalated clay regions,
respectively. f a is the agglomerated fraction of clays. T, as a part of concentration factor, is expressed −1
as T = 1 + SEm −1 ( E p − Em ) , where S is Eshelby’s tensor. The foam parameters ρ r and φ are relative density of foams and the volume fraction of solid contained in the cell edges, respectively. The value of φ is determined by experiments. For modeling of the elastic modulus of HDPE/clay nanocomposite foams, the thicknesses of crystalline and amorphous layers can be assumed not to be changed [18-19]. Also, all clay particles are considered as intercalated structures using variable clay spacing with clay contents. If the intercalated clay stacks are modeled as cuboids which have random angles with load direction, and deform uniformly in the length and thickness directions, the displacement of the clay stack in the load direction can be estimated as: u p = δ a3 cos θ , (2) where θ is the angle between the clay plane and the plane perpendicular to the load. The displacement in clay thickness direction ( δ a3 ) is calculated when an overall tensile stress ( σ ) applies in a representative volume element (RVE):
δ a3 = σ a3 cos 2 θ ( ER ) , −1
(3)
where ER is the elastic modulus of laminated composite by the Reuss model ( θ = 0 ). Since the displacement in the same direction without clay is u0 = σ a3 ( Em cos θ ) , the decrease of the tensile displacement due to the presence of the clay is: −1
u = u0 − u p =
σ a3 cos θ
1 cos 4 θ − , ER Em
(4)
864
where Em is the elastic modulus of polymer matrix. Thus, the decreased overall strain due to a clay stack can be obtained by using the RVE concept as:
εα =
1 2
∫ V π
π 2
0
u ⋅ a12 cos θ dθ =
1 3 σ − . V Em 8 E R
a12 a3
(5)
Then, the overall strain decreased by all intercalated clay stacks are expressed as:
1 3 ε p = N ε α = v piσ − . Em 8 E R
(6)
where v pi is the volume fraction of the intercalated clay regions defined in the previous work [17]. By using the effective strain ( ε = ε 0 − ε p ) decreased by ε p , the effective elastic modulus of HDPE/clay nanocomposites is yielded as: −1
3v pi E p − v pi ( E p − Em ′ ) , E = Em′ 1 − v pi + 8E p
(7)
in which Em′ is the elastic modulus of HDPE containing PE-g-MAn. When PE-g-MAn is added to the HDPE the elastic modulus increased by 4% compared to the pure HDPE [20]. Next, modeling of the elastic modulus of HDPE/clay nanocomposite foams can be obtained based on the two conditions: the voids have dilute distribution in the polymer matrix and are randomly distributed, which is possible because most HDPE/clay nanocomposite foams have relatively low volume expansion ratios [18,21,22]. In this study, the shape of voids in the foams is assumed as spherical cavities. Under the uniaxial tensile loading, the cavities in RVE cause an increase of the tensile strain. Thus, the overall strain increment of the polymer nanocomposites containing voids can be estimated from the locally incremented strains. When the coordinate axes are formed at the center of a spherical cavity of radius R, the displacement field in the infinite elastic body under uniaxial remote tension ( σ ) was derived within the linear elastic theory [23]. Then, the radial displacement at the surface of the spherical cavity is obtained from the displacement field as: 3σ R (1 − ν ) 1 5 (8) uR = + cos 2θ , µ (7 − 5ν ) 1 + ν 4 where ν is the Poisson’s ratio, and µ is the shear modulus. The additional overall volumetric strain by a cavity was defined in the previous work [17] and obtained, integrating from θ = 0 to θ = π , as: 1 π R 3 (1 −ν ) (9) εR = σ . V µ (1 + ν ) For simplicity’s sake, when all N cavities in RVE are assumed to be uniform and have diluted distribution, ε c = N ε R is formed. Therefore, the additional volumetric strain due to the presence of the cavities is: 3(1 −ν ) (10) εc = f σ , 4 µ (1 + ν ) where f is the volume fraction of the cavities in RVE. Within the isotropic linear elasticity, the uniaxial tensile stress ( σ ) and tensile strain ( ε ) are used in the expression of volumetric deformation with bulk modulus. Similarly, the effective bulk modulus ( K ) and effective volumetric strain ( ε v )
can be used to represent the elastic property of foams, which gives the equation σ 3 = K ε v . By using the effective volumetric strain ( ε v = ε v + ε c ) and the linear relationship between the elastic modulus and the bulk modulus, the elastic modulus of HDPE/clay foams, which is valid at low void fractions, can be expressed as:
865
E = Em′ 1 − v pi + *
−1
3(1 −ν ) E p − v pi ( E p − Em ) 1 − (1 − ρ r ) . 8E p 2(1 − 2ν ) 3v pi
′
(11)
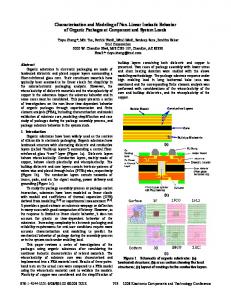
4. Results and discussion The scanning electron micrographs for foamed samples are shown in figure 1. PMMA/clay nanocomposite foams have cell sizes from 10 µ m to 100 µ m, and the cell size decreased as clay content increased. On the other hand, HDPE/clay nanocomposites produced foams of much smaller cell size (~1 µ m) and also show low volume expansion ratios. These phenomena are due to the crystalline structure in HDPE which influences the solubility and diffusivity of CO2. The effects of the clay contents and foaming times on the volume expansion ratio of the polymer/clay nanocomposite foams are shown in figure 2. The changes of the relative density show similar trends in both PMMA/clay foams and HDPE/clay foams. During the initial stage of foaming, the relative density decreased with increasing the clay contents. The higher foam expansion ratio with high clay contents resulted from more heterogeneous nucleation sites by high clay loading. Also, it brings about increased cell density as shown in the figure. On the other hand, at the later stage of foaming, high nanoclay loading (2.0 wt%) caused increase in the foam density. During this stage, the cell growth becomes more significant. Thus, a high diffusivity with high clay loading promotes excessive cell growth and gas loss. Hence, the polymer-clay system starts to loose the blowing agent and the cell growth stage is suppressed. This instability in the cell growth mechanism leads to the cell coalescence or deterioration in the foam structure and, consequently, the foam density at 2.0 wt% clay loading increased. Figure 2 indicates that relatively low void fractions are achieved in HDPE/clay nanocomposite foams. Rachtanapun’s [21] experimental results also showed similar volume expansion ratios with this experiment. From figure 2, it was demonstrated that clay particles provide favorable conditions for foaming, in the polymer. Higher volume expansion can be achieved with HDPE/clay foams by increasing the foaming temperature [21-22]. However, high foaming temperatures may cause the deformation of the samples and, as a result, decrease the mechanical strength. The uniaxial tensile test results of the foams are plotted in figure 3. The HDPE/clay foams have some plastic deformation while the PMMA/clay foams show only elastic behavior, which results from the separation of the crystalline block segments in HDPE. By adding the clay particles, the elastic modulus and tensile strength were increased somewhat. However, the percent elongation at break decreased in both polymers as the clay content increased. As represented in the figure, at 0.5 wt% clay loading, the elastic modulus and tensile strength was improved the most. In figure 4, the effect of the nanoclay loadings on the elastic modulus of PMMA and HDPE/clay nanocomposites was represented. Generally, the dispersed clay platelets in HDPE lead to increased elastic properties [20]. As shown in the figure, the elastic modulus of HDPE was improved by 9 % when nanoclays were added. However, the effect of the increase of the clay contents on the elastic modulus was small. This could be a result of the degree of the intercalation. Other researchers also reported that the clay fraction in HDPE has little effect on the intercalation extent within 5 wt% clay loadings [15]. This phenomenon is different from the case of PMMA/clay nanocomposites, where the modulus was reinforced by 27 % up to 0.5 wt% clay loadings and decreased gradually as clay contents increase. It can be deduced from this comparison that the amorphous polymer can be reinforced more than the semicrystalline polymer case. The effects of the clay loadings on the elastic modulus of polymer/clay nanocomposite foams are shown in figures 5 and 6. The theoretical model for the elastic modulus of PMMA and HDPE/clay nanocomposite foams were compared with the experimental results in the figures. It was demonstrated in figure 5 that the parameter, φ , increased at higher (2.0 wt%) clay loading, which is similar to the agglomeration effect. In figure 5, the parameter φ was determined to be able to fit to the experimental data. The increase of the parameter φ means that the cell walls became weak and consequently, the modulus went down with increasing the clay particles. The reinforcing effect of the clays on the elastic modulus of the foams was maximized at 0.5 wt% clay loading, and then decreased as the clay content
866
increased. This decreasing phenomenon implies that some of the nanoclays acted as a deteriorating effect in the foams. Lee [14] reported that some stacked clays were found above 3 wt% clay loading when PE-g-MA was used as a compatibilizer in synthesizing nanocomposites. As expected, higher Poisson’s ratio was used at high clay loading in the model for HDPE/clay foams, which implies that clay particles behaved as an obstacle factor during the deformation.
Acknowledgements The authors wish to thank the Natural Sciences and Engineering Research Council of Canada (NSERC) for their financial support. References [1] Giannelis E P 1996 Adv. Mater. 8 29-35 [2] Alexandre M and Dubois P 2000 Mat. Sci. and Eng. 28 1-63 [3] Bharadwaj R K 2001 Macromolecules 34 9189-92 [4] Kumar S, Jog J P and Natarajan U 2003 J. Appl. Polym. Sci. 89 1186-94 [5] Du J, Zhu J, Wilkie C A and Wang J 2002 Polym. Deg. Stab. 77 377-81 [6] Kumar V, VanderWel M, Weller J and Seeler K A 1994 J. Eng. Mat. Tech. 116 439-45 [7] Luo J-J and Daniel L M 2003 Compos. Sci. Technol. 63 1607-16 [8] Cho J W and Paul D R 2001 Polymer 42 1083-94 [9] Lee K Y and Goettler L A 2004 Polym. Eng. Sci. 44 1103-11 [10] Vu Y T, Rajan G S, Mark J E and Myers C L 2004 Polym. Int. 53 1071-77 [11] Kuo M C 2005 Mater. Chem. and Phy. 90 185-95 [12] Murphy M J, Truss R, Halley P, Martin D and Ang C L 2003 ANTEC 1189-93 [13] Osman M A, Rupp J E P and Suter U W 2005 Polymer 46 1653–60 [14] Lee J H, Jung D, Hong C E, Rhee K Y and Advani S G 2005 Compos. Sci. Tech. 65 1996–2002 [15] Zhong Y and Kee D D 2005 Polym. Eng. Sci. 45 469–77 [16] Manninen A, Naguib H E, Nawaby A V and Day M 2005 Polym. Eng. Sci. 45 904–14 [17] Jo C, Fu J and Naguib H E 2006 Constitutive modeling for intercalated PMMA/clay nanocomposite foams Polym. Eng. Sci. Accepted, In press [18] Lee Y H, Park C B, Wang K H and Lee M H 2005 J. Cell. Plast. 41 487-502 [19] Schultz J M 2001 Polymer Crystallization: The Development of Crystalline Order in Thermoplastic Polymers (Whahington, D.C.: Oxford University Press) Chapter 4 [20] Gopakumar T J, Lee J A, Kontopoulou M and Parent J S 2002 Polymer 43 5483–91 [21] Rachtanapun P, Selke S E M and Matuana L M 2003 J. Appl. Polym. Sci. 88 2842–50 [22] Rachtanapun P, Selke S E M and Matuana L M 2004 J. Appl. Polym. Sci. 93 364–71 [23] Li Z R, Lim C W and He L H 2006 Eur. J. Mech. A/Solids 25 260–70
(a)
(b)
(c)
867
(d)
(e)
(f)
Figure 1. Scanning electron micrographs of PMMA/clay nanocomposite foams (×100) and HDPE/clay nanocomposite foams (×10000): (a) 0.5 wt% clay-PMMA; (b) 1.0 wt% clay-PMMA; (c) 2.0 wt% clay-PMMA; (d) 0.5 wt% clay-HDPE; (e) 1.0 wt% clay-HDPE; (f) 2.0 wt% clay-HDPE.
1
Relative density
0.9 HDPE/0.5 w t% clay HDPE/1.0 w t% clay HDPE/2.0 w t% clay PMMA/0.5 w t% clay PMMA/1.0 w t% clay PMMA/2.0 w t% clay
0.8 0.7 0.6 0.5 0.4 0
10
20
30
40
Foaming time (sec)
Figure 2. Effect of foaming time and clay contents on the foaming degree.
25 20
15
0.5 %
( ρ r = 0.56) 10 1.0 % ( ρ r = 0.54) 2.0 % ( ρ r = 0.52)
5
Stress (MPa)
Stress (MPa)
20
15
0%
10
1.0 %
5
2.0 % 0 0.00
0.5 %
0 0.01
0.02
0.03
Strain
(a)
0.04
0.05
0
0.2
0.4
0.6
0.8
Strain
(b)
Figure 3. Effect of clay contents on the tensile behavior of polymer/clay nanocomposite foams: (a) PMMA/clay foams; (b) HDPE/clay foams ( ρ r = 0.95).
Relative modulus of elasticity
868
1.4 1.2 1.0 0.8 0.6
PMMA/clay nanocomposites
0.4
HDPE/clay nanocomposites
0.2 0.0 0.0
0.5
1.0
2.0
Nanoclay contents (wt.%)
Relative elastic modulus
Figure 4. Effect of clay loadings on the elastic modulus of polymer/clay nanocomposites.
0.3
0.2 PMMA/0.5% clay PMMA/1.0% clay PMMA/2.0% clay Equation (1), (φ = 0.5) Equation (1), (φ = 0.7)
0.1
0.0 0.2
0.4
0.6
0.8
Relative density
Relative modulus of elasticity
Figure 5. Comparison of the theoretical prediction with experimental results (PMMA/clay nanocomposite foams).
1.0
0.9
0.8 HDPE/0.5% clay foams HDPE/1.0% clay foams HDPE/2.0% clay foams Equation (11) (ν = 0.3) Equation (11) (ν = 0.35)
0.7
0.6 0.92
0.94
0.96
0.98
1
Relative density
Figure 6. Comparison of the theoretical prediction with experimental results (HDPE/clay nanocomposite foams).