ISSN 1087-6596, Glass Physics and Chemistry, 2018, Vol. 44, No. 1, pp. 33–40. © Pleiades Publishing, Ltd., 2018. Original Russian Text © R.S. Bubnova, V.A. Firsova, S.N. Volkov, S.K. Filatov, 2018, published in Fizika i Khimiya Stekla.
RietveldToTensor: Program for Processing Powder X-Ray Diffraction Data under Variable Conditions R. S. Bubnovaa, *, V. A. Firsovaa, S. N. Volkova, and S. K. Filatovb aGrebenshchikov
Institute of Silicate Chemistry, Russian Academy of Sciences, St. Petersburg, 199034 Russia bSt. Petersburg State University, St. Petersburg, 199034 Russia *e-mail:
[email protected] Received September 19, 2017
Abstract⎯The RietveldToTensor program is designed to study crystal lattice deformations using the Rietveld method from the X-ray powder diffraction data gathered under varying physical and chemical conditions. Using the program, it is possible to determine the tensor of thermal expansion, compressibility, or chemical deformations of the material. The program runs on the Microsoft Windows 7 and higher platforms. Keywords: Rietveld method, high-temperature X-ray powder diffraction, crystallographic software DOI: 10.1134/S1087659618010054
unit cell parameters on temperature (pressure or chemical composition), and calculating the coefficients of thermal expansion. The program can be used only to refine the crystal structure. These steps are discussed in detail below. Initial data. The RietveldToTensor program runs on the Microsoft Windows 7 and higher platforms. To create the source working files, we can use the FormExp plug-in. Text files of experiments with the extension .xyd can be imported, as well as the files obtained on Rigaku diffractometers (.asc and .txt extensions). Diffraction data obtained at any wavelength of X-ray radiation can be processed. The structured data can be entered manually, as well as by importing the CIF file. Visualization of the experimental data. Three ways to graphically represent arrays of X-ray patterns are implemented. In the mode of “Intensity”, the data obtained under variable conditions are shown one above the other (Fig. 2a). In the 2D surface mode (Fig. 2b), the data are shown on the 2θ–T axes (diffraction angle–temperature), while the color intensity corresponds to the intensity of the signal (a light color indicates low intensity, a dark color indicates high intensity). In the 3D surface mode (Fig. 2c), the data are presented on three axes: 2θ–T–I. The intensities can be presented both on linear and logarithmic scales. Rietveld wizard. The Rietveld method [6] is based on the approximation of the model X-ray diffraction profile to the experimental one using the least-squares method. The refinement criterion is the R factor, which is the sum of the squares of the differences between the calculated and observed intensities. The
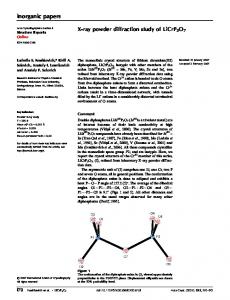
INTRODUCTION X-ray diffraction data allow us to mainly solve two problems: to determine the quantitative phase composition and to refine the structural parameters of the phases (unit cell parameters and the crystal structure parameters). Carrying out X-ray diffraction under variable conditions allows us to study the chemical transformations taking place in the sample, to construct phase diagrams, and to determine thermal expansion thensor, compressibility thensor or chemical deformation thensor. There are numerous Rietveld method–based programs [1–6], designed to process powder X-ray diffraction data. However, only some of them are capable of processing and interpreting the data obtained under variable physical and chemical conditions. The latter include the programs Powder3D [7] and ThetaToThensor [8]. Programs Fullprof [3] and TOPAS [5] also allow us to work with arrays of X-ray patterns. A parametric Rietveld refinement technique [9], which involves approximating the profile and structural parameters by monotonic functions, is known. In this paper we present the RietveldToTensor software, aimed at processing large sets of diffraction data with the Rietveld method and its interpretation. The program’s features will be demonstrated using the example of our recent thermal studies. PROGRAM FEATURES Working with the program (Fig. 1) involves the input of data, processing X-ray data sets by the Rietveld method, approximating the dependences of the 33
34
BUBNOVA et al.
(a)
Data input
T, °C 1000 800
Master of Rietveld method
600 400 Approximation of changes in unit cell parameters
200 48
50
52
Calculation of tensor figure
54 56 2θ, deg
58
60
(b)
T, °C 1000 800
Data export
600 400
Fig. 1. Flow chart of RietveldToTensor.
200
R factor is a nonlinear functional, depending on the parameters, being refined. To find the minimum of this functional, the method of estimating nonlinear parameters is applied [10]. The refinement process takes several iterations, the number of which is specified by the user. To refiniment process control, a damping coefficient is used (varying from 0 to 1). At each iteration, the increments of all the specified parameters are multiplied by this coefficient. There are three groups of refined parameters: instrumental, profile, and structural. The instrumental group includes the zero position of the X-ray tube slit and the displacement of the sample surface from the center of the focusing circle of the goniometer. The profile parameters include the background parameters, the scale factor, the ratio of the phase content (in the case of the multiphase sample), the parameters determining the shape of the peaks, the asymmetry coefficient, and the texture parameter. In the program (Fig. 3), three methods of background modeling are provided: by the Chebyshev polynomial or power polynomial of any power, as well as by cubic splines with the coefficients calculated from the values of the abscissa and ordinates of the points specified by the user. The broadening of the peaks is determined by the instrument’s geometry, size of the coherent scattering regions (CSRs), and deformations of the crystal lattice. The half-width part caused by the device is calculated as the sum of the half-widths caused by the vertical and horizontal divergence of the goniometer, the width of the slits of the X-ray tube and detector, the absorption of the sample, the spectral function, and
48
50
52
54 56 2θ, deg
58
60
(c) T, °C 1000 800 600 400 200 48
50
52
54 56 2θ, deg
58
60
Fig. 2. Visualization of data of themal X-ray diffraction experiment. Possibility of representing X-ray diffraction patterns one above other (a), in 2θ–T axes (b), and threedimensional image in 2θ–T–I axes (c) is shown.
the flat shape of the sample. These half-widths are calculated using aberration functions [11]. The remaining half-width fraction can be calculated in two ways: using the calculation of the size of the CSRs (D) and/or the pseudoVoigt function. The size of the CSRs can be determined by the formula D = 0.94λ/(scosθ), where s is the refined parameter and λ is the wavelength of the used X-ray.
GLASS PHYSICS AND CHEMISTRY
Vol. 44
No. 1
2018
RIETVELDTOTENSOR: PROGRAM FOR PROCESSING POWDER X-RAY
35
Refinement of structure
To select interval, click column header
T(°C) = 0 1.498% CaO 98.502% finish
40 000 35 000 30 000
Zero angle of detector Shift sample from axial axis of goniometer, mm
Structural parameters:
Intensities
25 000
Profile parameters:
Criteria stop: Number of cycles:
20 000 15 000 10 000
Shift/standard deviation