The crisis manifested by a low efficiency of the implementation of software projects. ... At the same time a new trend in software project management - agile.
7 Progress Visualisation and Estimation in Agile Software Project Management
In the 70 - 80 years of the XX century in the area of software crisis becomes apparent. The crisis manifested by a low efficiency of the implementation of software projects. Low enough that this situation is called "chaos". Studies conducted in 1994 by Stadnish Group showed that only 16% of software projects were successfully accomplished. At the same success was understood in very simple way: as the maintenance of the three most important design parameters for the scheduled earlier level. These three distinguishing features of success are: duration of project realization, cost and compatibility of the product delivered with the original specification. Reaction to the chaos in the implementation of IT projects was introduction an order in the area of software development. A new field of science known as software engineering appeared, artefacts and processes of design and manufacturing were partially formalized and standardized. At the same time the processes of execution began to be organized, by introducing the system method of project management to software development processes. It was believed that the ordering of processes can be achieved by introducing the detailed planning of tasks and rigorous control of their execution. The arrangement should have increased the success rate of software projects.
116
Varia Informatica 2011
Formalization actions gave clear results. Subsequent studies conducted by Stadnish Group showed significant improvement of the situation. According to a report prepared in 2006 already 35% of software projects ended successfully. At the same time a new trend in software project management - agile management appears. Agile approach is a reaction to excessive formalization of the project management processes by classical methodologies (sometimes called heavyweight). This formalization is not liked by developers as unnecessary, redundant and limiting individual rights. The concept of agile developed strongly after the announcement in the 2001 Manifesto for Agile Software Development. The era of agile methodologies has begun. Agile practices are becoming more and more popular. Report [STA10] shows that 22% of companies realize all projects in agile, and 45% of them - more than half. Agile Method does not mean chaos in the development process, but rather the abandonment of unnecessary formalization for the use of agile practices. The primary objective of projects managed by agile method is rapid, iterative delivery of valuable product to the customer. An important element of the Agile Method is creating efficient teams with excellent communication. This communication is supported with a number of simple methods and techniques visualizing the status of the project and allowing estimation of its parameters.
7.1.
AGILE PROJECT MANAGEMENT
Based on experience with the incremental and adaptive software development methods which are opposites of waterfall model of development, in 2001 there was published the Agile Manifesto [MAN11]: “We are uncovering better ways of developing software by doing it and helping others do it. Through this work we have come to value:
Individuals and interactions over processes and tools
Working software over comprehensive documentation
Customer collaboration over contract negotiation
Responding to change over following a plan
Progress Visualisation and Estimation in Agile Software Project Management
117
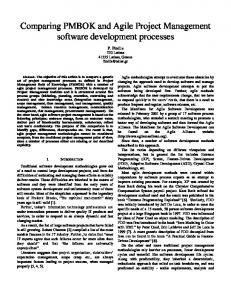
That is, while there is value in the items on the right, we value the items on the left more.” Before Agile Manifesto in principle all major lightweight methods have been already established: Scrum, Extreme Programming, Future Driven Development, and others. Manifesto and its dissemination among the developer gave them a common ideology (and a new name: "agile") and stimulation to the development and implementation. The ideology expresses the Agile Principles [MAN11]: " 1. Customer satisfaction by rapid delivery of useful software 2. Welcome changing requirements, even late in development 3. Working software is delivered frequently (weeks rather than months) 4. Working software is the principal measure of progress 5. Sustainable development, able to maintain a constant pace 6. Close, daily co-operation between business people and developers 7. Face-to-face conversation is the best form of communication (co-location) 8. Projects are built around motivated individuals, who should be trusted 9. Continuous attention to technical excellence and good design 10. Simplicity 11. Self-organizing teams 12. Regular adaptation to changing circumstances”. According to research results [STA10] the most popular agile methodologies is Scrum. This is partly formalized project management methodology, but respecting all Agile Principles. Scrum is a methodology of project realization. It assumes that someone has prepared a project vision and set of software product components before using Scrum. This set is prepared by the Product Owner and formalized in the form of an ordered list called the Product Backlog – fig. 7.1. Product Backlog can be modified (as to the content and order) during the project basing on changing clients requirements and feedback from previous iterations. Software development is carried out in cycles, called sprints. Sprints last from 2-4 weeks and have a fixed structure (fig. 7.2). They consist of repetitive daily cycles-iterations (figure 7.2). During the sprint, the team performs work to provide a working version of the product with new
118
Varia Informatica 2011
functionalities. The functionalities scheduled at the beginning of a sprint, create a Sprint Backlog (fig. 7.2). Implementing particular number of sprints is followed by delivery of the next software release (process: Product Delivery in the fig. 7.1).
Project Vision Feedback
Product Planning
Sprint
Product Delivery
Product Backlog Fig. 7.1. Life cycle of project in Scrum
Fig. 7.2. Sprint structure Source: http://upload.wikimedia.org/wikipedia/commons/5/58/Scrum_process.svg
119
Progress Visualisation and Estimation in Agile Software Project Management
During planning of the number of sprints and creating the Sprint Backlog, techniques based on estimation of software components are used. To define the elements of the product at the level of the Product Backlog, there are used User Stories and Epics (it means big a User Story). Each element of the product is estimated in terms of cost performance. On this basis, the number of sprints can be calculate by the formula:
w
i
s
i
V
(7.1)
where:
s
-
number of sprints,
wi - estimation of the size of each element number i from the Product Backlog,
V
-
average team velocity per sprint.
Team velocity, determines the productivity of the entire team during the sprint. It is estimated under the terms of the implementation of sprint (team size, duration of the sprint, team calendar, ability to perform tasks, work efficiency, etc.) in units of estimating the size of the product elements. Contents of the sprint (i.e. defining of the Sprint Backlog) is determined by a method called the Planning Game. It involves balancing the possibility of realization a work by the team during the sprint with elements of the Product Backlog that have the highest priority. During the game, each element of the product (e.i. User Story) is decomposed into a group of tasks that must be accomplished to provide an element of functionality described in the User Story. The Sprint Backlog is the set of tasks selected for execution in a sprint. After planning, the Sprint Backlog is fixed for particular sprint. It is also independently managed by a team of developers.
7.2.
SOFTWARE PRODUCT ELEMENTS MEASUREMENT
Estimation (and thus measurement) of the size of each software product element in Scrum is used Story Points (SP) or T-Shirt Size.
120
Varia Informatica 2011
Story Points is a relative and functional measurement metric of software product elements. The estimation is expert evaluation. The elements from the Product Backlog are estimated relative to each other using one of the scales:
1, 2, 3, 5, 8, 13, 21, 34, the Fibonacci sequence (without the first element);
1, 2, 4, 8, 16, 32, he sequence of numbers composed of the twice value preceding number.
These scales reflect the fact that smaller units can be more accurately estimated (scale thickens: 1, 2, 3 / 4), and greater can be burdened with the larger errors and the scale is expanding (13, 21, 34, ... or 8, 16, 32,...). The estimation is conducted relatively. After selecting the base element, to other ones points are assigned on the basis of estimation of the size of the element in relation to the base element. The base element may be the smallest element from the Product Backlog (of estimation) or average. Depending on selection rule it is assigned to the lowest or the average value of the measurement scale adopted. Metric analogous to Story Points is Clothes Size, otherwise known as T-Shirt Size. The popular signs used in trade to determine the size of T-shirts are adopted in this metric. These are: XS / S / M / L / XL. This metric is more understandable (this is a perfect metaphor for reality), but it can be regarded as ridiculous, funny, unscientific. Nevertheless, it is increasingly being used.
7.3.
WORK PROGRESS VISUALISATION
For the purposes of the presentation of plans, their progress and prediction of work performing in agile project a variety of tools techniques and tools are used. The most important are:
Self-adhesive yellow cards (sticky notes, Post-Its) containing User Stories and Tasks as well as an array visualizing the course of the project in Scrum;
Burndown Chart for a sprint and for a project (i.e. a software release).
User Stories are short sentences that describe user requirements. They are created according to the scheme: As a I have to to .
Progress Visualisation and Estimation in Agile Software Project Management
121
The word can be replaced with a number of other: can, want, possible, it would be good to. This word shows the business importance of requirements. User Stories are placed on yellow sticky notes. In the same way User Story Cards are created – fig. 7.3.
Fig. 7.3. User Story on the yellow Post-It
On the User Story Cards (USC), after an estimation, the priority and size (in Story Points or T-Shirt Size) are written. Some kind of additional information can be stored on the User Story Card. These are primarily arrangements and commitments regarding the function or the acceptance criteria. Analogously to the USC, on sticky notes there are written tasks which must be done to realize the User Story. Task Cards (TC) are created by decomposition of the User Story, and they form the Sprint Backlog. In addition to belonging to a User Story, the name of the task and the evaluation time of its implementation, they include:
name of the developer
mark the work finising (Done Tag),
indication of the error (Bug Tag).
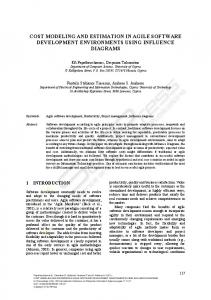
USCs and TCs are later used to plan and visualize the project design on a white table (Project Board) – fig. 7.4. On the Project Board TCs are grouped in the sprints, and
122
Varia Informatica 2011
within the sprint into "Not Started", "In Progress" and "Finished." Moving cards takes place within a short meeting, starting each, daily iteration (fig. 7.2). This meeting is called a scrum. During the meeting tasks can be assigned with different statuses: DONE, BLOCKED, WAITING, PLEASE ANALYZE and DELEGATED. Statuses are marked with special, colour tags. In addition to maintaining the project status on the board, Sprint Burndown Chart (SBC) is updated daily.
Not Started
In Progress
Finished
Team
USCs
TCs
SBC
Fig. 7.4. Scrum visualisation white table Source: http://www.xqa.com.ar/visualmanagement/2009/03/the-done-tag/
Burndown Chart jest kolejna techniką wizualizacji projektu agile. Pokazuje on ile pracy pozostało do wykonania do końca sprintu lub wydania – fig. 7.5. Może byc tworzony dla całego projektu jako Product Burndown Chart lub sprintu – Sprint Burndown Chart. SBC zawiera linię równomiernej pracy (tj. stałej team velocity) – Ideal Tasks Remaning in the fig. 7.5. Actual Task Remaning line wskazuje czy prace sa
123
Progress Visualisation and Estimation in Agile Software Project Management
wykonywane na czas, ale również odwzorowują fakt wzrostu pracy do wykonania. Wzrost ten może być spowodowany reestimation of tasks time realisation lub pojawieniem się nowych zadań. Burndown Chart is another technique for visualizing agile project. It shows how much work remains to complete the sprint or release – fig. 7.5. It can be created for the whole project as Product Burndown Chart (PBC), or for sprint - Sprint Burndown Chart (SBC). SBC has a line of regular work (i.e. constant team velocity) - Ideal Tasks Remaning line in the fig. 7.5. Actual Task Remaining line indicates whether the work is performed on time, but also reflect the fact of the growth of work to do. This increase may be due to re-estimation of tasks time realization, or the definition of new tasks.
Work remaining (hours)
500 400 300 Today 200 100 0 0 1 2 3 4 5 6 7 8 9 10 11 12 13 14 15 16 17 18 19 20 21 Sprint Timeline (working days)
Actual Tasks Remaining
Ideat Tasks Remaining
Fig. 7.5. Sprint Burndown Chart
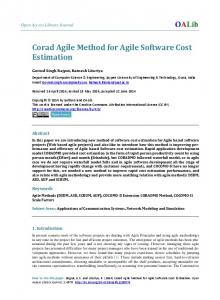
More detailed Burndown Charts are also possible – fig. 7.6
124
Varia Informatica 2011
Fig. 7.6. Detailed Sprint Burndown Chart Source: http://en.wikipedia.org/wiki/File:SampleBurndownChart.png
7.4.
PROGRESS ESTIMATION
Burndown Chart records a real team performance and changes in the volume of work done in the project. Based on these data, by simple extrapolation, for example the number of sprints can be predicted. In the fig. 7.7 after 6 sprints a prediction was made. The intersection Burndown Estimation line with the horizontal axis designates the sprint in which the work runs out. So, if nothing changes in the project, it should have ended on the 8th sprint. Amount of work to be done can increase from sprint to sprint. It is due to the Product Owner, who constantly updates the composition of the Product Backlog, and re-estimation of its elements is made. Fig. 7.8 presents the Burndown Chart with registered changes of the scope and estimation of the project. Line Changes Estimation allows prediction of changes in the project. Its intersection with the Burndown Estimation line determines predicted number of sprints. In fig. 7.8 the project ends on the 9th sprint.
125
Progress Visualisation and Estimation in Agile Software Project Management
140 120 100
Work (USPs)
80 60 40 20 Sprints 0 -20
1
2
3
4
5
6
7
8
9
10
-40 -60 Work Remaining
Burndown Estimation
Fig. 7.7. Sprint number estimation using estimation of team velocity
140 120 100
Work (USPs)
80 60 40 20 Sprints 0 -20
1
2
3
4
5
6
7
8
9
10
-40 -60 Work Remaining
Work Changing
Burndown Estimation
Changes Estimation
Fig. 7.8. Sprint number estimation using estimation of team velocity
126
7.5.
Varia Informatica 2011
CONCLUSIONS
Agile methods of project management prefer realization of projects by small and dynamic teams communicating face to face at work. The effectiveness of face to face communication far surpasses all other methods. This communication in agile project management is supported with simple, but effective methods. These methods visualize easily the status of the project and allow the team work on implementation plans as well as reporting. These methods also allow estimation of parameters of the project.
127
Progress Visualisation and Estimation in Agile Software Project Management
REFERENCES [AGI11]
Agile
Project
Management.
CC
Pace
Systems,
2011
(http://www.ccpace.com/Resources/documents/AgileProjectManagement.p df) [AMB11]
Ambler S. W.,
Best
Practices for Software Development.
2011
http://www.ambysoft.com/essays/agileLifecycle.html [BEC99]
Beck K., Extreme Programming Explained: Embrace Change. AddisonWesley, 1999
[CHA09]
Chaos Summary 2009, Standish Group, Boston, 2009
[COH05]
Cohn M., Agile Estimating and Planning. Prentice Hall PTR, 2005
[DAJ08]
Dajda J., Supporting agile methodologies in distributed setting. PhD dissertation, AGH, Kraków, 2008
[HIG04]
Highsmith J., Agile Project Managment: Creating Innovative Products. Addison-Wesley Professional, 2004
[KRE09]
Krebs J., Agile Portfolio Management. Redmond, Microsoft Press, 2009
[MAN11]
Manifesto for Agile Software Development, 2011, http://agilemanifesto.org/
[MAR08]
Martin R., Martin M., Agile. Programowanie zwinne: zasady, wzorce i praktyki zwinnego wytwarzania oprogramowania w C#. Gliwice, Helion, 2008
[MCC06]
McConnell S., Software Estimation. Microsoft Press, Washington, 2006
[MEY07]
Meyer B., Nawrocki J., Walter B. (Eds.), Balancing Agility and Formalism in Software Engineering. Lecture Notes in Computer Science 5082, Springer, 2007
[PAL02]
Palmer S., Felsing S., A Practical Guide to Feature-Driven Development. Prentice Hall, 2002
[SCH07]
Schwaber K., The Enterprise and Scrum, Microsoft Press, 2007
[SHO08]
Shore J., Warden S., Agile Development. Filozofia programowania zwinnego. Gliwice, Helion, 2008
128
[STA10]
Varia Informatica 2011
State
of
Agile
Survey.
Versionone,
2010
(http://www.versionone.com/pdf/2010_State_of_Agile_Development_Surve y_Results.pdf) [WIE07]
Wiegers K.E., Practical Project Initiation. A Handbook with Tools. Microsoft Press, Washington, 2007