The phytoplankton of the River Lujan (Buenos Aires, Argentina) was studied for a period of 18 months, ... mainly determined by rainfall and underground.
Hydrobiologia 224: 129-154, 1991. 0 1991 Kluwer Academic Publishers. Printed in Belgium.
129
Progressive changes in the structure and dynamics of the phytoplankton community along a pollution gradient in a lowland river - a multivariate approach Paul A. de1 Giorgio, Alicia L. Vinocur,
Ruben J. Lombard0
& Hector G. Tell
Departamento de Ciencias Biokigicas, Facultad de Ciencias Exactas y Naturales, Ciudad Universitaria, 1428 Nufiez, Buenos Aires, Argentina Received 9 January 1990; accepted 20 January 1991
Key words: phytoplankton, analysis
lowland
river, pollution,
water quality, community
structure,
multivariate
Abstract The phytoplankton of the River Lujan (Buenos Aires, Argentina) was studied for a period of 18 months, together with physical and chemical variables, in relation to a pollution gradient. 167 taxa were recorded within a seasonal succession characterized by dominance of diatoms with a brief summer green algae facies. A combination of several biotic indices and multivariate analysis was employed to assess the impact of pollution on the phytoplankton community. The biotic indices used were species diversity and richness, algal quotients (green algae/diatom ratio, Centrales/Pennales ratio) and the SD succession rate index. Multivariate procedures included cluster analysis and ordination by PCA of both species and samples, stepwise discriminant analysis and multiple discriminant analysis of variance (MANOVA). Results indicate that community dynamism is attenuated at the more polluted sites, concomitant with an increased predominance of a broad-tolerance algal assemblage, co-dominated by Cyclotella meneghiniana and Nitzschia stagnorum. The changes in the community structure and dynamics described herein involved alterations in the distribution and relative proportions of the algae, rather than modifications in the basic species composition. These changes may not be readily detectable by methods which over-simplify the ecological information, such as systems of indicator species and biotic indices, designed to assess the degree of pollution. The suitability of multivariate analysis and biotic indices in river phytoplankton studies is further discussed.
Introduction The assessment of the changes in river communities as the result of the impact of pollution is a particularily interesting issue within the framework of aquatic ecology, since running waters are becoming increasingly affected by anthropogenic discharges.
In the early attempts to characterize different degrees of pollution and hence, of community alteration, great emphasis was placed on the identification of indicator species or associations of species (Kolkwitz & Marsson, 1908; Fjerdingstad, 1964; SladeEek, 1973). More recently, multivariate analysis has been proposed as a suitable tool in the study of aquatic communi-
130 ties (Allen & Koonce, 1973 ; Green & Vascotto, 1978). This approach has been taken up by several authors studying river phytoplankton, with the aim of detecting algal associations which may be representative of different environmental conditions or degrees of pollution (Leclerq, 1984; Sabater & Sabater, 1988; Chessman, 1986; Garcia de Emiliani, 198 1). On the other hand, various biotic indices have been proposed to assess water quality, which aim at summarizing large amounts of data into simple expressions. The suitability of these indices has been reviewed by several authors (Couillard & Lefevre, 1985; Guhl, 1987). Both approaches to the study of the impact of pollution on the phytoplankton community have their shortcomings, as Cairns et al. (1972) point out, since they often fail to detect and explain changes in functional and structural characteristics of the community, especially since alterations may not involve profound compositional changes detectable by the various systems of indicator species. In agreement with this standpoint, we have attempted to overcome some of these problems by combining multivariate analysis with the use of several simple biotic indices, in order to assess changes in the phytoplankton community structure and dynamics following the impact of moderate pollution. Thus, this paper describes and analyzes the phytoplankton community structure and seasonal succession in a small lowland river in relation to a gradient of deteriorating water quality.
in its lower reaches; mean discharge is approximately 5.37 m3 s - ‘. Periods of low flow normally occur during the winter (June, July, August) and summer, while high flows occur in spring and autumn. The pattern of water discharge is characterized by large fluctuations over the year with sudden floods due to heavy rainfall and high water level in the Par-an&Rio de la Plata System. Peaks of up to 394 m3 s - ’ have been recorded during these events, which often have devastating effects on the surrounding country side and nearby towns. The region has a temperate subhumid climate with mean summer and winter temperatures of 25 “C and 9.5 “C, respectively. Mean annual rainfall is 950 mm, ranging from 600 mm to 1400 mm in exceptionally wet years. Rainfall is concentrated in spring and autumn. The geological substrata of the river is mainly calcareous. In its upper and mid reaches it flows over flatlands (slope of 0.44 m km - ‘) characterized by Brunizen soils rich in organic matter, with intense agriculture and livestock activity. In its lower reaches it flows over lowlands, and is characterized by a widening floodplain, together with an increased depth and width of its main course, and it is fed by a number of tributaries of increasing discharge. At its confluence with the River Parana, the Lujan is navegable. Urban settlements and industrial activity grow steadily in importance downriver. The River Lujan does not have in the stretch studied any major impoundments or waterworks and a system of locks originally designed to regulate high flows is partially in disuse.
Study area
Materials
The River Lujan is a small lowland watercourse which rises in the North West of the Province of Buenos Aires, Argentina (59’ 37’ W; 34” 43’ S) and finally joins the Delta of the River Parana. Its total length is 128 km and its catchment area is 3300 km2 (Fig. 1). Its hydrological regime is mainly determined by rainfall and underground seepage in the middle and upper reaches, and influenced by the fluctuations in the River Parana
Sampling sites
and methods
Four sampling sites were chosen, covering the upper and mid reaches of the river (Fig. 1). Site 1 is close to the headwaters, and it is mainly affected by agricultural runoff and livestock watering. Sites 2, 3 and 4 are further affected by increasing loads from sewage etlluents and industrial wastewaters, and are located strategically to assess the
131
‘3x_\y
&-,
URUGUAY
34O
34” 30’
10 5 0
10
20
30
LO
50
Km
Fig. 1. Location
ARGENTINA
map of the River Lujan showing the sampling sites (A).
impact of discharges from the main urban and industrial settlements along the reach studied: Site 2 lies right below the first important town along the river (Mercedes, 50000 inhabitants), 7 km downstream from site 1; Site 3 is located within the city of Lujan (80000 inhabitants) and Site 4 lies close to the city of Pilar, an industrial center of importance in the region, 33 and 53 km downstream from Site 1, respectively. The principal wastewaters discharged, apart from untreated or partially treated sewage, are mostly untreated effluents from food industry (dairy and meat processing), textiles, chemical and metalurgic industries in that order of importance. The main course is limited by high bankings except at Site 3, where it expands three-fold in width with the consequent decrease in current speed.
Water analyses Water analysis were made at monthly intervals from January 1986 to July 1987. Temperature,
pH, dissolved oxygen and conductivity were measured in situ with a Luftman P-300 combined electronic meter. Water samples were also taken to the laboratory and analyzed for BOD and total phosphorus following Standard Methods (APHA, 1975). Total nitrogen was determined by performing an alkaline digestion followed by the cadmium reduction method (APHA, 1975).
Phytoplankton samples From January 1988 to July 1987 the four sites were sampled for phytoplankton on a monthly basis. Sampling dates are shown in Table 2. At each site two subsurface samples (150 ml each) were collected from the river banks in PVC flasks and fixed with Lugol’s solution for quantitative analysis. A third sample was collected for taxonomical analysis with a 25 pm pore net and divided into two subsamples: one was fixed in 3 % formalin while the other was left without fixation, in order to observe the live specimens. At the
132 laboratory the phytoplankton werecountedusing an inverted microscope following Utermohl (1958).Subsamplesweretaken from the replicate water samples and placed to sediment in 5 or 10ml chambers,dependingon the phytoplankton density. A number of random fields were assessedfrom eachchamberin order to obtain an error smaller than 20% in the estimation of the density of the more abundant speciesfollowing Sournia(1978).Quantitativeresultsareexpressed as organisms ml - ’ . For unicellular organisms the cell was the counting unit. In the case of colonial or filamentous algae,the counting unit was a pre-establishedsize or number of cells. Numerical and statistical procedures
Various numerical and statisticalprocedureswere applied to the data. Speciesdiversity was calculated following Shannon& Weaver(1949)andthe SD index of community change according to Lewis (1978).Correlation analysesbetweenbiotic and abiotic variables were performed using Spearman’srank correlation procedure. For the multivariate analysis, excessivelyrare species(occurring in less than 4 samples from eachsite)wereremovedfrom the original data set. The inclusion of very rare speciesweakenscorrelations and confounds the total analysis (Austin & Greig-Smith, 1968; Allen & Koonce, 1973). The 87 remaining species are preceededby a numerical codein the floristic list (Table 1). Ordination of samplesand speciesby Principal Component Analysis (PCA) (Orlocci, 1966)was performed with both raw abundanceand log-transformed data of the 87 selected species. Great variations in the common speciesmay mask fluctuations of biological significance in the rarer ones. To avoid this problem, all data were standardized.PCA ordination of samplesbased on abiotic variables was also performed, and physical and chemical data were standardizedto reduce the variables to a common scale (Pielou, 1984). In all ordination and classification analyses using phytoplankton data, a logarithmic transfor-
Table I. List of algal species found in the River Lujan. The taxa selected for multivariate analysis are preceded by a numerical code. CHLOROPHYCEAE 36 Actinastrum hantzschii v. hantzschii Lagerh. Actinastrum hantzschii v. subtile Wolosz. 21 Closteriopsb acicularis (G.M. Smith) Belcher et Swale Closteriopsis longissima (Lemm.) Lemm. Closterium cornu Ehrenb. 3 Coelastrum microporum Nag. Crucigenia tetrapedia (Kirch.) West et West 28 Crucigeniella neglecta (Fott et Ettl) Kom. 23 Crucigeniella rectangularis (Nag.) Kom. Desmatractum bipyramidatum (Chod.) Pasch. Diacanthos belenophorus Korsch. 30 Dictyosphaerium ehrenbergianum Nag. 9 Dictyosphaerium pulchellum Wood 22 Didymocystis bicellularis (Chod.) Kom. 32 Didymocystis inconspicua Korsch. Didymogenes anomala (G.M. Smith) Hindak Didymogenes palatina Schm. 25 Eudorina elegans Ehrenb. I Fusola viridti Snow Golenkinia radiatu (Chod.) Wille Granulocystopsis coronata (Lemm.) Hindak Kirchneriella irregularis (G.M. Smith) Korsch. Kirchneriella obesa (West) Schm. Lagerheimia genevensis (Chod.) Chod. 4 Lagerheimia wrattiaviensis Schroeder Micructinium bornhemiense (Conr.) Korsch. 12 Micractinium pusillium Fresenius 16 Monoruphidium arcuatum (Korsch.) Hind. 5 Monoraphidium contortum (Thur. in Breb.) Kom.-Legn. 24 Monoraphidium griithii (Berkeley) Kom.-Legn. 11 Monoraphidium komarkovae Nyg. 15 Monoraphidium minutum (Nag.) Kom.-Legn. 21 Monoraphidium pusilum (Printz) Kom.-Legn. 20 Nephrochlamys subsolitaria (G.S. West) Korsch. Oocystis lacustrir Chod. 6 Oocystis novae-semliae Wille 33 Pandorina morum Bory Pediastrum boryanum (Turp.) Menegh. 35 Pediastrum duplex Meyen 38 Pediastrum tetrus (Ehren.) Ralfs Polyedropsis spinulosa Schmidle 11 Scenedesmus acuminatus v. acuminatus (Lagerh.) Chod. 8 Scenedesmus acuminatus f maximus Uherkov. 31 Scenedesmus acuminatus f. tortuosus (Skuja) Uherkov. Scenedesmus acutus Meyen Scenedesmus arcuatus v. capitatus G.M. Smith Scenedesmus armatus v. armatus (Chod.) G.M. Smith Scenedesmus armatus v. bicaudatus (Gugliel.-Printz) Chod. 13 Scenedesmus bicaudatus (Hansg.) Chod. Scenedesmus brasiliensis Bohlin
133 Table 1. (Continued).
34 26 31
1 29 19
2
18 10
Scenedesmus caribeanus Kom. Scenedesmus carinatus (Lemm.) Chod. Scenedesmus dispar Breb. Scenedesmus ecornis v. ecornis (Ralfs) Chod. Scenedesmus ecornb v. disciformis Chod. Scenedesmus ellipsoideus Chod. Scenedesmus granulatus W. et G.S. West Scenedesmus intermedius v. intermedius Chod. Scenedesmus intermedius v. acaudatus Hortob. Scenedesmus intermedius v. bicaudatus Hortob. Scenedesmus opoliensb v. opoliensis P. Richt. Scenedesmus opoliensis v. acaudatus Hortob. et Nemeth Scenedesmus ovalternus v. ovalternus Chod. Scenedesmus ovalternus v. graevenitzii (Bernard) Chod. Scenedesmus quadricauda (Turp.) Breb. Scenedesmus spinosus Chod. Schroederia indica Philipose Schroederia nitzschioides (G.S. West) Korsch. Schroederia setigera (Schroeder) Lemm. Schroederia spira1i.s (Printz) Korsch. Tetraedron minimum (A. Braun) Hansg. Tetrastrum glabrum (Roll) Ahl. et Tiff. Tetrastrum elegans Playf. Tetrastrum heteracanthum (Nordst.) Chod. Tetrastrum komarekii Hindak Treubaria triappendiculata Bernard
BACILLARIOPHYCEAE
64 62 55 18 53 43 44 10 41 14 67 68 60 16 69 49 48 46 15 45
Achnanthes infrata (Kutz.) Grunow Amphipleura lindheimeri Grunow Amphiprora alata (Ehr.) Kutz. Amphiprora paludosa Smith Amphora acutiuscula Kutz. Anomoeoneis sphaerophora v. sculpta (Ehr.) 0. Muller Cocconeis placentula v. lineata (Ehr.) Van Heurck Cyclotella meneghiniana Kutz. Cymbella cistula (Hempr.) Kirchner Cymbella muelleri Hustedt Diploneis smithii v. dilatata (Perg.) Terry Diploneis smithii v. pumila (Grunow) Hustedt Epithemia argus v. argus (Ehr.) Kutz. Epithemia argus v. protracta Mayer Eunotia monodon Ehr. Gomphonema par&urn (Kutz) Kutz. Gomphonema subclavatum (Grunow) Grunow Hantzschia amphioxys v. amphioxys (Ehr.) Grunow Hantzschia amphioxys v. minor H. et M. Per. Melosira varianus Agardh Navicula arvensis Hustedt Navicula cuspidata v. cuspidata (Kutz.) Kutz. Navicula cuspidata v. ambigua (Ehr.) Cleve Navicula spp. Nitzschia acicularis (Kutz.) Smith
52 Nitzschia denticula Grunow Nitzschia jiitulum (Kutz.) Grunow 5 1 Nitzschia longirsima v. reversa Grunow 72 Nitzschia sigma (Kutz.) Smith 50 Nitzschia stagnorum (Rabenh.) Grunow 65 Nitzschia tryblionella Hantzsch 54 Nitzschia unbonata Ehr. Nitzschia vermicularts (Kutz) Hantzsch Nitzschia spp. Pinnularia biceps Smith 13 Pinnularia brebissonii (Ku&.) Rabenh. Pinnularia gibba Ehr. 63 Pinnularia viridis (Nitzsch) Ehr. 58 Pleurosira laevis Ehr. 57 Rhopalodia gibba (Ehr.) Muller Rhopalodia gibber&a (Ehr.) Muller Surirella angusta Kutz. II Surirella elegans Ehr. 59 Surirella ovalis Breb. 56 Surirella ovata Kutz. 61 Synedra ulna v. ulna (Nitzsch) Ehr. 66 Synedra ulna v. amphirhynchus (Ehr.) Grunow 11 Thalassiosira weissflogii (Grunow) Fryxell et Hasle EUGLENOPHYCEAE 81 Euglena acus Ehr. Euglena gaumei All. et Lef. Euglena megalithus Skuja 84 Euglena oxyuris Schmarda Lepocinclis caudata Da Cunha 85 Lepocinclis fusfirmis (Carter) Lemm. emend. Conr. Lepocinclis ovum (Ehr.) Lemm. Lepocinclis texta (Duj.) Lemm. emend Conr. Phacus acuminatus Stokes Phacus anomalus Fritsch et Rich Phacus orbiculati Hubn. Phacus pleuronectes (Mull.) Duj. 83 Phacus tortus (Lemm.) Skv. Phacus spp. 80 Strombomonas botystheniensis (Roll) Popova 82 Strombomonas deflandrei (Roll) Defl. 19 Strombomonasfluviatilis (Le.mm.) Defl. Strombomonas gibberosa (Playf.) Defl. Strombomonas maxima (Skv.) Defl. Strombomonas oval& (Playf.) Defl. Strombomonas scabra (Playf) Tell et Conf. 86 Strombomonas verrucosa (Daday) Defl. Trachelomonas abrupta Swir. emend. Defl. Trachelomonas hispida (Perty) Stein emend. Dell Trachelomonas superba Swir. emend. Dell. Trachelomonas volvocinopsis Swir. CYANOPHYCEAE Lyngbya contorta Lemm. 39 Merismopedia minima Beck Merismopedia punctata Meyen
134 Table 1. (Continued). 40 Merismopedia tenuissima Lemm. Microcystis aeruginosa Kutz. 42 Oscillatoria chlorina Kutz. 41 Oscillatoria simplicissima Gom. Spirulina major Kutz.
the 87 selected species, to avoid departures from normality in the data set. All multivariate analyses were performed using the BMDP statistical software (Dixon, 1981).
TRIBOPHYCEAE Centritractus belenophorus Lemm. Centritractus elI@soideus Starmach Goniochloti fallax Fott 87 Goniochloris mutica (A. Brawn) Fott Goniochloris par&a Pascher Isthmochloron sp. Tetraedriella sp. DINOPHYCEAE Gymnodinium
sp.
CHRYSOPHYCEAE Synura sp.
mation was attempted to bring out different aspects of variation in the data matrix by reducing the range of algal abundances (Allen & Koonce, 1973). Aglommerative classification of samples and species was performed on both log-transformed and absolute presence/absence data of the selected species. Several similarity and distance coefftcients were tested and the resulting clusters compared: Manhattan distance, Euclidean distance, Correlation coefficient, Chord distance and Chi-square all yielded basically similar arrangements of the species, although the first four exhibited an excessive degree of chaining. Likewise, the correlation coefficient, Chord distance and Chi-square yielded clusters differing in minor rearrangements in the grouping of a few samples. The classification results reported herein, both for species and samples, are cluster analyses based on a matrix of Chi-square coefficients, suitable when data are frequency counts (Dixon, 1981; Lebart et al., 1979), using a centroid-linkage procedure. Finally, multivariate analysis of variance (MANOVA) and step-wise multiple discriminant analysis of sites were performed, using the log-transformed abundances of
Water quality The waters of the River Lujan are naturally alkaline due to the calcareous sustratum, and pH values ranged from 7 to 8.9 and steadily decreased downriver from Site 1 (Fig. 2a), probably as a result of an increase in decomposition due to heavy organic discharges. Concurrently, dissolved oxygen concentrations decreased downriver (Fig. 2b) and at Site 4 rarely exceeded 6 mg 1- ‘. Moreover, the waters of the river are strongly alluvial, and consistantly, conductivities were high, exceeding 4 900 p S cm - ’ during periods of extremely low flow and exceptionaly dropping to below 500 PS cm - ’ during floods, when the dissolved materials were extremely diluted. There was, nevertheless, a distinct tendency of decrease in the conductivity downriver (Fig. 2c) which may be due to dilution by
Total NitrogenImg
i’l
i-1
;fyyFq
123456789111111111 012345676
01
123456769111111111 012345676 SAMPLES - -.- SITE 1 -SITE 2 ----- SITE 3 .. ---SITE 4
Fig. 2. Characteristics of environmental variables measured for the four sampling sites during 1986-87.
135 affluents. Values, however, remain high, normally exceeding 1500 /JS cm - ’ . In contrast, total phosphorous increased threefold downriver (Fig. 2d), from 200-400 pg l- ’ at Site 1 to 500-700 pg l- ’ at Site 4, whereas total nitrogen increased up to twenty-fold (Fig. 2e), rarely exceeding 10 mg l- ’ at Site 1 while normally above 15 mg 1- ’ at the remaining sites. These high nutrient inputs are mostly related to sewage eflluents and secondarily to industrial discharges, and consistantly, BOD, values increased downriver from Site 1 (range 1-5 mg l- ‘) to Site 4, where the highest values were recorded (range 2-24 mg l- ‘). Water temperatures exceeded 28 “C in summer and dropped to around lo-12 “C during the winter (Fig. 2f). The progressive alteration of water quality is well evidenced in the PCA of samples performed on untransformed values of the six variables mentioned above (Fig. 3). The PCA using logtransformed data yielded essentially the same
ordination of samples. Incomplete data sets were excluded from this analysis and thus only 12 out of 18 samples for each site appear in the PCA. Factor 1 accounted for 41 y0 of the total variance, and nutrient concentration, pH and conductivity weigh heavily on this axis. Samples from Site 1 are displayed farthest on the right of the X axis, with a combination of low nutrient concentrations and high pH and conductivity. In contrast, samples from Site 4 stand farthest on the left of this axis, with higher concentrations of total P and N and lower pH and conductivity. Samples from Sites 2 and 3 are in between, thus cornforming a gradient of increasing eutrophication. Factor 2 accounted for 28% of the total variation, related to dissolved oxygen and temperature, which in turn, are inversely related. Thus, samples with low oxygen concentrations are displayed on the upper part of the Y axis and vice versa. In Site 1, dissolved oxygen concentrations greatly depend on temperature, and samples are scattered along the
Fig. 3. Plot of the 18 samples from each site according to their scores on the first two principal components of the environmental data. Site 1 a; Site 2 0; Site 3 o; Site 4 l . Explanation in text.
136 Y axis following a seasonal pattern, with summer samples on top, winter at the bottom. In contrast, samples from Site 4 are mostly displayed in the upper portion of this axis, coincident with low oxygen concentrations, regardless the season. The lines drawn on the ordination plane show how samples tend to converge to the upper left portion of the plane along the pollution gradient, where there is a combination of high total P and N and low oxygen and pH. Exceptions to this pattern are found in samples taken during floods (shaded areas), when differences are evened out and homogeneously low pH and conductivity values displace Site 1 samples towards the left of the X axis.
Composition and seasonal succession of the phytoplankton A total of 167 algal species and infraspecific taxa were recorded, of which diatoms (27.5%) and green algae (46.1%) comprise the bulk of the taxa found. Other groups are, in decreasing importance, Euglenophyceae (16.2%), Cyanophyceae (4.8 %), Xanthophyceae (4.2 %), Dinophyceae (0.6%) and Chrysophyceae (0.6%). The floristic list is presented in Table 1. Among the diatoms, Cyclotella meneghiniana and Nitzschia stagnorum were alternatively dominant throughout the year. Other centric diatoms of importance were Melosira varians, Pleurosira laevis and Thalassiossira weissflogii. Pennate diatoms were dominated by species of Nitzschia (N. acicularis, N. denticula, N. umbonata, N. longissima var. reversa) and Navicula (N. cuspidata, N. arvensis, N. spp. ). In general terms, the diatoms found are characteristic of eutrophic water bodies, and most are recorded as halophylic preferring alkaline waters (Wolf, 1982), which correspond to the conditions of high pH and conductivity found in the River Lujan. The green algae are dominated by small planktonic Chlorococcales; most of them are cosmopolitan species belonging to the genera Scenedesmus, Monoraphidium, Actinastrum, Dictyosphaerium, Coelastrum, Pediastrum, Crucigenia and Tetrastrum.
In general terms, the pattern of seasonal succession may be described as follows: There is a marked alternance of diatoms and green algae. the latter mostly restricted to the late spring and summer period. In early spring (SeptemberOctober), at the onset of higher temperatures (from 13 ‘C to 18 ‘C) there is an increase in overall phytoplankton density (mainly attributed to diatoms) compared to the low values encountered in winter (less than 1200 organisms ml- i, Fig. 4). As temperature further increases and light conditions improve, diatoms are progressively replaced by green algae, which form an association rich in species and individuals and by late spring this group comprises more than 50% of the total phytoplankton, reaching up to 70% during the summer, when concentrations exceeding 10 000-l 5 000 org. ml - ’ were generally recorded. The proportion of pennate diatoms falls during the summer, while centric diatoms, mainly Cyclotella meneghiniana, increase their relative importance. The end of the summer period is marked by a sharp decline in the overall phytoplankton density and in the proportion of green algae, while the relative contribution of diatoms greatly increases. A second growth period began in fall (April) and sharply declined towards late autumn. The diatoms comprised the bulk of this pulse (up to 90% of the total phytoplankton) dominated by Cyclotella meneghiniana and Melosira varians and secondarily by pennate forms. This autumn pulse was hardly noticeable in 1986 except at Site 1, but was important in 1987 with densities exceeding 4000 org. ml - i. winter was characterized by dominance of pennate diatoms over the rest of the groups (up to 80% of the total phytoplankton), with densities ranging from 400 to 1200 org. ml - ’ with the exception of pronounced growths of Nitzschiu stagnorum in August-September at Sites 3 and 4, where it reached densities exceeding 9000 org. ml - *. Cyanophytes rarely grew to significant concentrations, except for strong but effimeral pulses during periods of extremely low flow in summer, when Merismopedia minima and M. tenuissima attained densities of over 10000 org. ml- ‘. Euglenoids had density maxi
137 ma in springand autumn, exceptionallyexceeding 2000 org. ml- ’ (Phacus sp. in March 1986 at Site 3) but generally with densities below 1OOOorg.ml-‘. Their relative importance increaseddownriver, and at Sites 3 and 4 this group may compriseup to 30y0 of the total phytoplankton. Although the pattern of seasonal succession outlined above in general terms describes the phytoplankton along the stretch of the river studied, important differencesin the total numbers of algaeand the relative contribution of the various groups occur from site to site and any time, probably as a result of particular hydrological conditions at each sampling station coupled with the impact of pollution. Phytoplankton
density
The density of algae recorded ranged from less than 1000org. ml - ’ to more than 10000 org. ml- r during the summer growth period, with a maximum attained during the Summer of 1986of 46000 org. ml- ’ at Site 3 (Fig. 4). Total phytoplankton of summer 1986 exceededthat of the same period in 1987, and significant winter growths were recordedonly at Sites 3 and 4. As a responseto increasingnutrient enrichment,algal TOTAL ALGAL
DENSITY (org. mT’1
Fig. 4. Seasonal fluctuation oftotal phytoplankton in each of the four sampling sites during the study period, 1986-87.
density generally increased from Sites 1 to 3, where the maximum algal concentrations were recorded regardlessthe season. Downriver, at Site 4, algal concentrationstended to decline to valuesonly slightly higherthan those recordedat Site 2. Abrupt declines in algal concentrations were observedduring periods of extremely high flow due to dilution. Unfortunately, there are no reliable data on dischargefor the River Lujan, so it is impossible to further relate cell density with rate of flow. Nevertheless,sincethe river is mainly fed by rainfall, correlations between this variables and cell density were analyzed. Only Site 1 showed a significant correlation (P < 0.01) with averagemonthly rainfall, and then only whentaking into consideration cell density of a given month vs rainfall for the previous month. Thus, the net result of phytoplankton density of a month’s rainfall is evidencedin the algal density of the following month at Site 1. The total phytoplankton of the remaining sites seemedto have little relation with this variable, possibly because downstreamthe rateof flow is more regulatedand lessdependentupon rainfall than in Site 1,which lies close to the headwaters. Sites 1,2 and 4 showedsignificantcorrelations betweenwater temperatureandtotal phytoplankton (Y = 0.56; I = 0.43; r = 0.52, respectively). Site 3 showed a much weaker relationship betweenthesevariables,coincident with vigorous growths of populations in all seasons.Nevertheless,the correlations are sufficiently low as to suggestthat, in the absenceof nutrient limitation, which is most probably the case in the River Lujan, the influence of temperature on phytoplankton densityis subordinateto othervariables, such as discharge and turbidity, to a greateror lesser extent dependingon the site considered. Current velocity is greatly reduced at Site 3, favouringthe multiplication of the algae,and thus this site attains greaterdensitiesas comparedto Site 4, where the highestnutrient concentrations were recorded. Moreover, the fact that Site 1 showedthe strongestrelationshipsbetweenalgal concentrationsand both rainfall and temperature also suggeststhat in the headwatersphytoplank-
138 ton seems to be regulated to a greater extent by external physical factors, whereas downstream it is increasingly influenced by other variables, among which organic pollution may play an important role. In this regard, cell density is highly significantly correlated between Sites 2, 3 and 4 (P < 0.005), while total phytoplankton of unpolluted Site 1 shows very weak relationships with the remaining sites.
Species richness and diversity
Species richness (Fig. 5a) was highest in summer when the green algae were dominant, and substantially decreased in winter, especially during 1986, with a maxima exceeding 70 species per sample at Site 3 in December and January, while the lowest values were recorded at Sites 2 and 3 (lo-11 spp. per sample) in May 1986. Site 4 shows an erratic evolution of species richness along the study period. Similarly, species diversity (Fig. 5b) was highest in spring and summer, with values exceeding 4 bits, and lowest in winter and fall, when values were generally below 2 bits. A distinct but slight decrease in the average value of the index occurred from Site 1 and 2 (3,6) to Sites 3 and 4
SPECIES
RICHNESS
(3,l). While Sites 1, 2 and 4 showed a more restricted seasonal variation of species diversity (coefficients of variation = 20.8 y0 ; 20.1 y0 ; 24.5x, respectively), Site 3 presented the widest range of values (coefficient of variation = 38%). An F test for difference of variance was performed on the diversity data, and significant differences were only found between Site 3 and the rest of the stations (P < 0.025). Here again hydrological conditions prevailing at Site 3 contribute to the differences observed, favouring the richest and most diverse green algae association in spring and summer, but also strong winter pulses of pennate diatoms, specially Nitzschia stagnorum, which account for the low values of the index at this site.
Algal indices
A ratio of green algae density to total diatom abundance (C/D index) was calculated for each site (Table 2) and important spatial and temporal differences in the evolution of this index were observed. Values greater than 1 were recorded in late spring and summer, exceptionally reaching 77.1 at Site 3 and 27.4 at Site 1. Conversely, during the rest of the year the ratio was less than 1,
DIVERSITY
INDEX iHI
01 23466i8 SAMPLES Fig. 5. Seasonal variation
of phytoplankton
species richness (a) and diversity (b) in each of the four sampling sites during the study period, 1986-87.
139 with a minimum at Site 3 of 0.003 in winter. A distinct decrease in the relative contribution of the green algae at Sites 2 and 4 is evident (average C/D = 0.83 and 0.76, respectively) compared to Sites 1 and 3 (average C/D = 2.28 and 5.43, respectively). Nevertheless, this pattern is subject to a marked seasonal variation, in which Sites 1 and 3 attain substantially higher values of the C/D index in late spring and summer as compared to Sites 2 and 4, while the opposite is true for winter and fall. The evolution of the index is closely linked to the seasonal succession outlined above and shows the extent to which the replacement of one groups by the other occurs. Figure 6 shows the relative contribution of both algal groups to the total phytoplankton at each site. It can be seen that Site 1 (Fig. 6a) and especially Site 3 (Fig. 6c) present a marked alternance of green algae and diatoms, in which the former amply dominate the late spring and summer phytoplankton, while their contribution during the rest of the year is insignificant. Conversely, at site 2 (Fig. 6b) and especially at Site 4 (Fig. 6d) diatoms have a comparatively much larger relative importance during ‘spring and summer, while green algae show greater persistance during the rest of the year, sometimes at significant proportions. Thus, Sites 3 and 4 represent the extremes of a pattern of seasonal replacement of the most important algal groups, coincident with marked differences in the coefficients of variation of the C/D index for each site: 330% and 281% for Sites 3 and 1, respectively vs 130% and 138% for Sites 2 and 4. In addition, there is a highly significant correlation (P < 0.01) between the C/D index for all sites, which is strongest between sites 1, 2 and 3 (all Y > 0.8) and weakest for station 4 (Y = 0.68). This result is consistent with what was mentioned above in the sense that seasonal replacement of diatoms by green algae is common to all sites, but alterations in this pattern actually occur. In this regard, Site 2, under a strong impact of pollution, shows a decreased relative contribution of green algae but a greater persistence of the group along the year, and thus, a lesser degree of seasonal variation of the C/D index, compared to Sites 1 and 3, but the overall evolution of the index is
140
i 2 100 3 e s
100
50 0
50 123456789111111111 01 2345678
0
123456789111111111 01 2345678
SAMPLES
q XANTHOPHYTES q CENTRIC DIATOMS Fig.
69 GREEN ALGAE q CYANOPHYTES
H PENNATE DIATOMS •EUGLEN~IDS
6. Percent composition of the phytoplankton, showing occurrence of the six main groups in each of the four sampling sites.
highly correlated between the three sites. Site 4, in addition, shows a poorer fit to the general seasonal pattern of the C/D index, presumably because the seasonal dynamics of the phytoplankton are further influenced by deteriorating water quality. A highly significant correlation (P < 0.001) was found between the C/D index and water temperature for all sites, suggesting that large-scale multiplication of green algae largely depends upon this variable. Site 3 evidences the strongest relationship between water temperature and the C/D index (r = 0.89), coincident with a more pronounced alternance of green algae and diatoms. Conversely, Site 4 shows the weakest relationship (Y = 0.73) coincident with a greater persistence of the green algae along the year. The ratio Centrales/Pennales (C/P index), originally proposed by Nygaard (1949) was calculated, computing not the number of species but the total number of organisms belonging to each one of these groups (Table 2). Results show that there is a pronounced increase in the relative contribution of centric diatoms towards Site 4, where this group predominated over pennate forms almost year-round for 10 out of 18 months of study (Fig. 6d), with an average C/P value of 2.6. Site 3, with an average C/D value of 1.6, showed
a similar trend, but with predominance of centric diatoms somewhat shifted to summer and fall (Fig. 6~). In contrast, Site 1 showed a distinct seasonal pattern of replacement of one group by the other. Centric diatoms clearly dominated during a brief period in late summer and fall, while pennate diatoms predominated during the rest of the year (Fig. 6a). This explains the high coefficient of variation (CV) for the C/P index at Site 1 (CV = 150x), whereas for Site 3 and 4 the values of the index are more evenly distributed along the year and thus the coefficients of variation are much lower (CV = 118% and 93 %, respectively). Site 2 shows a sharp decline in the relative contribution of centric diatoms (average C/P = 0,72), with a similar seasonal pattern to that of Site 1 (Fig. 6b) but with a reduced range of variation (CV = 112 %). The C/P index did not show significant correlations with water temperatures in any of the sites. In an attempt to study possible relationships between the biotic variables we analyzed correlations between the C/D and C/P indices vx species diversity and phytoplankton density. Species diversity was significantly correlated (P < 0.05) with the C/D index at Sites 2, 3 and 4, an expected result since the maximum species diversity values are normally attained with the
141 summer Chlorococcales pulse. In contrast, species diversity showed a strong negative correlation (Y = - 0.64) with the C/P index at Site 1 and a very weak relationship with the C/D index, suggesting that, although this site also sustains a rich and diverse chlorophycean summer flora, its effect on species diversity is subordinate to parallel growths of centric diatoms, which give way to an assemblage of pennate diatoms which seems to positively influence species diversity at this site. This result is consistent with a positive correlation (P < 0.05) between the C/P index and cell density at Site 1, which implies that high algal abundance is related to substantial growth of centric diatoms, which is itself closely related to the summer growth period at this site. Pennate diatoms, while contributing less to high density, when dominant positively affect species diversity, so it can be concluded that Site 1 supports an association of pennate diatoms which is richer and more evenly distributed than at sites downriver, where there was evidence that an increase in the relative contribution of diatoms, either centric or pennate, depressed the species diversity index. Moreover, cell density was significantly correlated with both the C/D index (P < 0.05) and the C/P index (P -=z0.01) at Site 4. As was mentioned above, centric diatoms play an increasingly important role in the phytoplankton of this site. On the other hand, although the relative contribution of green algae falls during spring and summer compared to upstream stations, there was also evidence that the situation reverted during the rest of the year, so that the contribution of this group is not limited only to a brief period of large-scale multiplication in summer. Site 3 showed only a very weak relationship between total phytoplankton and the C/P index and in this respect is seems to follow basically the same pattern described for Site 1, whereas for Site 2 there was a weak relationship between cell density and the CID index. Succession rate (SD index) The SD index of community change, first proposed by Lewis (1978), was calculated for each
SITE1
7
>r
4
0.16
w z E
0.10 0.05 0.00
$
0.16
w
0.10
g 3 m
0.05 0.00
I
SITE3
SITE 4
016
1 2 3 4 5 6 28 ~l_olj1~~1~1~l~l~ 2 3 4 5 6 7 89 101112131415161716
SAMPLES Fig. 7. Patterns of succession rates for each sampling site, as measured by the summed difference rate index (SD index) between consecutive samples (based on total phytoplankton density).
site, and the relationship between the index and the community variables mentioned above was studied. Since the SD index is related to community change in time, it seemed appropriate to perform correlations using the absolute rate of change over time for all the remaining variables. Figure 7 shows the evolution of the SD index along the study period for each site. The general pattern indicates a sharp increase in the rate of change in spring, concurrent with water temperature exceeding 16 “C which reaches a maximum and then stabilizes during the summer, at temperature above 25 “C when the green algae association reaches its full expression. A secondary peak, occurring when temperature falls below 18 “C, in April-May marks the transition to the
142 late summer-fall association. Additional peaks exceeding 0.1 day- ’ signal the transition to the winter phytoplankton associations, dominated by pennate forms, when temperature falls below 15 “C. The results of the correlation analysis show that the SD index is significantly correlated with rainfall (Y = 0.59) and temperature (Y = 0.41) only at Site 1, suggesting that external physical factors have a more important role in the regulation of the phytoplankton populations in the unpolluted headwaters than further downstream. Since the succession rate is influenced by changes in both composition and abundance, correlations between the SD index and [bdensity/&] were analyzed, and found significative only at Site 1 (Y = 0.63), and not downstream. This result confirms that density variations are closely related to compositional changes at Site 1, where each density maxima is characterized by a distinct algal
association. Downstream, and especially at Site 4, density maxima are related to essentially the same diatom association which predominates all along, except for a very brief chlorophycean summer assemblage, and the seasonal pattern is expressed more as an alternance of dominance within that same association rather than in a marked compositional change. The most striking fact in the evolution of the SD index is the narrow range of values it takes at Site 4 and especially at Site 2, compared to Sites 1 and 3 (Fig. 7). An F test showed significant differences of variance (P < 0.025) between Site 2 and the remaining sites. Moreover, the SD index is highly correlated between Sites 1, 2 and 3 (P < O.Ol), while the relationships with Site 4 are extremely weak. Therefore, the impact of pollution on phytoplankton dynamics seems to differ from Sites 2 to 4. In the former the seasonal succession is depressed but it nevertheless retains the
011 011 oll
015 016 ml5 l l6 rn~ 015
n2 017
09 017
ml1
016 "Df
03
014 012 012
03
c2 01
ml 01 t
09 06 010 06 04 010
07
02 02
l g -OS-
3
ml2 ml4
.13 014
07
312 013
l 1 013
04’ Ul
‘lo97 06.6 0s n6 ~6
m5
l S 04 05 05
U
Fig. 8a.
ot
143
ml8
n9 ml6 C' 13
n8
ml2 ml4 012
n6
010
04 05
q lo e
014
n2
011
%l
013 012 012 014
-
ol
02
02
-
01
03 02
011 014
l 3 09
03
Fig. 8. Principal component analysis (PCA) of samples based on the log-transformed abundance of phytoplankton. Plot of the 18 samples from each site according to their scores on: (a) factors 1 and 2; (b) factors 1 and 3. Site 1 n ; Site 2 0; Site 3 o; Site 4 0.
basic pattern found at Site 1. Site 4, in addition, shows a clear departure from the seasonal evolution of the SD index at the less polluted sites.
Multivariate
analysis. Ordination of samples
Differences between sites in terms of phytoplankton community structure along the 18 months study period were further assessed by means of multivariate analysis. The ordination of raw density data (not shown here) was unsatisfactory since it resulted in a dense central cluster of samples within the plane defined by the first two factors. In contrast, PCA of samples using logtransformed data yielded a more comprehensive ordination of samples along the first two axis (Fig. 8a). Factor 1, which accounted for 24% of
the total variance, is clearly a seasonal axis, where summer and spring samples are arranged on the right of the X axis and winter and fall samples occupy the central-left portion. Factor 2 explains 7% of the total variance and represents changes in the community structure in all sites that occurred from one seasonal cycle to the next. Samples taken during the first year are predominantly located at the bottom of the Y axis, whereas those corresponding to 1987 are on the upper portion of this axis. Thus, the two main axes account for cyclic and non-cyclic changes determined by climatic and hydrological variables which affected the whole stretch studied but do not discriminate between samples from different sites. Nevertheless, several samples from Site 4 appear to be misplaced within the general pattern of seasonal distribution, consistent with dis-
144 ruptions in phytoplankton dynamics at this site. The third factor accounts for 6% of the total variance and it is most likely a pollution gradient axis. Consistently, all the samples from Site 1 and some summer samples from Site 3 occur in the upper part of the Z axis, while the remaining samples are arranged at the bottom of this axis. Thus, ordination defined by factors 1 and 3 (Fig. 8b) arranges the samples according to a seasonal pattern and a pollution gradient, in agreement with results shown previously in terms of differences in community structure and dynamics between Site 1 and the downstream sites which suffer from the impact of pollution.
Class@ation
of samples
The results of the hierarchical classification of samples based on log-transformed abundance data are shown in Fig. 9. Two distinct groups of samples appear to exist, marked A and B, and each of them is subsequently divided into smaller clusters marked in numbers. Group A comprises all late spring and summer samples, and these are subsequently divided into those belonging to 1986 (group Al) and 1987 (group A2). Conversely, group B clusters autumn and winter samples, with group B3 comprising winter samples of 1987, group B4 mainly autumn samples of 1987 and group B5 autumn and winter samples taken in 1986. These results are in agreement with the ordination of samples, since both procedures highlight the seasonal variation in the first place, and secondly they reflect changes in the community that occurred from one year to the next. In this regard, the cluster analysis provides a graphical expression of the seasonal variations and departures from this pattern previously assessed with community variables. The extent of the changes that occur within the community during spring and summer is reflected in the wide separation between summer and winter samples. The almost direct transition from late summer to winter phytoplankton in 1986 is evidenced in the absence of a distinct autumn group of samples for
this year as opposed to 1987. Moreover, the erratic seasonal pattern found at Site 4 is also evident in the cluster analysis, since early spring and winter samples from this site appear in the midst of the summer cluster A2, while summer samples appear in winter group B5. Spatial patterns are subtler and are thus swamped by temporal change, either periodical or aperiodical in both the PCA and the classification of samples. Nevertheless, samples from Site 1 tend to aggregate forming distinct subgroups representing winter and early spring, when the phytoplankton at this site remains fairly constant and distinct from the rest of the sites. This suggests that spatial differences along the pollution gradient are more evident in the winter diatom association than in the summer green algae assemblage, which seems to be more homogeneous between sites. In addition, a close scrutiny of the dendrogram reveals that the samples from Site 4, although never conforming any single cluster, are distributed mostly in small groups of two of three samples among the different groups, regardless the season. In order to further investigate this pattern we used the correlation matrix of samples on which the PCA is based, to find all the pairs of samples with correlation coefficients higher than a fixed value, arbitrarily set at 0.8. Out of the total number of pairs extracted, most reflect relationships between samples of different sites, while there were also pairs of samples with high correlation coefficients belonging to the same site taken at different times of the year. Out of the total number of pairs extracted involving samples from Site 1, we calculated the percentage corresponding to pairs in which both samples belonged to this site. We repeated the operation for the remaining stations and found that the percentage steadily increased from Sites 1 to 4 (7.2% ; 7.3 y0 ; 14.2% ; 20.4x, respectively). A strong relationship between samples taken at different times from the same site is only possible when at least a fraction of the algal community remains unchanged. Thus, the persistence of algal associations beyond the seasonal change in the community allows samples from the same site to be
18 17
g 10 iz' 9 08 7 6 5 4 3 . . . ..000.00.000..000...~~~~~~~~~.~~.......~~..~...~~...~~...~~...~~.~~~. 6894576~~5576987876~~~~~911141~111111il411111111651111911112233322113111 650 5 76667665
1
10444333
1114
2222
3
Fig. 9. Dendrogram produced by the cluster analysis of samples based on the log-transformed abundance data of phytoplankton. Cluster-groups of samples are marked with a code and explained in the text. Site 1 n ; Site 2 0; Site 3 o; Site 4 l .
strongly correlated, and this trend increases downriver from Site 1. The classification of samples using absolute presence/absence data (not shown here), which emphazises composition and persistence of the species at each site yielded a cluster which also reflects seasonal variations, with summer and late spring samples well separated from the rest. Nevertheless, spatial differences are more evident than in the quantitative analysis, and fall-winter samples from each site aggregate to form distinct clusters, while summer samples seem more homogeneous among sites. Therefore, when considering both quantitative and qualitative aspects of the phytoplankton community, the winter and fall associations, mainly comprised by diatoms and secondarily by some green algae and euglenoids, seems more sensitive to changes in water quality than the summer green algae association.
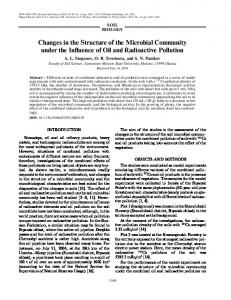
Ordination of species The ordination of the 87 selected species using raw density data (not shown here) met with failure as did the ordination of samples, resulting in dense aggregation in the center of the plane defined by the first two factors. The PCA of species using log-transformed data yielded an ordination which exhibits a ‘horseshoe’ effect, related to the existence of a gradient within the data (Leclercq, 1984; Pielou, 1984) (Fig. 10). Factor 1 accounted for 38 y0 of the total variance and reflects bulk of abundance combined with persistence in the community. Thus, Cyclotella meneghiniana and Nitzschia stagnorum, which are present year-round with a large share of the total phytoplankton, occur farthest from the central cluster on the X axis, while other broad-tolerance species occupy the remaining right portion of this axis. Conversely, species with a more restricted seasonal distribution and lower average densities occur on the left of the X axis. Factor 2 accounts for 15 % of the total variation, and reflects seasonality, with summer species on the top of the
146 h
II
B --__----0 61
u Fig. 10. Ordination ofthe 87 selectedspeciesby principal component analysis.The numbers refer to the list of speciesin Table 1.
Explanation of the groups of species,marked with letters, in the text.
Y axis, winter specieson the bottom. Thus, this axis further arrangesthe broad-tolerancespecies with high densitiesinto Chlorococcales(groupA) with optima in summer; diatoms, (group B) with optima in winter and early spring and a mixed groupof greenalgaeand diatoms (group C) which predominate in late summer and fall. Likewise, typically summer species, mainly green algae, occur on the top left of the plane (group D), well separated from species restricted to winter, mainly diatoms (group F) and in the center of transition group comprised by diatoms, green algae and euglenoids(group E). Thus, the ordination is successfulin depicting seasonalitywhile evidencingan increasingrole of the speciesin the community, in terms of persistence and abundance.
Clas$cation
of species
The classificationof the 87 selectedspeciesusing log-transformed density data is in agreement with the results of the ordination and provide further insight into the temporal and spatial distribution of the algaeand their role in the phytoplankton community. The cluster analysis (Fig. 11) showstwo main groups,marked A and B, which are subsequentlydivided into smaller clusters, marked with numbers. Group A comprises most green algaeand a few cyanophytes. Within this group, specieswith the highest densities from cluster Al, dominated by Monoraphidium contortum, M. minutum, M. arcuatum, M. komarkovae, Scenedesmus quadricauda and Didymocystis bicellularis. Many of these species
are also among the most persistentgreenalgae. Group A2 comprises specieswith high density but shorter duration in the community, such as
147 Thorakochloris weissflogii and Didymocystis inconspicua. Group A3 comprisesmedium to flow density, low-persistencespecies,such as Goniochloris mutica, Monoraphidium griifjlthii and Actinastrum hantzchii. Group A4 also clusters low density,
narrow-tolerancespecies,but mostly restrictedto Site 1, such as Dictyosphaerium eherenbergianum, Micractinium pussillum and Lagerheimia wratislaviensis.
Group B comprises all diatoms, euglenoids and the remaining cyanophytesand greenalgae. Cluster B 1groups speciesof medium to high density and a somewhat irregular seasonaldistribution, with a strongpreferencefor autumn. It is the only trully mixed association, composed by species such as Phacus tortus, Euglena acus, Melosira varians, Nitzschia acicularis, Pandorina morum, Scenedesmus acuminatus and Oscillatoria chlorina. Persistentdiatoms (presentmorethan 16
months out of 18) with high density are grouped in B2, with preferencefor fall, wint& and early spring and dominated by species such as Cyclotella meneghiniana, Nitzschia stagnorum, N. denticula, N. sigma, N. umbonata and Gomphonema parvulum. Most of these specieswere
present almost continously during the study,
especiallyat downstreamsites.Group B3 clusters medium-tolerancewinter specieswith low density, suchasEpithemia argus, Diploneis smithii var. pumilla, Surirella
Navicula arvensis, Cymbella cistula, elegans and Strombomonas jluviatilis.
Some speciesin this group show a strongpreferencefor Site 2. Finally, group B4 also comprises low density and medium-tolerancespecies,but mostly restricted to Site 1, such as Rhopalodia gibba, Surirella ovata, Nitzschia tryblionella and Scenedesmus acuminatus var. tortuosus.
Both the ordination and classification of species using log-transformed data accentuate bulk of density and alsospeciestolerancein terms of persistencein the community, with an emphasis on when they occur in greatestabundance.In addition, the cluster analysisprovidesevidenceof spatial changes along the pollution gradient. Nevertheless,the most striking feature in the classification is that it follows roughly the major taxonomic divisions, and the green algae and diatoms appear as distinct units. This suggests that their modes of seasonal distribution and growth are substantially different and complementary. Consistently, for the four functional clustersdescribedwithin the green algae,groups
Fig. 11. Dendrogram produced by the cluster analysis of the 87 selected species based on log-transformed abundance data. Cluster groups of species, marked in the dendrogram with a code, are explained in the text. Numbers refer to species list in Table 1.
148 of similar functional characteristics are found within the diatom cluster. Thus, it is possible to recognize in each of the two main units (A and B): 1) a cluster of broad-tolerance species which contribute most to the density (Al and B2), 2) a cluster of medium density species which display less persistence in the community (A2 and Bl), 3) a narrow-tolerance, low density species group (A3 and B3) and yet another, 4) clustering medium to low-tolerance species more restricted to Site 1 (A4 and B4). Furthermore, the relative contribution of the species grouped under the first item (groups Al and B2), steadily increases downriver. Significantly, these species also comprise groups A and B of the PCA analysis, which occur on the far right of the X axis. In contrast, species with preference or restricted to Site 1 are mostly located on the opposite side of the plane defined by the first two factors. Although none of the first two factors is a pollution gradient axis in itself, the combination of both displays algae as a continuum from broad-tolerance to narrow-tolerance species, and the extremes of the ‘horseshoe’ are occupied by algae which play an increasingly important role in the most polluted sites, in terms of density and persistence in the community. The increasing predominance of an association comprised by broad-tolerance algae in downstream sites is evident in the cluster analysis for individual sites (not shown here), in which spatial variations are excluded. For Site 1 no such association is evident, with the species displayed among the different groups according to their seasonal distribution, Cyclotella rneneghiniana forming part of the summer green algae cluster, while Nitzschia stagnorum aggregates in a winter diatom cluster. In contrast, for downstream sites, the individual clusters show the progressive consolidation of this association, increasingly separated from the remaining groups and codominated by Cyclotella meneghiniana and Nitzschia stagnorum, followed by Melosira varians, Nitzschia umbonata, N. denticula, N. acicularis, Synedra ulna
and Gomphonema parvulum among the diatoms and Monoraphidium contortum, M. minutum, M. pussillum, M. komarkovae,
Scenedesmus inter-
Table 3. Multivariate analysis of variance and multiple comparisons between sites for variables in the discriminant function. Wilk’s Lambda = 0.0182 (degrees of freedom = 14, 3, 68) Approximate F = 11.16 (degrees of freedom = 42, 164) F-Values computed for Mahalanobis D* (Deg. freed. = 14.55)
Site 2 Site 3 Site 4
Site 1 17.82 18.16 21.28
Site 2
Site 3
7.75 8.83
5.02
medius, SC. bicaudatus, Oocystis nova-semline and Didymocystis bicellularis within the green algae.
The classification of species using presence/ absence data (not shown here), which emphazises number of months present at each site, added little information to the quantitative analysis. Nevertheless, it confirmed the basic pattern described above, with diatoms and green algae appearing as distinct groups.
Sites discrimination
The stepwise discriminant analysis of samples yielded a classification function for the 4 stations involving only 14 species selected for having F to enter values greater than the critical (P = 0.05) one. A multivariate analysis of variance for species included in the discriminant function and comparisons for each pair of sites by Mahalamobis D2 showed highly significant differences between the four stations, substantially higher between Site 1 and the remaining sites (Table 3). The discriminant function obtained (Table 4) correctly classifies 94.4%, 94.4%, 100% and 83% of samples from Sites 1, 2, 3 and 4, respectively and the species involved are either restricted to the upper reaches (Scenedesmus acuminatus var. tortuosus, Surirella elegans) or thrive in the more polluted sites (Goniochloris mutica, Oscillatoria chlorina). It is significant that out of the total number of species only such a small number were selected for the discriminant function. The remaining species showed in fact, much smaller values of F values than the F to enter, and this
149 Table4. Discriminant function coefficients for the 14 selected species. The percentage separation associated with each function is also shown. Variable
Coefficients function: 1(65x)
for discriminant
II (88%)
III (100%)
0.40 2.06
- 0.85 0.81
0.08 0.26
Monoraphidium komarkovae Monoraphidium minutum Scenedesmus intermedius var. bicaudatus
0.27 0.30 0.37
- 0.25 0.51 1.12
- 1.37 0.55 - 0.30
Scenedesmus acuminatus var. tortuosus
2.81
- 0.16
- 0.40
- 0.82 0.61 - 0.64 1.66 - 0.52 0.48 - 0.95 - 1.11
1.10 - 0.20 1.88 - 1.31 - 0.05 - 2.79 0.29 - 0.67
- 0.20 - 0.20 - 0.80 0.96 - 1.15 0.02 0.57 0.08
Scenedesmus Scenedesmus f. maximus
quadricauda acuminatus
Oscillatoria chlorina Nitzschia denticula Rhopalodia gibba Nitzschia tryblioneila Epithemia argus Surirella elegans Strombomonas verrucosa Goniochloris mutica
result suggests that only a very small proportion of the species are restricted to any site in particular, while the vast majority are common to all the sites, yet with differences in their density and seasonal distribution in the 4 stations. Discussion The methodology we employed allowed us to break down aggregate ecological change into three categories : 1) seasonal changes, related mainly to temperature and light conditions; 2) non-seasonal changes, related to climatic fluctuations which mainly affect the pattern of discharge and 3) spatial changes, related to particular hydrological factors at each site coupled with increasing water pollution. Seasonal changes
The general pattern of periodic change observed in the River Lujan is consistent with reports from studies of other rivers. Most of the species involved are cosmopolitan, typical of eutrophic
rivers, and of particular interest is the widespread existence of centric diatoms as a major feature of the phytoplankton of temperate rivers (Swale, 1969). Cyclotella meneghiniana was in our studies the predominating centric diatom, but Stephanodiscus spp. have been reported by several authors to occupy a similar role in other lotic communities (Kiss, 1984; Swale, op. cit.). In contrast, we have found no records in the literature of Nitzschiu stugnorum, predominant in our samples, as a dominant species in other lotic communities. Similar seasonal progressions involving basically year-round predominance of diatoms with a brief green algae facies have often been reported for European rivers (Descy, 1987; Kiss, 1984; Simm, 1985 ; Swale, 1969), North American rivers (Williams, 1964; Weber & Moore, 1967; Hammer, 1983), Asian rivers (Rai, 1974; Wu, 1986) and Australian rivers (Chessman, 1985). There are of course, differences relative to other river systems as to the timing of the growth season, the extent of the phytoplankton development and the relative contribution of the different algal groups, depending mostly on hydrological and climatic conditions. Large-scale multiplication of cyanophytes was infrequent and of short duration as compared with reports of other authors in studies of polluted rivers (Lakshminarayana, 1965). Swale (1969) comments in this regard that the absence of blooms of cyanophytes in English rivers may be due to the lack of still backwaters where these algae may thrive. This may be the case, but the large-scale multiplication of blue green algae has more often been related to eutrophication and organic pollution (Hammer, 1983) and more specifically, to increased phosphorous inputs relative to nitrogen that could drive the phytoplankton from a state of P limitation to one of N limitation (Nalewajko & Lean, 1980). This is not the case for the River Lujan, since P inputs have been shown to increase downriver four-fold at the most, while N concentrations may increase up to twenty-fold. Therefore, although the River Lujan does receive considerable organic inputs, the P/N ratio may not favour the development of cyanophycean blooms.
150 Phytoplankton densitiesrecordedfor the River Lujan, with an upper limit of 46000 org. l- ‘, lies within the middle of the range reported for eutrophic lowland rivers (Descy, 1987; Kiss, 1984), with highest densities occurring mostly during late spring and summer,when the climatic conditions aremore favourable(Amblard, 1987). Non-seasonal changes
The seasonalprogressionwas in general terms similar in both years but multivariate analysis revealeddifferencesin terms of community structure between samples from the two periods. Detailed information on the rate of flow is not available,but thereis evidencethat dischargewas greater in 1987,concurrent with higher rainfall and extense regional flooding, which characterized the period. Considering the profound effectsof high rate of flow and flooding on stream phytoplankton (Fischer, 1983), the differences observedaremost probablyrelatedto a changein the pattern of discharge,especially since water quality seemedto remain practically unchanged. Higher rates of flow are consistent with lower densitiesand more homogeneousdistribution of phytoplankton among the sites studied, as observedduring 1987.Moreover, the densemats of tilamentous algae, mainly Spirogyra sp. and Cladophora sp. which occurredin all sites during summer and autumn of 1986 were practically absent in 1987,providing further evidenceof a shift in the discharge pattern, since large-scale growth of attached algae, in the absence of nutrient limitation, is mainly regulated by frequency of flooding (Biggs, 1985). Multivariate analysiswas useful1in detectingchangesin community structurefollowing the changesmentioned above, mainly comprising diatoms such as Synedra ulna, Pinnularia viridis, Surirella elegans, Thalasiossira weissflogii, Navicula cuspidata and Melosira varians, which were all presentin 1986
but attained substantially higher densities and were more persistent in the community during 1987.All thesediatoms are characterizedby their largesize, suggestingthat higherrates of flow and
increasedturbulencemay favour the development of larger diatom forms. Spatial patterns
Spatial patternsin the responseof phytoplankton to moderate environmental alterations are often masked by strong seasonal fluctuations and structural instability which characterizelotic systems (Reynolds, 1984).Moreover, the impact of pollution on the community has to be further assessedin relation to the prevailing hydrological andmorphometricconditions at eachsite.Results show a marked increaseof phytoplankton abundancefrom unpolluted Site 1 to Site 2 wherehigh levelsof nutrients suppliedby natural runoff have been supplementedby domestic and industrial effluents. From there on, and in the absenceof nutrient limitation, the factors controlling algal abundance are, besides temperature and light, dischargeand water quality. Accordingly, maximum densitieswere recordedat Site 3, regardless the season.At this site the river expandsits main coursefour-fold to around 43 m and the current velocity decreasesfrom a mean of 0.41 m s- ’ to less than 0.1 m s- ‘. The waters of the River Lujan are strongly alluvial and at this point the sestonsettlesout of the slowly flowing water and the photoclimate becomes more favourable for algal multiplication (Kiss-Keve, 1974; Talling, 1976).Downriver the main courseagainnarrows and at Site 4 mean current speed increasesto approximately 0.45m s- ‘. Consistently, phytoplankton abundancedecreases,althoughnutrient levels are highest at this point. Consideringthe dense industrial settlements in this area, the increaseof toxic releasessuch as heavy metals may further impair algal multiplication (Descy, 1987; Cot& 1981). The diatom quotient showed that the relative contribution of the centric diatoms steadily increaseswith increasingpollution, regardlessthe season,consistent with reports of other authors (Wu, 1986; Rawson, 1956; Sabater & Sabater, 1988),and in all cases,abundanceof centralesis considered as evidence of increasing eutrophi-
151 cation. Moreover, the C/D quotient showed that if the green algae are more important in the community during the summer period at Site 1, this group is more persistent along the year at the more polluted sites. Furthermore, we have found that the pattern of seasonal replacement differs greatly between sites, and for both the C/D and the C/P indices the range of variation, and thus, the extent of group replacement, is attenuated with increasing pollution. This trend was not evident at Site 3, where it was shown that green algae practically displaced the diatoms during the Summer, and that the coefficients of variation for both indices were highest. This result could lead to the erroneous conclusion that Site 3 undergoes a certain degree of recuperation and thus resembles the seasonal pattern found in unpolluted Site 1, which is certainly not the case, because there are substantial differences in terms of community structure between the two sites. Consistently, the PCA analysis has shown that only a few summer samples from Site 3 are arranged close to samples from Site 1, whereas the remaining are clustered with samples belonging to polluted Sites 2 and 4. Thus, the effect of pollution on the phytoplankton community is better understood when Site 1 is compared to Sites 2 and 4, which share basically the same hydrological conditions. The attenuation of the seasonal change as the result of the impact of pollution is also evident in the evolution of the SD index. As Reynolds (1984) points out, weekly sampling frequency should optimize the results of the index, since large fluctuations in the phytoplankton may occur in a matter of days, but our results show that monthly data were appropriate to describe the general trend of the changes in the community. At Sites 4 and especially 2, the range of variation of the index is markedly depressed relative to Site 1. Reynolds (op. cit.) provides a reasonable explanation for this phenomenum when he states ‘. . . that the weaker is the tendency for the existing dominant to be replaced by another, then the less is the perceivable change in the community and the less will be the instantaneous value of the SD index’. In other words, when the primitive association continues to influence both the composition and
the abundance of the incoming association, the index will not reveal profound changes in the community. This is contrary to the opinion of Wetzel(l975) that for perturbed communities it is reasonable to expect higher succession rates and swifter changes in the species composition. In this regard, Lewis (1978) found a significant correlation between the SD index and the absolute rate of change in autotroph abundance which he considers resonable if the latter is an index of change in the environmental conditions. Such relationship was only found in Site 1, suggesting that in downstream sites variations in density are not necessarily related to changes in the composition of the community. In addition to attenuated dynamism, Site 4 shows a poor fit to the general pattern of the community change found in upstream sites, as was also noted for other community variables. This would, in fact, represent a more advanced stage of alteration of the community due to pollution. In this regard, Willen & Willen (1979) have also reported disparate seasonal developments of phytoplankton in two sites of the same lake subject to different pollution loads. Our results indicate that the regulation of phytoplankton populations by external physical factors is increasingly subordinate to water quality in the more polluted sites. River phytoplankton succession has been shown to be predominantly allergenic, depending mostly on temperature, light, discharge and turbidity (Reynolds, 1984; Margalef, 1983). Smayda (1980) groups under the term ‘water quality’ autogenic factors which are nevertheless influenced by the discharge of anthropogenic substances, which may be potentially significant in species composition. It thus seems that phytoplankton succession turns increasingly autogenic with increasing pollution . The attenuation of the dynamism along a pollution gradient was not found to be directly related to changes in the species composition itself. Discriminant analysis revealed that only a few taxa were either restricted to unpolluted Site 1 or to the more polluted sites, whereas the majority of the species were common to all the sites, yet differing
152 in their mode of distribution and density maxima. The alterations in the phytoplankton community are only partially reflected in a slight decrease in species diversity at the more polluted stations. It is widely accepted that species diversity and richness decrease in aquatic communities under stress (Margalef, 1983; Odum, 1971; Wetzel, 1975) and this biotic index has often been used as a criterium of water quality (Margalef, 1969). This may be applicable to cases of more severe pollution, but in our studies the species diversity index did not reflect the extent of the alterations in the phytoplankton structure and dynamics and we thus subscribe to the point of view of Green & Vascotto (1978) that it should be used to complement other information since the relation between high diversity and high environmental quality is not always valid.
Conclusions The phytoplankton composition and seasonal succession described for the River Lujan, with predominance of diatoms with a summer green algae facies is in agreement with reports from other lowland rivers of temperate regions. The impact of pollution in the stretch studied did not result in the replacement of one algal association by another. Rather, the effect was to alter the distribution and relative proportions of the algae yet retaining the basic species composition. Our results indicate that broad-tolerance species (groups Al and B2, Fig. 11) attain a more preponderant role in the community with increasing pollution in terms of persistence and density, regardless the season, in agreement with Allen & Koonce (1973) that eutrophic systems are defined by broad-tolerance species at the expence of the opportunistic ones. All the measures of phytoplankton community dynamism are attenuated with increasing pollution, and this effect may be considered a preliminary stage of community alteration, but it must be carefully assessed in relation to the prevailing hydrological conditions in order to avoid misleading conclusions.
The evolution of the biotic indices employed, rather than their absolute values, has been of importance in the assessment of the departures from the basic seasonal pattern in the polluted sites. In addition, multivariate analysis has been an extremely useful1 tool to discriminate between cyclic, non-cyclic and spatial changes in the community, and thus the application of both classification and ordination to samples distributed in time and space has proven to be effective (Green & Vascotto, 1978). In the study of the impact of discharges on stream communities, the emphasis has generally been placed on the identification of indicator species (Kolkwitz & Marsson, 1908; SladeEek, 1973) or algal associations (Fjerdingstad, 1964) that characterize different degrees of pollution. However, when the deterioration of water quality is progressive, complex structural alterations preceed substantial compositional changes, rendering the systems of indicator species insufficient to assess the degree of alteration. This conclusions are in agreement with the opinion by Williams (1964) that phytoplankton dynamics may be viewed as useful1 indices of water quality.
Acknowledgements This research was supported by grant PID N” 3-05 1600 from the National Research Council of Argentina (CONICET). We wish to thank Dr N. Maidana for her advise in the determination of diatoms.
References American Public Health Association, 1975. Standard Methods for the Examination ofwastewaters, 14th edn. APHA, AWWA, WPCF, Washington, 1193 pp. Allen, T. F. H. & J. F. Koonce, 1973. Multivariate approaches to algal stratagems and tactics in systems analysis of phytoplankton. Ecology 54: 1234-1246. Amblard, C., 1987. Les successions phytoplanktoniques en milieu lacustre. Ann. Biol. 26: l-34. Austin, M. P. & P. Greig-Smith, 1968. The application of quantitative methods to vegetation survey. II. Some
153 methodological problems of data from the rain forest. J. Ecol. 56: 821-844. Biggs, B., 1985. Algae, a blooming nuisance in rivers. Soil Wat. 21: 27-31. Cairns, J. Jr, G. R. Lanza & B. C. Parker, 1972. Pollution related structural and functional changes in aquatic communities with emphasis on freshwater algae and protozoa. Proc. Acad. nat. Sci. Philad. 124: 79-127. Chessman, B. C., 1985. Phytoplankton of La Trobe River, Victoria. Aust. J. mar. Freshwat. Res. 36: 115-122. Chessman, B. C., 1986. Diatom flora of an Australian river system: spatial patterns and environmental relationships. Freshwat. Biol. 16: 805-819. Cot&, R., 1981. Variations saisonnieres de la production primaire dans les eaux de surface de la rivitre du Saguenay. Hydrobiologia 83: 3-10. Couillard, D. & Y. Lefevre, 1985. Analysis of water quality indices. J. envir. Mgmt. 21: 161-179. Descy, J. P., 1987. Phytoplankton composition and dynamics in the River Meuse (Belgium). Arch. Hydrobiol. 78: 225-245. Dixon, W. J. (ed.), 1981. BMDP Statistical Software. University of California Press, Berkley. Fischer, S. G., 1983. Succession in streams. In J. R. Barnes & G. W. Minshall (eds), Application and Testing of General Ecological Theory. Plentum Press, New York, London: 7-27. Fjerdingstad, E., 1964. Pollution of streams estimated by benthal phytomicroorganisms. I. A saprobic system based on communities of organisms and ecological factors. Int. Revue ges. Hydrobiol. 49: 63-131. Garcia de Emiliani, M. O., 1981. Fitoplancton de 10s principales cauces y tributarios de1 valle aluvial de1 rio Parana: tramo Goya-Diamante. Rev. Asoc. Cienc. Nat. Litoral 12: 112-125. Green, R. H. & G. L. Vascotto, 1978. A method for the analysis of environmental factors controlling patterns of species composition in aquatic communities. Wat. Res. 12: 583-590. Guhl, W., 1987. Aquatic ecosystem characterized by biotic indices. Int. Revue ges. Hydrobiol. 72: 431-455. Hammer, U. T., 1983. Limnological studies of the lakes and streams of the upper Qu’Appelle River System, Saskatchewan, Canada. Hydrobiologia 99: 125-144. Kiss, K. T., 1984. Changes in trophity conditions in the River Danube at God. Annal. Univ. Sci. Budapest, Sect. Biol. 24-26: 47-59. Kiss-Keve, I., 1974. Effect of the turbidity of the water on the development of algal associations in the Tisza. Tiscia/Szeged. 9: 9-24. Kolkwitz, R. & M. Marsson, 1908. Okologie des pflanzenlichen Saprobien. Ber. Deutsch. Bot. Ges. 26: 505-519. Lebart, L., A. Morineau & J. P. Fenelon, 1979. Traitement des Don&s Statistiques. Ed. Bordes, Paris, 510 pp. Lakshminarayana, J. S. S., 1965. Studies on the phytoplankton of the River Ganges, Varanasi, India. Hydrobiologia 25: 119-165.
Leclercq, L., 1984. Etude Ccologique des rivieres du nord du massif Ardennais (Belgique): flore et vegetation de diatomdes et physico-chimie des eaux. 2. Typologie des milieux naturels. Robertville, Stat. scient. Haute+Fagnes, 5 + 329 pp. Lewis, W. M., 1978. Analysis of succession in a tropical phytoplankton community and a new measure of succession rate. Am. Nat. 112: 401-414. Margalef, R., 1969. El concept0 de polucibn en limnologia y sus indicadores biol6gicos. Agua 7: 103-133. Margalef, R., 1983. Limnologia. (ed.) Omega, Barcelona, 1010 pp. Nalewajko, C. & D. R. S. Lean, 1980. Phosphorous. In I. Morris (ed.), The Physiological Ecology of Phytoplankton. Blackwell Scientific Publications, Oxford: 235-258. Nygaard, G., 1949. Hydrobiological studies in some ponds and lakes. Part II. The quotient hypothesis and some new or little known phytoplankton organisms. Kgl. Danske. Vidensk. Selsk. Biol. Skrifter 7(l): l-293. Odum, E. P., 1971. Fundamentals of Ecology, 3d edn. W.B. Saunders Co, Philadelphia, London, Toronto, 574 pp. Orlocci, L., 1966. Geometric models in ecology. I. The theory and application of some ordination methods. J. Ecol. 54: 193-215. Pielou, E. C., 1984. The Interpretation of Ecological Data. John Wiley & Sons, New York, 263 pp. Rai, H., 1974. Limnological studies of the River Yamuna at Delhi, India. Part II. Arch. Hydrobiol. 73: 492-517. Reynolds, C. S., 1984. The Ecology of Freshwater Phytoplankton. Cambridge University Press, Cambridge, 384 PP. Rawson, D. S., 1956. Algal indicators of trophic lake types. Limnol. Oceanogr. 1: 18-25. Sabater, S. & F. Sabater, 1988. Diatom assemblages in the River Ter. Arch. Hydrobiol. 111: 397-408. Shannon, C. E. & W. Weaver, 1949. A Mathematical Theory of Communication. Univ. Illinois Press, Urbana, Chicago, London, 125 pp. Simm, A. T., 1985. The phytoseston of the Vistula River between G&a Kalwaria and Nowy Div6r Mazowiecki in 1982. Ekol. Pol. 33: 439-453. SladeEek, V., 1973. System of water quality from the biological point of view. Ergeb. Limnol. 7: I-218. Smayda, T., 1980. Phytoplankton species succession. In I. Morris (ed.), The Physiological Ecology of Phytoplankton. Blackwell Scientific Publications, Oxford: 493-570. Sournia, A. (ed.), 1978. Phytoplankton Manual. Monographs of oceanographic methodology, UNESCO, 337 pp. Swale, E. M. F., 1969. Phytoplankton in two english rivers. J. Ecol. 57: l-23. Tailing, J. F., 1976. Phytoplankton: composition, development and productivity. In J. Rzoska (ed.), The Nile: Biology of an Ancient River. Den Haag: Dr W. Junk: 385-406. Utermohl, H., 1958. Zur Vervollkommnong der quantitativen Phytoplankton metodik. Mitt. int. Ver. Limnol. 9: l-38.
1.54 Weber, C. I. & D. Moore, 1967. Phytoplankton, seston and dissolved organic carbon in the Little Miami River, Ohio. LimnoJ. Oceanogr. 12: 311-318. Wetzel, R. G., 1975. Limnology. W.B. Saunders Co, Philadelphia, London, Toronto, 743 pp. Willen, E. & T. Willen, 1979. Phytoplankton in freshwater monitoring. The National Swedish Environmental Protection Board, Report PM 1151: 184-195. Williams, L. G., 1964. Possible relationships between plank-
ton-diatom species numbers and water-quality estimates. Ecology 45: 809-823. Wolf, H., 1982. Method of coding ecological data from diatoms for computer utilization. Mededel. Rijksgeol. Dienst. 36(2): 95-l 10. Wu, J. T., 1986. Relation of change in river diatom assemblages to water pollution. Bot. Bull. Academia Sinica 27: 237-245.