Project Highlight: Quality Graphics for Statistical Summaries Alan M. MacEachren
Daniel Carr
David Scott
GeoVISTA Center & Geography 302 Walker, Penn State Univ. University Park, PA 16803 +1-814-865-7491
Dept. of Applied & Eng. Statistics George Mason Univ. Fairfax, VA 22030 +1-703-993-1671
Dept. of Statistics Rice University, PO Box 1892 Houston, TX 77251-1892 +1-713-348-6037
[email protected]
[email protected]
[email protected]
ABSTRACT The specific objective of our dgQG research has been to develop and assess quality graphics for federal statistical summaries. The goal has been to develop methods for generating quality graphics that facilitate exploration by agency users evaluating data quality and looking for emergent trends, decision making by public policy makers, and communication of statistical summaries to the public. This year the focus has been on completing joint projects with agency collaborators and on follow-up research funded through supplement or contract by agency sponsors. Here, we highlight three developments.
Keywords Maps, statistical graphics, exploratory data analysis, geovisualization, online learning.
1. INTRODUCTION Project activities during 2004 emphasized two foci. First, we continued to develop new exploratory data analysis (EDA) methods for exploring statistical data generated by federal government agencies and working with agency partners to apply those methods to address questions relevant to agency missions. Second, we completed development and assessment of online, map-based learning tools designed to interest children in statistics, maps, and statistical graphics.
2. DEVOLOPING ESDA METHODS We have worked closely with agency collaborators to develop innovations in methods for exploring and analyzing statistical data,, with an emphasis on data with a geospatial component. Two successful exploratory methods are highlighted here.
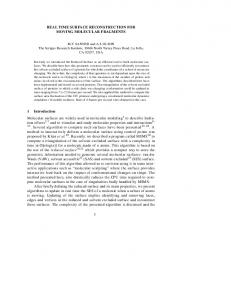
2.1 Conditioned Choropleth Maps Working with colleagues at the EPA, we extended the Conditioned Choropleth Maps (CCMaps) method in several ways (incorporating more effective direct manipulation controls, adding linked statistical diagrams, making data input more flexible) and applied the result to a variety of questions relevant to agency missions. Figure 1 illustrates application to the search for explanations for spatial patterns of species richness. In the figure, bird species richness (numbers of species) is the dependent variable Permission to make digital or hard copies of all or part of this work for personal or classroom use is granted without fee provided that copies are not made or distributed for profit or commercial advantage and that copies bear this notice and the full citation on the first page. To copy otherwise, or republish, to post on servers or to redistribute to lists, requires prior specific permission and/or a fee. The National Conference on Digital Government Research, dg.o2005, May 15–18, 2005, Atlanta, GA, USA. Copyright 2005 ACM 1-58113-000-0/00/0004…$5.00.
Figure 1. Conditioned choropleth map applies to analysis of species richness / climate interactions. and annual range of temperature and annual precipitation are the conditioning variables. Low and medium values of richness are associated with low temperature and high precipitation in the upper left panel. However, in Oregon (in contrast to global patterns of species richness with these climate variables), the opposite is not the case. Instead, it is intermediate values of precipitation that are associated with the highest richness (center row).
2.2 ESTAT The Statistical Research & Applications Branch of the National Cancer Institute contracted with the GeoVISTA Center at Penn State to develop ESTAT (the Exploratory Spatial-Temporal Analysis Toolkit). ESTAT (figure 2) is a focused data exploration and analysis toolkit directed to supporting NCI research in cancer surveillance and control. The toolkit features four dynamically linked components: (a) a scatterplot, (b) a choropleth map (that can represent both univariate and bivariate information), (c) a time series plot, and (d) a parallel coordinate plot (PCP). Selection of entities in any view produces highlighting of those same entities in other view (e.g., in the figure below, highlighting southeastern states on the map will cause points in the scatterplot and lines in the time series plot and PCP that represent state not in the southeast to fade to light gray). ESTAT development leveraged GeoVISTA Studio (a componentbased, open source Java application building environment developed at Penn State) and several analytical components developed as part of our Digital Government Quality Graphics project. We
Figure 2. ESTAT example. View shows a time series of ascending age-adjusted colon cancer incidence rates (for all races/both sexes) - lower left. A bivariate choropleth map (lower right) shows the spatial relationship between ascending and descending colon cancer (orange represents high ascending and low descending colon cancer rates and turquoise represents the reverse). Pennsylvania has generally higher incidence (darker). Ascending and descending colon cancer rates exhibit a mild positive relationship (scatterplot – upper left). The parallel coordinate plot is being used to explore multivariate relationships between cancer incidence and possible covariates. A data classification and color scheme selecfollowed a user-centered design approach, working closely with staff at NCI throughout ESTAT development. The ESTAT PCP was re-engineered from scratch to meet initial analyst needs and provide methods that support easy extension of functionality.
3. ONLINE LEARNING FedStats supports a cross-agency web portal designed to help all Americans find statistical summaries to support personal or business decisions, enable diverse research, and participate in public policy debates (http://www.fedstats.gov). The FedStats program funded our development of MapStats for Kids, a map-based learning activity for middle school children and their teachers and parents. MapStats for Kids (http://www.fedstats.gov/kids/mapstats) has focused on developing a range of Macromedia Flash-based geographic and statistical online learning activities for middle school children. The MapStats for Kids web site (figure 3) contains several map-based learning activities (presented as games) plus definitions of statistical and geographic terms and concepts as well as a section for teachers and parents that puts the learning activities into the context of relevant national standards in math, geography, and science.
4. ACKNOWLEDGMENTS This research is supported by the National Science Foundation under Grants No. EIA-9983451, 9983459, 9983461.
Figure 3. MapStats for Kids homepage.