Pseudomonas aeruginosa were obtained from the University of Maryland, ..... treatment plant (Little Patuxent Water Reclamation Plant, Howard County, MD).
Published in Ultrasonics and Sonochemistry 19, 710-717, April 2012
Disinfection of Gram – Negative and Gram – Positive Bacteria using DYNAJETS® Hydrodynamic Cavitating Jets Gregory Loraine, Georges Chahine, Chao-Tsung Hsiao, Patrick Aley DYNAFLOW, INC. Jessup, MD, USA
ABSTRACT Cavitating jet nozzles (DYNAJETS®) were investigated as a means of disinfection of gram-negative E. coli, Klebsiella pneumoniae, Pseudomonas syringae, and Pseudomonas aeruginosa, and gram-positive Bacillus subtilis. The cavitating jets were found to be very effective in reducing the concentrations of all of these species. In general, the observed rates of disinfection of gram-negative species were higher than for gram-positive species. However, different gram-negative species also showed significant differences (P. syringae 6- log10 reduction, P. aeruginosa 2-log10 reduction) under the same conditions. Disinfection of E. coli repeatedly showed 5 orders of magnitude reduction in concentration within 45 to 60-minutes at low nozzle pressure (2.1 bar). Optimization of nozzle design and operating pressures increased disinfection rates per MJ of power by several orders of magnitude. The power efficiencies of the hydrodynamic cavitating jets were found to be 10 to 100 times greater than comparable ultrasonic systems. Keywords: hydrodynamic cavitation; disinfection; E. coli; B. subtilis; spores
1. INTRODUCTION While ultrasonic cavitation processes have been shown to be an effective means of disinfection for bacteria in liquids [1-7], their use has been somewhat restricted to small volumes and specialized applications such as sterilization of medical and dental equipment and food processing [8-9]. A factor in limiting the application of cavitation for disinfection is the relatively high energy costs associated with ultrasonic cavitation. However, the energy efficiency of disinfection of water using hydrodynamic cavitating jets has been shown to be at least an order of magnitude higher than that of ultrasonic devices and the required energy inputs much lower [2,10,11]. Several recent studies have taken advantage of this and examined the application of hydrodynamic cavitation to the disinfection of bacteria in water and wastewater [2,10-15]. Hydrodynamic cavitation differs from ultrasonic cavitation in how cavitation is generated. In hydrodynamic cavitation, large fluctuating pressure forces in the shear layer causes preexisting microscopic bubble nuclei in the liquid to cavitate, that is to grow explosively and collapse violently. In ultrasonic cavitation high frequency sound generates cyclic pressure waves in the liquid that drive cavitation. As the cavitating bubble collapses its gas content is highly compressed creating very high pressures (~500 atm) and temperatures (~5,200 ○K) inside the bubble [16,17]. These high pressures and temperatures result in chemical and physical processes that are significant in understanding disinfection of bacteria by liquid cavitation.
1
Published in Ultrasonics and Sonochemistry 19, 710-717, April 2012 Gases including water vapor in the interior of the collapsing bubbles can undergo cleavage of molecular bonds. Volatile compounds in the bubble interior can be pyrolyzed. Water vapor can be split into OH• and H• radicals during bubble collapse. These free radicals can oxidize and reduce molecules in the vapor [16,17]. Compounds near the walls of the collapsing bubbles will also be exposed to OH• and other free radicals diffusing from the bubbles. These processes are most likely of limited importance in disinfection due to the large sizes of the organisms [12]. However, OH• are strong oxidizers and the direct oxidation of microorganisms during hydrodynamic cavitation has been reported [18]. In addition to the generation of oxidants, strong cavitation bubble collapse also results in shock waves, high shear, super critical water, and pressure and temperature spikes. This extremely adverse local environment can result in rupture of cell walls, interference with osmotic responsiveness, loss of intercellular material, and disruption of protein synthesis [2,3,12,18]. The question of which of these diverse mechanisms are the most critical in hydrodynamic cavitation is open. Elucidating the kill mechanism of hydrodynamic cavitation will increase its utility by allowing for the intelligent application of this technology. Currently, studies of the disinfection mechanism of hydrodynamic cavitation are limited. Balasundaram and Harrison [13] studied the disruption of the cell walls of E. coli using hydrodynamic cavitation for the purpose of preferentially releasing engineered proteins from the organisms. The concentrations of proteins originating from the periplasm or cytoplasm of the E. coli were monitored as the bacteria were jetted through an orifice plate for up to 1000 cycles (passes through the orifices). They postulated a kill mechanism for multiple passes through an orifice. In the first stage the outer membrane is perforated allowing loss of periplasmic proteins. In the second stage the cytoplasm membrane is now exposed to the effects of cavitation and oxidation due to the loss of integrity of the outer membrane and cytoplasmic proteins are lost. Continued cavitation results in more complete breakdown of the outer membrane. Unfortunately, cell viability was not measured in this study. However after 400 cycles 40-50% of the soluble proteins and enzymes from the E. coli had been lysed. High-pressure homogenization is another process in which bacteria in liquids are exposed to transient pressure changes analogous to the pressure spikes during cavitation [19,20]. In high pressure homogenization, liquid is pumped against a valve which requires a high pressure (100 -300 MPa) to open it. The high pressure conditions last for roughly one second [19]. Once the valve is open the liquid experiences a rapid pressure drop and high shear. It is often used as a disinfection process for food, such as milk. The susceptibility of bacteria to high pressures varies between species and even growth phases. Cells are more resistant during stationary growth phase than in exponential growth phase [21]. Wuytack et al. [19] and Kelemen and Sharpe [20] examined the effects of highpressure homogenization on gram-positive and gram-negative bacteria species. Gram’s staining is a method of classifying bacteria based on the structure of their cell walls [22]. Gram-positive bacteria have a cell wall composed of a thick layer of petidoglycan and small amounts of teichoic acids. The peptidoglycan layer is much thicker than that of gram-negative bacteria. Gram-negative cell walls are made up of a composite of an outer membrane, a periplasmic space, a peptidoglycan membrane, a periplasmic space, and the
2
Published in Ultrasonics and Sonochemistry 19, 710-717, April 2012 cytoplasmic membrane. The outer membrane is a bilayer of phospholipids and lipopolysaccharides. The periplasmic spaces are filled with liquid proteins. The peptidoglycan membrane is much thinner (5-10% of the cell wall) than that of grampositive bacteria. The cytoplasmic membrane is a phospolipid bilayer. The resistance of a cell to mechanical stresses has been related to the level of cross-linking in the peptidoglycan layer [23]. Since the peptidoglyacan layer in gram-negative cell walls is much thinner, even if it is extensively cross-linked, it will still be less resistant to rupture of the cell wall than would gram-positive species. Kelemen and Sharpe [20] found that during high-pressure homogenization gramnegative E. coli were disrupted at lower pressures than were gram-positive Bacillus subtilis. This was attributed to the composition of their cell walls. Wuytack et al. [19] compared the disinfection of five species of gram-positive bacteria and six species of gram-negative bacteria using high-pressure homogenization and high hydrostatic pressure (200-400 MPa applied uniformly for several minutes). The kill mechanism of high hydrostatic pressure was reported to be interference with cellular functions inside the cytoplasm (interior) of the cells. There was no clear correlation between cell wall structure and susceptibility to hydrostatic pressures. There was a clear correlation with cell wall structure with high-pressure homogenization [19]. The thicker walled gram-positive species were much more resistant than were the thin walled gram-negative species. They concluded that high-pressure homogenization kills bacteria through mechanical destruction of cell integrity. Thus, if the kill mechanism of bacteria undergoing hydrodynamic cavitation is mechanical disruption of the cell walls, then there would be large differences in the disinfection efficiencies of gram-positive and gram-negative bacteria. What is more, since the cavitation conditions experienced by bubble nuclei are dependent on the operating conditions and the design of the cavitation chamber, varying these parameters should also have a clear effect on the disinfection rates observed [12,24]. Disinfection experiments were conducted using hydrodynamic cavitation generated with the DYNAJETS® nozzles described below. Several species were used including gram-negative E. coli MC 4100, Klebsiella pneumoniae, Pseudomonas syringae and Pseudomonas aeruginosa. E. coli is a common potential waterborne human pathogen. Measurements of E. coli in wastewater are often used as an indicator of the level of overall bacterial content. Klebsiella pneumoniae (gram-negative) was used as a surrogate species for human pathogens. Pseudomonas aeruginosa is a good representative of opportunistic pathogens of humans and is a gram-negative, aerobic rod. P. aeruginosa has a greater degree of cross-linking of peptidoglycan than does E. coli [25]. Pseudomonas syringae is very similar to P. aeruginosa except that it is a plant pathogen and could be easily grown for laboratory testing. Bacillus subtilis EM 1600 was used as the gram-positive species. The E. coli and B. subtilis were extensively tested using various nozzle types and flow conditions for optimization studies because both are good indicators of a wide range of human pathogenic bacteria. They are also both rod shaped and are of similar size [20]. The effects of species, nozzle type, nozzle pressure, and microorganism concentration, were determined. The DYNAJETS® cavitating jet technology employs various nozzle designs to induce cavitation in submerged water jets. The STRATOJET® incorporates acoustic
3
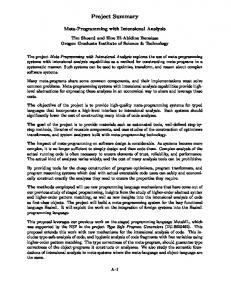
Published in Ultrasonics and Sonochemistry 19, 710-717, April 2012 resonance in the flow to result in very high amplitude, periodic, oscillatory discharge (Figure 1 left) [26-28]. Acoustic resonance is achieved in the nozzle feed-tube assembly when a standing wave forms in the “organ-pipe” feed tube to the STRATOJET® nozzle.
Figure 1. Left hand side, Strobe photograph of cavitating vortex rings in a STRATOJET®. Right hand side, Flow visualization of DYNASWIRL® showing helicoidal cavity. The swirling cavitating jet, DYNASWIRL®, achieves cavitation at even higher cavitation numbers (i.e. lower jet velocities) than the STRATOJET®. Swirl is achieved by means of tangential injection slots, resulting in a central vortex, which appears as a helicoidal filament along the jet axis (Figure 1 right). The DYNASWIRL® jets have the advantage of generating very large cavity surface areas that start inside the nozzle assembly and extend in front of the nozzle orifice.
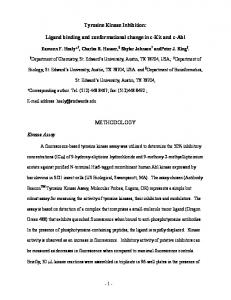
2. DISINFECTION EXPERIMENTAL PROCEDURES The disinfection experiments were conducted in batch reactors using either a DYNASWIRL® or STRATOJET® jet nozzle. A batch reactor consisted of a 3.7 KW positive displacement pump, a temperature controlled reservoir, and an in-line DYNAJETS® nozzle (Figure 2). The total sample volume was varied between 1.8 and 20 liters, depending on the test conditions.
4
Published in Ultrasonics and Sonochemistry 19, 710-717, April 2012
Cooling water coils
Reservoir
Reaction chamber Nozzle Bypass control valve Pressure Gauge
Pump Figure 2. Schematic of Experimental set-up.
E. coli MC 4100, Klebsiella pneumoniae, Pseudomonas syringae and Pseudomonas aeruginosa were obtained from the University of Maryland, and were cultured in sterile buffered salt solutions (M9 Minimal Salts, Sigma) fortified with glycerol (99%, Sigma), or LB Broth (LB Broth, Miller, US Biological). B. subtilis EM 1600 cultures were grown in M9 salts with 2% LB Broth. Flasks of media were inoculated from streak plates, and the cultures were grown overnight in a temperature controlled shaker water bath. Incubation was continued until the midpoint of the exponential growth phase as determined by light absorbance (600 nm). This insured populations in a robust stage of growth – neither in saturation mode, such that no further growth would occur, nor at too low an initial concentration [21,29,30]. Bacteria concentrations in the experiments were adjusted by diluting the growth stock solution with sterile buffered salt solutions. The solution was added to the test loop and was circulated through the DYNAJETS® nozzles under controlled pressures and flow rates in a batch mode. The temperature was controlled by running chilled water through a cooling coil located inside the reservoir (Figure 2). During the test, samples of approximately 5 ml were taken every 5 to 30 min, with the higher frequency occurring at the beginning of the tests. The samples were then serially diluted and plated on agar plates in duplicate. The plates were incubated at 37 °C for 48 hours after which viable colonies were counted [31]. The concentrations of the bacterial solutions were recorded as colony forming units per milliliter (CFU/ml). A portion of the bacteria laden liquid was maintained in a flask in a shaker water bath and monitored to serve as a control.
5
Published in Ultrasonics and Sonochemistry 19, 710-717, April 2012
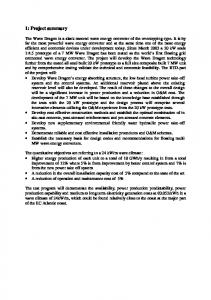
3. EXPERIMENTAL RESULTS 3.1 Gram-Negative Species Disinfection tests with pure cultures of gram-negative bacteria were run in batch tests using either a DYNASWIRL® nozzle or a STRATOJET® nozzle. Disinfection of Klebsiella, and Pseudomonas using hydrodynamic cavitation has, to our knowledge, rarely been reported in the open literature. Figure 3 shows the disinfection of Klebsiella pneumoniae and E. coli using a DYNASWIRL® cavitating jet with a single exit orifice with a diameter of 0.323 cm, and operated at 2.1 bar (30 psi). The initial concentrations of Klebsiella pneumoniae and E. coli were C0 ~ 107 CFU/ml. The test batch volume was 2 liters. Both cases achieved a reduction to a level of ~ 100 CFU/ml within 60 minutes, a 5log10 reduction, that is, 99.999% removal. The error bars in the figures are calculated from the standard deviations of the duplicates of the CFU/ml measurements. Disinfection of high concentrations of Pseudomonas aeruginosa (~108 CFU/ml) and Pseudomonas syringae (~107 CFU/ml) were conducted using an eight-orifice STRATOJET® at a pump pressure of 16.5 bar (240 psi), and a batch volume of 1.8 liters ( Figure 4). A nearly 3-log10 decrease in P. aeruginosa concentration was observed in 90 minutes. P. syringae concentrations were reduced in excess of 6-log10 in 20 minutes. The differences in the disinfection rates of the gram-negative species may be related to the degree of cross-linking in the peptidoglycan layer of the cell walls. Young [25] determined that P. aeroginosa had a higher degree of cross-linking than did E coli. These results are thus consistent with a disinfection mechanism based on rupture of cell walls. As can be seen in Figure 3 and Figure 4, the disinfection rate for E. coli using the DYNASWIRL® nozzle was roughly twice as great as was seen with the STRATOJET® nozzle. A more complete analysis of the effect of nozzle type on disinfection rate is discussed below. 1.00E+08
1.00E+07
Klebsiella E coli
CFU/ml
1.00E+06
1.00E+05 1.00E+04
1.00E+03 1.00E+02
1.00E+01 0
20
40
60
Disinfection Time (mins.)
6
80
100
Published in Ultrasonics and Sonochemistry 19, 710-717, April 2012 Figure 3. Comparison of reductions of Klebsiella and E. coli for a single 0.32 cm orifice
DYNASWIRL® cavitating jet operating at 2.1 bar. 1.E+09 E.coli
1.E+08
P. Aeruginosa P. Aeruginosa
1.E+07
P. Syringae
CFU/ml
1.E+06
P. Syringae
1.E+05 1.E+04 1.E+03 1.E+02 1.E+01 1.E+00 0
20
40
60
80
100
120
140
Time (mins)
Figure 4. Disinfection of Pseudomonas aeruginosa, Pseudomonas syringae, and E. coli
using an 8-orifice STRATOJET® cavitating jet nozzle operating at a pump pressure of 16.5 bar.
3.2 Influence of DYNAJETS® Types and Operating Conditions One important concept in comparing the experimental results is the number of times a fluid particle has been subjected to cavitation, i.e. the number of cycles it has gone through the loop. To account for various volumes, pressures and flow rates, we normalize the disinfection time by the ratio of the system volume, V, and the flow rate through the loop, Q, to get the number of times or cycles through the loop, N, that a fluid particle has been exposed to cavitation. (1) N t/ ( V / Q). In order to compare the decreases in bacteria concentration of experiments with different initial concentrations C0, we normalize the concentration by C0. The observed bacteria reduction was correlated to the hydraulic energy input to the liquid Eh given by the product of the input hydraulic power Ph and disinfection time, t. For a volumetric flow rate, Q, and a pump pressure rise of P , this is given by: Eh = Ph t Q P t. (2) In order to generalize this, we can divide the energy by the liquid volume to obtain an input hydraulic energy per unit volume Eh* : E*h =Eh / V = Ph t / V Q P t / V . (3)
7
Published in Ultrasonics and Sonochemistry 19, 710-717, April 2012 This can be utilized to compare different configurations operating at different pressures and flow rates. As will be seen below, although one configuration may produce a more rapid disinfection, it may be less energy efficient than another. Figure 5 to Figure 7 present results of experiments conducted with E. coli in buffered salt media for different types of DYNAJETS® and for different pump pressures. In all cases, the initial bacteria concentration was about 106 CFU/ml. Figure 5 presents the bacteria concentration, C, versus time, while Figure 6 presents the normalized concentration, C/C0, versus the number of cycles, N. Figure 7 presents the normalized data, C/C0, versus the applied hydraulic energy. In all four cases 4 to 6 log10 reductions in E. coli concentrations were observed. Disinfection using the 8-orifice STRATOJET® was faster at 16.5 bar than at 5.2 bar (Figure 5) but was less efficient (Figure 7). The faster disinfection rate at the higher pressure was due to the faster flow rate (more cycles per unit time). When the disinfection rates are normalized by N (Figure 6) this difference was seen to be minimal. 1.E+07
1.E+06 DynaSwirl 5.2 bar
CFU /ml
1.E+05
1.E+04 8-Orifice 5.2 bar
1.E+03
1.E+02 8-Orifice 16.5 bar
1.E+01
72-Orifice 5.2 bar
1.E+00 0
30
60
90
120
150
180
210
240
Time (mins)
Figure 5. Comparison of the reductions of E. coli achieved for the 8-orifice plate STRATOJET® operating at 16.5 bar (240 psi) and 5.2 bar (75 psi), the 72-orifice manifold
DYNAJETS® operating at 5.2 bar (75 psi), and the single orifice swirling DYNAJETS® operating at 5.2 bar (75 psi). Figure 5 through Figure 7 also compare the performance at the same operating pressures for three different types of DYNAJETS®: an 8-orifice plate STRATOJET® with 0.114 cm diameter orifices, a 72-orifice manifold configuration with 0.038 cm diameter orifices, and a slotted DYNASWIRL® with a single exit orifice of 0.323 cm diameter. All three nozzles had the same flow rates and total opening area (0.082 cm2) so the results were due to hydrodynamic effects of the different nozzle geometries. However, for E. coli the differences in removal efficiencies were relatively small. This was not the case
8
Published in Ultrasonics and Sonochemistry 19, 710-717, April 2012 for B. subtilis which is discussed below. Figure 7 shows that the lower pressure tests were much more efficient than the 8 orifice 240 psi test.
1.E+00
1.E-01
C/C0
1.E-02
8-Orifice 5.2 bar
DynaSwirl 5.2 bar
1.E-03
8-Orifice 16.5 bar
1.E-04
1.E-05
72-Orifice 5.2 bar
1.E-06 0
300
600
900
1200
Cycles, N
Figure 6. Data of Figure 5 expressed in non-dimensional form.
1.E+00
1.E-01
1.E-02
C/C0
8-Orifice 5.2 bar
8-Orifice 16.5 bar
1.E-03
DynaSwirl 5.2 bar
1.E-04
1.E-05
72-Orifice 5.2 bar 1.E-06 0
0.5
1
1.5
2
2.5
3
3.5
Input Energy (MJ)
Figure 7. Reduction in bacteria count ratio versus expended hydraulic energy for data of Figure 5.
9
Published in Ultrasonics and Sonochemistry 19, 710-717, April 2012 Arrojo et al. [12] also reported the rate of E. coli disinfection using hydrodynamic cavitation was dependent on nozzle configuration. They found that venturi type nozzles outperformed orifice plate type nozzles. They concluded that E. coli were more susceptible to extended lower intensity cavitation than to more intense localized cavitation.
3.3 INFLUENCE OF PUMP PRESSURE ON THE DYNASWIRL® JET From Equation (2) it can be seen that reducing the pump pressure reduces the hydraulic energy required. As can be seen from Figure 7, there was an inverse relationship between pump pressure and disinfection efficiency for E. coli. Unlike ultraviolet disinfection for instance, increasing power input does not necessarily increase disinfection efficiency. One of the objectives of this study was to determine the lowest operating pump pressure that could achieve significant disinfection using the DYNASWIRL® cavitating jet. Figure 8 and Figure 9 present results of experiments conducted with E. coli using a DYNASWIRL® with a single orifice (0.45 cm diameter) at three pressures. In all cases, the initial bacteria concentration was 107 CFU/ml. Figure 8 shows the relative reduction in bacteria concentrations for nozzle pressure drops of 3.45, 2.1, and 1.0 bar. Figure 9 shows the normalized data versus hydraulic energy input. As can be seen in these figures, significant reductions in bacteria count were achieved in both the 3.45 bar and the 2.1 bar cases, while the microorganism removal for the 1.0 bar case stagnated after 2-log10 removal. This can be examined with respect to the cavitation number, , is the dimensionless parameter characterizing cavitation,
Pamb pv Pamb pv , V 2 2 P
where Pamb is the ambient pressure, pv is the liquid vapor pressure, is the liquid density, V is the characteristic flow velocity, and P is the pressure drop across the nozzle. For applications where the jet discharges at ambient atmospheric pressure, P is the pump pressure relative to ambient. The particular value at which cavitation is incipient is defined as P pv i amb . P at inception Thus if the operating conditions for a submerged jet are such that /i < 1, cavitation will occur, and as /i continues to decrease below unity the amount of cavitation will increase. The data in Figure 8 and Figure 9 show that the 2.1 bar case resulted in a more rapid reduction than the 3.45 bar case. This may be due to a change in the cavitation characteristics as the jet exits the orifice, i.e. at 3.45 bar the DYNASWIRL® was cavitating too much. This indicates better operation at a cavitation number closer to inception, 0.5 for the 2.1 bar case than at 0.33 for the 3.45 bar case. When the pressure drop across the nozzle was further lowered to 1.0 bar ( 1 ), the limit value for cavitation to occur was approached and cavitation benefits were limited. The disinfection results in this case are comparable to those of the higher pressure cases, and a 2-log
10
(4)
(5)
Published in Ultrasonics and Sonochemistry 19, 710-717, April 2012 reduction was achieved in the first 30 min. However, limited additional reduction was achieved from there on, during the subsequent 90 minutes (400 cycles). In contrast, continued reductions were measured for the 2.1 and 3.45 bar pressure cases. The lower limit of operating pump pressure to obtain good microorganism reduction with the DYNASWIRL® swirling jet appears to be in the 1.4 to 2.0 bar range. The efficiency of disinfection per MJ of power is 10 times greater at 2.1 bar than at 3.45 bar due to a higher disinfection rate and lower hydraulic power input (Figure 9). Based on this, the 2.1 bar condition was selected to conduct a number of subsequent experiments to study the influence of other parameters on the performance of the DYNASWIRL® cavitating jet. Balasundaram and Harrison [13] found that the amount of proteins released by E. coli when the cell membranes were disrupted using hydrodynamic cavitation was dependent on the cavitation number of the system. They found that the lower the cavitation number the more efficient was the extraction of proteins and enzymes. As discussed above, they did not measure the viability of the cells however. It is possible that cell death occurs at a lower cavitation number than does release of periplasmic proteins. 1.E+00 1.E-01 1.E-02
C/C0
1.E-03 3.45 bar 1.E-04
2.1 bar 1.0 bar
1.E-05 1.E-06 1.E-07 1.E-08 0
200
400
600
800
1000
1200
1400
Cycles, N
Figure 8. Comparison of the reductions of E. coli in M9 achieved for a single 0.45 cm
orifice DYNASWIRL® cavitating jet operating at 1.0, 2.1, and 3.45 bar (15, 30 and 50 psi). Initial concentrations were 0.9 to 2 x 10⁷ CFU/ml.
11
Published in Ultrasonics and Sonochemistry 19, 710-717, April 2012
1.E+01 1.E+00 1.E-01
C/C0
1.E-02 1.E-03 1.E-04
3.45 bar 2.1 bar
1.E-05
1.0 bar
1.E-06 1.E-07 1.E-08 0
0.1
0.2
0.3
0.4
0.5
0.6
0.7
0.8
0.9
Energy (MJ)
Figure 9. Reduction in relative bacteria count versus expended hydraulic energy for data of Figure 8.
3.4 INFLUENCE OF THE INITIAL CONCENTRATION OF MICROORGANISMS A set of experiments was conducted to study disinfection performance of the DYNAJETS® for different initial E. coli concentrations. Four initial bacteria counts, spanning a six order of magnitude range, were tested: C0 ~ 103, 105, 107, 109 CFU/ml, all for the same DYNAJETS® nozzle configuration and under the same set of hydrodynamic operating conditions: a 2-liter batch volume and a single 0.32 cm orifice DYNASWIRL® cavitating jet at 2.1 bar. Results of these experiments (Figure 10) demonstrate the same general trend: the reduction starts relatively slowly then increases rapidly till the concentrations fell below about 100 CFU/ml.
12
Published in Ultrasonics and Sonochemistry 19, 710-717, April 2012
1.E+10 C0=1e9 test1 C0=1e9 test2 C0=1e7 test1 C0=1e7 test2 C0=1e5 test1 C0=1e5 test2 C0=1e3 test1
1.E+09 1.E+08
CFU /ml
1.E+07 1.E+06 1.E+05 1.E+04 1.E+03 1.E+02 1.E+01 1.E+00 0
50
100
150
200
Time (mins) Figure 10. Effect of initial concentration on reduction of E. coli in buffered salt solution for the slotted DYNASWIRL® cavitating jet operating at 2.1 bar.
The duration of the slower disinfection rate phase at the beginning of the tests was dependent on the initial concentration. The higher the initial concentration was, the longer the duration of the slow reduction phase. During the rapid reduction phase, the disinfection rates are comparable for all cases until the concentration reached 100 CFU/ml. Similar concentration effects have been reported for ultrasonic disinfection. Feril and Kondo [32] reported that cell lysis of human myelomonocytic lymphoma cells was inhibited at concentrations greater than 5 million/ml. Majumdar et al. proposed that the increased viscosity of solutions with high cell densities inhibits cavitation [33]. This also appears to be the case with hydrodynamic cavitation. Although Arrojo et al. [12] reported no initial lag period using hydrodynamic cavitation; they used lower initial concentrations of 103 to 105 CFU/ml. Our experiments did not show significant lag periods at these initial concentrations.
3.5 OPTIMIZATION STUDY FOR B. SUBTILIS Disinfection of Bacillus subtilis, a gram-positive bacteria, was investigated using the DYNASWIRL® nozzle at pump pressures ranging from 2.1 to 8.3 bar. In addition, a complete matrix of tests for B. subtilis was performed in the same pressure range using an 8-orifice STRATOJET®. 13
Published in Ultrasonics and Sonochemistry 19, 710-717, April 2012 Figure 11 through Figure 13 present results of experiments conducted with B. subtilis in buffered salt solution and 2% LB media with the DYNASWIRL® jet at pump pressures of 2.1, 4.1, 6.2, and 8.3 bar. Figure 11 presents the raw data, while Figure 12 and Figure 13 present normalized concentrations, C/C0, versus number of cycles, N, and hydraulic energy input, Eh (MJ), respectively. All cases, except the 4.1 bar case show reductions in bacteria counts of four orders or more within 2 hours.
1.E+08 1.E+07
CFU/ml
1.E+06 1.E+05 1.E+04 2.1 bar
1.E+03
4.1 bar 6.2 bar
1.E+02
8.3 bar
1.E+01 0
30
60 Time (mins)
90
120
Figure 11. Comparison of the reductions of Bacillus subtilis achieved for a single 0.32cm orifice DYNASWIRL® cavitating jet operating at 2.1, 4.1, 6.2, and 8.3 bar (30, 60, 90 and 120 psi).
It is interesting to note that there was little reduction of B. subtilis concentrations in any of the experiments until after 150 to 250 cycles. After this point the disinfection rates were relatively large. This was not observed with any of the gram-negative species, even at C0 > 107 CFU/ml. There appears to be an additive affect at work. Each pass through the nozzle may weaken the cell walls of B. subtilis until a point is reached where the integrity of the membrane is compromised. Jyoti and Pandit [2,10] studied the synergistic effects of cavitation followed by chemical oxidants such as hydrogen peroxide and ozone, for disinfection. One of the mechanisms they proposed for the enhancement of chemical disinfectants is that cavitation increases the permeability of the cell walls allowing greater transfer of the oxidants into the cell. To our knowledge, gram-positive species such as B. subtilis have not been used in this type of study. It would be interesting to see if the enhancement of chemical disinfectants also required multiple cavitation episodes. This could provide a useful probe for this system.
14
Published in Ultrasonics and Sonochemistry 19, 710-717, April 2012
1.E+01 1.E+00
C/C0
1.E-01 1.E-02 1.E-03 2.1 bar
1.E-04
4.1 bar 6.2 bar
1.E-05
8.3 bar
1.E-06 0
100
200
300 400 N Cycle
500
600
700
800
Figure 12. Reduction in relative bacteria count versus cycle number for data of Figure 11.
1.E+01 1.E+00 2.1 bar
1.E-01
C/C0
4.1 bar 6.2 bar
1.E-02
8.3 bar
1.E-03 1.E-04 1.E-05 1.E-06 0
0.5 1 Input Energy (MJ)
1.5
Figure 13. Reduction in relative bacteria count versus hydraulic energy input for data of Figure 11.
The disinfection efficiencies of both E. coli and B. subtilis using the DYNASWIRL® nozzle at a nozzle pressure of 2.1 bar are compared in Figure 14. Bacillus subtilis
15
Published in Ultrasonics and Sonochemistry 19, 710-717, April 2012 concentrations were reduced by 4.5-log at 0.16 MJ, while E. coli concentrations were reduced by more than 7-log10 after 0.12 MJ of hydraulic energy input. Thus hydrodynamic cavitation was more than twice as efficient in disinfecting E. coli than for B. subtilis. In addition, the disinfection efficiency of the DYNASWIRL® was seen to be greater than for the STRATOJET® for both species.
1.0E+01 E. coli
1.0E+00
B. subtilis
1.0E-01
C/C 0
1.0E-02 1.0E-03 1.0E-04 1.0E-05 1.0E-06 1.0E-07 1.0E-08 0
0.02
0.04
0.06
0.08
0.1
0.12
0.14
0.16
0.18
Input Energy (MJ)
Figure 14. Disinfection efficiency of DYNASWIRL nozzle at 2.1 bar for E. coli and B. subtilis.
Figure 15 present the B. subtilis concentration data from tests conducted at pump pressures of 2.1, 4.1, 6.2, and 8.3 bar using the multi-orifice STRATOJET®. The multiorifice STRATOJET® results (Figure 15) did not show good reduction for the pressure range studied.
16
Published in Ultrasonics and Sonochemistry 19, 710-717, April 2012
100
10
C/C 0
1
0.1 2.1 bar 4.1 bar 6.2 bar
0.01
8.3 bar 0.001 0
0.2
0.4
0.6
0.8
Input Energy (MJ) Figure 15. Comparison of the reductions of Bacillus subtilis achieved for multi-orifice StratoJet® operating at 2.1, 4.1, 6.2, and 8.3 bar (30, 60, 90 and 120 psi).
The disinfection of B. subtilis and E. coli using the STRATOJETnozzle are compared in Figure 16. The nozzle pressure in the E. coli experiment was 5.2 bar, the pressure in the B. subtilis experiment was 6.2 bar. There was roughly 4-log removal of E. coli after 0.9 MJ of hydraulic energy were used, while after 0.85 MJ were input only 1.4log removal of B. subtilis was observed (Figure 15). 1.0E+01 1.0E+00
C/C 0
1.0E-01 1.0E-02 1.0E-03 E. coli 5.2 bar B. subtilis 6.2 bar
1.0E-04 1.0E-05 0
0.2
0.4
0.6
0.8
1
Input Energy (MJ)
Figure 16. Comparison of energy required to disinfect solutions of E. coli and B. subtilis using a STRATOJET nozzle.
17
Published in Ultrasonics and Sonochemistry 19, 710-717, April 2012
3.6 DISINFECTION IN WASTEWATER In order to assess the ability of the DYNAJETS® technology to work efficiently in complex matrices, we utilized sewage obtained from a nearby municipal wastewater treatment plant (Little Patuxent Water Reclamation Plant, Howard County, MD). The samples were obtained post-primary settling and the media was sterilized in an autoclave prior to use. The sterile sewage media was inoculated with E. coli (MC4100) and incubated until the measured E. coli concentration was 4 106 CFU/ml. It was then placed in the test loop and exposed to cavitation.
Figure 17. Reduction of E. coli in sewage media compared to that in growth media using an 8-orifice STRATOJET® operating at 5.2 bar. Results of the matrix testing (Figure 17) were compared with data from an experiment conducted with E. coli in culture media under otherwise identical conditions (1.8 L volume, 8-orifice STRATOJET® at 5.2 bar). The results for a given exposure time are virtually identical for the two cases. This finding strongly indicates that the matrix, such as sewage, does not affect disinfection by hydrodynamic cavitation.
3.7 ENERGY EFFICIENCY COMPARISON WITH ULTRASOUND The energy efficiency of the DYNAJETS® was compared to similar ultrasonic cavitation studies using the method of Jyoti and Pandit [34]. In this method the energy efficiency is calculated based on the electrical energy consumption. The disinfection efficiency of the DYNAJETS® with E. coli was calculated by dividing the rate of disinfection per minute by the power density, Eh* from Equation (5).
18
Published in Ultrasonics and Sonochemistry 19, 710-717, April 2012
C log10 min 1 C0 Eff . Eh* Apparatus
-log(C/C0) min-1
STRATOJET® 8-
(6)
Efficiency (log10-L/W)
Species
Ref.
0.0087
Power Density (W/L) 8.84
9.84 x 10⁻⁴
DYNASWIRL®
0.0148
1.12
1.3 x 10⁻²
0.127 orifice, 2.1 bar US 20 KHz
E. coli MC 4100 E. coli MC 4100
Present study Present study
0.044
260
1.68 x 10⁻⁴
[35]
US 20 KHz
0.031
280
1.11 x 10⁻⁴
US 20 KHz
0.046
470
9.79 x 10⁻⁵
US 20 KHz
0.07
126
5.55 x 10⁻⁴
US 20 KHz
0.10
290
3.44 x 10⁻⁴
US 20 KHz
0.29
654
4.43 x 10⁻⁴
US 20 KHz
42
12600
3.33 x 10⁻⁴
E. coli ATTC 11229 E. coli ATTC 11229 E. coli ATTC 11229 E. coli 0157:H7 E. coli 0157:H7 E. coli 0157:H7 E. coli XL1-Blue
orifice, 5.2 bar
[35]
[35]
[1] [1] [1] [36]
Table 1. Rates of disinfection of E. coli normalized by power density applied for DYNAJETS® and Ultrasonic treatment.
The disinfection rates and applied power densities from several citations from literature in which E. coli was removed using ultrasound are compared with those found in this study in Table 1 [1,35,36]. The literature references are from similar bench scale studies. The power densities of the ultrasound studies were calculated as the electrical energy applied to the ultrasound probe divided by treated volume.
Power density
Watt Surface Area of Tip . Volume
(7)
The power densities used in the DYNAJETS® studies were 2 to 4 orders of magnitude lower than in the ultrasound studies, and showed removal efficiencies that were 1 to 2 orders of magnitude higher than conventional ultrasonic devices. This finding is in
19
Published in Ultrasonics and Sonochemistry 19, 710-717, April 2012 agreement with similar studies of efficiencies on hydrodynamic cavitation and ultrasonic cavitation [2,10, 34].
4. CONCLUSIONS Comparison of the disinfection rates of gram-positive and gram-negative species under identical disinfection conditions showed that the gram-negative species with thinner cell walls were more enable to hydrodynamic cavitation than were the thick walled B. subtilis. Amongst the gram-negative species, the most resistant species was P. aeruganosa. The greater degree of cross-linking of the peptidoglycan in P. aeruganosa makes it more resistant to cell wall rupture. These findings support the conclusion that the kill mechanism of hydrodynamic cavitation is rupture of the cell wall. E. coli and B. subtilis were further studied to determine the effects of nozzle geometry, operating pressure, temperature, and initial concentration. Nozzle pressure greatly affected disinfection efficiency of both E. coli and B. subtilis. The most efficient configuration for both species was the DYNASWIRL® nozzle operated at 2.0 bar nozzle pressure. This corresponds to a cavitation number of about 0.5. The two species showed differing reactions to nozzle type. The E. coli reduction rates were independent of nozzle geometry at constant pressure and flow rates. However, B. subtilis disinfection was dependent on nozzle type. B. subtilis can be more effectively disinfected using the DYNASWIRL® nozzle at 2.0 bar, than the STRATOJET® nozzle at 6.2 bar. Thus nozzle design was more important than operating pressure in the disinfection of resistant gram-positive species. Investigation of the importance of the initial microorganism concentration on the disinfection rate with the DYNASWIRL® shows that the microorganism disinfection is more efficient when the initial concentration is lower. High initial bacteria concentrations were found to delay the onset of disinfection. This may be due to higher viscosity or clumping of the biomass at concentrations above ~ 106 CFU/ml. The DYNASWIRL® system was also shown to reduce microorganisms and total coliforms in wastewater. Disinfection rates of E. coli were found to be independent of solution matrix. There was no significant difference found between disinfection in municipal wastewater and growth media. In terms of energy efficiency, the DYNAJETS® were 10 to 100 times more efficient than ultrasonic disinfection as compared to several studies published in the literature.
Acknowledgements We would like to thank Dr. Spencer Benson of the University of Maryland for his assistance. This work was funded by the US Environmental Protection Agency, SBIR Phase I and II Contract No. 68-D-03-066 and NASA, SBIR Phase I and II, Contract No. NAS9-01018.
References [1] K. Stanley, “Inactivation of Escherichia Coli O157:H7 and Listeria Monocytogenes by High-Intensity Ultrasound in the Presence of Salts”, Thesis, University of Tennessee-Knoxville, (2004). [2] K. Jyoti, A. Pandit, Biochem. Eng. J., 18 (2004) 9.
20
Published in Ultrasonics and Sonochemistry 19, 710-717, April 2012 [3] A. Vollmer, S. Kwakye, M. Halpern, E. Everbach, Appl. Environ. Micro., 64 (1998) 3927. [4] W. Everett, “Ultrasonic Disinfection System,” U.S. Patent No. 4,086,057, April 1978. [5] N. Ince, R. Belen, Env. Sci. Techn., 35 (2001) 1885. [6] H. Guzman, D. Nguyen, S. Khan, M. Prausnitz, J. Acoust. Soc. Amer., 110 (2001) 588. [7] H. Guzman, D. Nguyen, S. Khan, M. Prausnitz, J. Acoust. Soc. Amer., 110 (2001) 597. [8] G. Scherba, R. Weigel, W. O’Brien, Appl. Environ. Micro., 57, 7 (1991) 2079. [9] E. Joyce, S. Phull, J. Lorimer, T. Mason, Ultra. Sonochem., 10 (2003) 315. [10] K. Jyoti, A. Pandit, Ultra. Sonochem., 10 (2003) 255. [11] G. Chahine, V. Johnson Jr., Intl. Symp. Jets and Cavities, ASME, WAM, Miami, FL, (1985). [12] S. Arrojo, Y. Benito, A. M. Tarifa, Ultra. Sonochem., 15 (2008), 903. [13] B. Balasundaram, S. Harrison, Biotechnol. Prog., 22, (2006) 907. [14] G. Chahine, K. Kalumuck, U.S. Patent 6,221,260, (2001). [15] G. Chahine, K. Kalumuck, U.S. Patent 6,200,486, (2001). [16] K. Suslick, ed., Ultrasound, Its Chemical, Physical, and Biological Effects, VCH, NY, (1988). [17] K. Suslick, Scientific American, 260 (1989) 80. [18] P. Gogate, I. Shirgaonkar, M. Sivakumar, P. Senthilkumar, N. Vichare, A. Pandit, AIChE J., 47 (2001), 2526. [19] E. Wuytack, A. Diles, C. Michiels, Inter. J. Food Micro., 77 (2002) 205. [20] M. Kelemen, J. Sharpe, J. Cell Sci., 35 (1979) 431. [21] P. Manas, B. Mackey, Appl. Environ. Micro., 70, 3 (2004) 1545. [22] L. Li, “Effects of Initial Microbial Density on Disinfection Efficiency in a Continuous Flow System and Validation of Disinfection Batch Kinetics in a Continuous Flow System”, Thesis, Drexel University, (2004). [23] A. Middleberg, B. O’Neill, Biotechnol. Prog., 9 (1993) 109. [24] P. Gogate, A. Pandit, AIChE J., 46 (2000) 1641. [25] K. Young, J. Bact., 178, 13, (1996) 3962. [26] K. Kalumuck, G. Chahine, C.-T. Hsiao, J.-K. Choi, 5th International Symposium on Cavitation, Osaka, Japan, Nov. (2003). [27] K. Kalumuck, G. Chahine, ASME J. Fluids Engr., 122 (2000) 465. [28] http://www.dynaflow-inc.com/ “Cavitating Jets” and “Oxidation/ Remediation/Disinfection” (2006). [29] T. Welch, A. Farewell, F. Neidhardt, D. Bartlett, J. Bacteriol., 175, 22 (1993) 7170. [30] R. Pagan, B. Mackey, Appl. Environ. Micro., 66, 7 (2000) 2829. [31] A. Eaton, L. Clesceri, A. Greenberg, Standard Methods for the Examination of Water and Wastewater, 19th Ed., 4500-Cl G, (1995). [32] L. Feril, T. Kondo, R. Ogawa, Q.-L. Zhao, Ultra. Sonochem., 10 (2003) 81. [33] S. Majumdar, P. S. Kumar, A. Pandit, Ultra. Sonochem., 5 (1998) 113. [34] K. Jyoti, A. Pandit, Water Res., 38 (2004), 2249.
21
Published in Ultrasonics and Sonochemistry 19, 710-717, April 2012 [35] M. Furuta, M. Yamaguchi, T. Tsukamoto, B. Yim, C. Stavarache, K. Hasiba, Y. Maeda, Ultra. Sonochem., 11 (2004) 57. [36] I. Hua, J. Thompson, Water Res., 34 (2000) 3888.
22


![summary - Road Map Project [PDF]](https://m.moam.info/img/260x300/summary-road-map-project-pdf_6479c3a8098a9e024f8b460e.jpg)

