bidity of known concentrations of water with SIL-CO-SIL-49, ball ... A predetermined amount of SIL-CO-SIL-49 was ..... University of Texas Press, Austin, 1995. 5.
Proposed Test Protocol for Evaluating Performance of Sediment Control Devices for Roadside Storm Water Runoff Jett McFalls, Aditya Raut Desai, Derrold Foster, and Ming-Han Li trations of sediment released from construction sites range from being 10 to 20 times higher than the concentrations released from agricultural lands and 1,000 to 2,000 times higher than the concentrations released from naturally forested land (3). Barrett et al. reported a fivefold increase in the suspended solids concentration (SSC) in a creek receiving water from an active construction site during and immediately after storm events (4). Therefore, a few hours of discharge from a construction site can contribute more sediment to streams and rivers in comparison with what can be deposited from other natural or anthropogenic sources over a much longer period of time. This accounts for a potentially large volume of sediment that could be carried off by storm water to the receiving water bodies. Several problems are associated with soil erosion. Erosion degrades the quality of the water in the receiving water bodies and causes other problems, such as sedimentation in streams. Sediment increases the turbidity of water, causing a nuisance to aquatic life while also affecting the aesthetics of the receiving water body. Furthermore, pollutants like heavy metals and hydrocarbons in runoff water partition onto the soil particles and are transported with the sediments to the receiving water bodies (5–7 ). Past studies have indicated that the effects downstream from construction activities are temporary and that the total SSC normalizes after construction activities have stopped (4). To mitigate the problems associated with sediment migration from construction sites to receiving bodies, it is imperative that proper erosion and sediment control measures be incorporated during the construction and postconstruction phases of projects until adequate protective vegetative cover has become reestablished at the disturbed site. The Texas DOT has defined critical performance factors for erosion control products and has established minimum performance standards that must be met for any product seeking to be approved for use as part of any of the construction or maintenance activities of the Texas DOT. The Texas DOT currently has a program in place to evaluate the performance of erosion control products through a series of controlled tests. The Texas DOT bases its approved product list on this documented field performance of the erosion control products. Performance data on erosion control materials are readily available. However, information on the performance of sediment control best management practices (BMPs) is limited. Most designers and engineers are left with no informational options other than manufacturers’ claims or simple field observations. Establishment and classification of available sediment retention device (SRD) BMPs based on their measured performance would assist the designers and engineers with selecting the appropriate product and methods for sitespecific application. The standard presented in this report is similar to that described by ASTM (ASTM D6459).
This paper details an official testing program developed by researchers at the Texas Transportation Institute (TTI) to classify sediment retention devices on the basis of their sediment removal performance. The testing facility designed as part of this study was constructed at the Texas Department of Transportation–TTI Hydraulics, Sedimentation, and Erosion Control Laboratory (HSECL) located at the Texas A&M University Riverside Campus. The facility consists of a parabola-shaped testing channel 4.6 m (15 ft) wide and 5.5 m (18 ft) long with a maximum depth of 0.8 m (2.5 ft) at the center and a slope of 3%. Two commercially available artificial sediments were mixed in equal proportions to create the artificial storm water for testing. The flow rate and turbidity of the water entering and leaving the channel were monitored for the duration of the test. The turbidity measurements were converted to suspended solid concentration by using a relationship developed in the HSECL laboratory. A simple mass balance calculation was used to determine the amount of sediment trapped in the channel.
Transportation construction activities such as the building of highways, streets, and bridges in the United States represent approximately 7% ($83 billion) of the total amount of dollars spent annually by the construction industry (1). In Texas, the Texas Department of Transportation is responsible for the construction and maintenance of the 80,000-mi network of state roadways. Construction activities associated with highway projects involve heavy earthmoving operations that disturb several square miles of undisturbed land areas. In 2007 alone, the Texas DOT reported 1,541 active construction contracts throughout Texas that resulted in significant areas of topsoil disturbance. The most detrimental environmental impact of highway construction and maintenance results from erosion of the exposed topsoil during storm events. Although erosion is a naturally occurring phenomenon, construction activities disturb the natural vegetative cover, causing the erosion processes at such sites to proceed at a significantly higher rate than the natural erosion rate. Landphair and colleagues reported that erosion from construction sites in the United States deposits approximately 3.5 billion metric tons of sediment into streams and rivers annually (2). The concenJ. McFalls and D. Foster, Texas Transportation Institute, 3135 TAMU; A. R. Desai, Department of Civil Engineering, 3136 TAMU; and M.-H. Li, Department of Landscape Architecture and Urban Planning, 3137 TAMU, Texas A&M University, College Station, TX 77843. Corresponding author: J. McFalls, j-mcfalls@ttimail. tamu.edu. Transportation Research Record: Journal of the Transportation Research Board, No. 2170, Transportation Research Board of the National Academies, Washington, D.C., 2010, pp. 74–83. DOI: 10.3141/2170-09
74
McFalls, Desai, Foster, and Li
75
DESCRIPTION OF TESTING FACILITY Researchers conceptualized several designs for the testing facility on the basis of the protocol available at the time. The current design was selected from these designs. The testing facility is composed of the following five distinct elements: • • • • •
Mixing tank, Sediment delivery system, Testing channel, Sediment collection system, and Monitoring system.
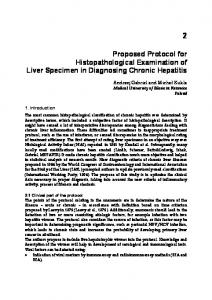
Mixing Tank To mix and deliver the sediment into the test channel, a 1,600-gal polypropylene cylindrical tank with a conical hopper bottom with a 6-in. butterfly valve is used. A three-phase electric motor and double mixing paddles ensure proper mixing of the sediment-laden test water. Figure 1 shows the mixing tank with the motor at its present location in the testing facility.
Sediment Delivery System The sediment delivery system is an assembly of 6-in.-diameter pipes used to convey sediment from the mixing tank to the testing channel. Figures 2a and 2b show the two locations in the sediment delivery system where ports for measuring the turbidity and flow rate of the sediment-laden water entering the testing channel are provided.
• Retention zone, • Installation zone, and • Collection zone. The retention zone is 3.7 m (12 ft) long. The sediment-laden water entering the channel is retained behind the SRD in this zone, which allows the sediment to settle out of the water. The installation zone is a 4-ft opening between the retention zone and the collection zone with metal sliding gates on either side. The installation zone can be filled with any type of test soil. The proposed soil for testing SRDs is a clay with a high plasticity index. The surface of the clay in the installation zone was shaped to match the profile of the channel. The installation zone serves as a region for installing the SRD to be tested according to the specifications of each manufacturer. The collection zone is a concrete section 0.6 m (2 ft) long at the downstream end of the testing channel, where the water passing through the SRD could be directed into the collection zone. The sediment collection system is attached to the end of the collection zone.
Sediment Collection System The sediment collection system consists of an aluminum tray attached to the collection zone that channeled the water, which leaves the testing channel and enters a series of 6-in.-diameter pipes (Figure 4a). Two ports in the sediment collection system provide access for measuring the turbidity and flow rate of the sediment-laden water entering the testing channel (Figure 4b). The water leaving the testing channel passes through the sediment collection system and is discharged into a nearby pond after the turbidity and flow rate within the sediment collection system are measured.
Testing Channel Monitoring System The testing channel is a parabola-shaped, concrete conduit 4.6 m (15 ft) wide and 5.5 m (18 ft) long with a maximum depth of 0.8 m (2.5 ft) at the center and with a constant slope of 3%. The testing channel is made up of three distinct zones (Figure 3):
Two turbidity probes connected to a single controller system and two flowmeters are used to monitor the turbidity and flow rate, respectively.
3-phase motor
Mixing tank
6-inch butterfly valve Sediment delivery system FIGURE 1 Polypropylene tank used to mix sediment and create a slurry of known SSC.
76
Transportation Research Record 2170
6-inch butterfly valve
Port for turbidity probe
(a)
Port for bubbler tube
(b)
FIGURE 3
Testing channel from SRD evaluation.
Back wall
Sliding doors
Retention zone
Installation zone
Collection zone
FIGURE 2 Sediment delivery system from mixing tank to testing channel: (a) port for turbidity probe and (b) port for bubbler tube.
McFalls, Desai, Foster, and Li
77
Collection tray
Port for turbidity probe
(a)
Port for bubbler tube
(b) FIGURE 4 Sediment collection system from testing channel: (a) collection tray and port for turbidity probe and (b) port for bubbler tube.
Turbidity Meter Two turbidity sensors installed at the inlet and outlet continuously measure (at 5-s intervals) and record the turbidity of the water entering and leaving the channel. Both sensors are connected to a controller system. Computer software facilitates the retrieval of the turbidity data, which go from the controller system to a field laptop.
Flowmeter Two bubbler flowmeters are used to monitor the flow at the inlet and the outlet of the channel. TESTING FACILITY CALIBRATION Before SRDs were tested in the testing facility, the researchers characterized the channel and sediment and calibrated the measuring instruments. Channel The researchers studied the geometry of the channel to determine the relationship between ponding depth and factors that would help quan-
tify the performance of the SRDs tested in the channel (Figure 5). The particle size distribution of sediment was determined on the basis of the information provided by the manufacturers. The flowmeters and turbidity meters were calibrated to determine their ability to measure accurately the flow rate and turbidity, respectively. The testing channel has a known geometry for which the ponding volume can be determined from the ponding depth. The test channel designed as a longitudinal section of a cylinder 25 ft (300 in.) in diameter (D) inclined at a 3% slope (φ = 1.72 degrees). The x-, y-, and z-axes are aligned with the cylinder, and the z-axis runs longitudinal to the cylinder. The length of the channel (L) can range from 12 to 16 ft (or 144 to 192 in.), depending on the location of the SRD within the installation zone. The liquid in the cylinder is the volume bounded by four surfaces: the liquid surface, the cylinder wall, the bottom end of the cylinder, and the top end of the cylinder. The relationship between the SRD height and the ponding volume for the testing channel used to evaluate SRDs in this study was determined mathematically by solving Equation 1. The results are indicated in Figure 6.
υ=
∫
r 2r ⎛ ⎞ −H ⎟ ⎜ r cos φ ⎟ tan φ −⎜ S + − tan φ sin φ ⎟ ⎜ ⎜⎝ ⎟⎠
∫
r 2 − y2 − r 2 − y2
∫
2r −H y r cos φ +S+ − tan φ tan φ sin φ 0
dxdydz
(1)
78
Transportation Research Record 2170
Sediment The particle size distributions of four different silica sediment combinations, as provided by the manufacturer, are shown in Figure 8. After the particle size distribution of each of the silica sands was examined and laboratory standardization tests of the turbidity probes were performed with each of the silica grades, it was determined that the SIL-CO-SIL-49 product (where 49 indicates that 99% of the particles are less than 49 µm) was the most accurate, potential sediment to be used for testing. Because of the need to mix the silica with ball clay, a 50:50 mixture (by weight) of SIL-CO-SIL-49 and ball clay was also examined as a potential sediment to be used for testing.
Monitoring Equipment The turbidity meters and probes were calibrated to determine the abilities of these instruments to measure accurately the turbidity and flow rate, respectively. FIGURE 5 Testing channel designed as longitudinal section of inclined cylinder.
where υ y r φ S
= = = = =
ponding volume, coordinates along y-axis, as shown in Figure 5 (in.), radius of the cylinder (in.), slope of the channel (radians), distance along channel bottom from SRD to depth measurement location (in.), and H = ponding depth measured at a distance S from the SRD (in.). Ponding Volume Ponding volume is the volume of water retained behind an SRD and is a function of the ponding depth at any given time. Figure 7 shows the water retained behind SRDs of five different ponding depths.
Turbidity Meter The turbidity meters and probes were calibrated by measuring the turbidity of known concentrations of water with SIL-CO-SIL-49, ball clay, and a 50:50 mixture (by weight) of SIL-CO-SIL 49 and ball clay. A 2-ft-long section of a 6-in.-diameter PVC pipe was cut, and the ends of the pipe were capped to form a watertight chamber. A hole in which to insert the turbidity probe was drilled 1 ft from either end of this chamber. A predetermined amount of SIL-CO-SIL-49 was weighed and mixed thoroughly with 2 L of water to prepare artificial sediment-laden water with a known SSC. This artificial sedimentladen water was poured into this chamber and the turbidity was measured by using both of the probes. The turbidity was measured for SSCs ranging from 0 to 5,000 mg/L or until the measurement limit of the turbidity probes was exceeded. This process was repeated by using ball clay and a 50:50 mixture (by weight) of SIL-CO-SIL-49 and ball clay.
FIGURE 6 Relationship between ponding depth and ponding volume for different lengths of channel.
McFalls, Desai, Foster, and Li
FIGURE 7
79
Water ponding behind SRD set up in center of installation zone at various depths.
After the turbidity meters were calibrated in the laboratory, multiple test runs were conducted in the SRD testing facility with actual sediment retention devices to further evaluate the effectiveness and accuracy of these instruments.
of flow, and the flowmeters were calibrated for both total flow volume accuracy and instantaneous flow accuracy. These runs were conducted multiple times to ensure the accuracy and repeatability of the ISCO flowmeters.
Flowmeters
TESTING PROTOCOL DEVELOPMENT
The flowmeters were calibrated by conducting runs with clear water in the sediment retention device facility. The sediment mixing tank was filled with a known volume of water, and the flowmeters were inserted into their ports in the inlet and outlet pipes, respectively. The water was then released from the mixing tank at a known rate
Effect of Testing Conditions on Performance of SRDs
FIGURE 8
Calibration tests were conducted with various SRDs to determine the effects of sediment type, the initial sediment concentration,
Particle size distribution of silica examined for use as sediment in testing.
80
Transportation Research Record 2170
and overtopping on removal efficiency. For the initial runs, a geosynthetic dike was used as the sediment retention device. The type of device used during these initial experiments was not critical, as the experiments were conducted simply to evaluate the effects that various testing conditions had on performance. A geosynthetic dike was chosen simply to evaluate the performance of one type of SRD.
with and without overtopping to determine the effect of the initial SSC on the removal efficiency of the SRD. Figure 10 illustrates that the removal efficiency of the geosynthetic dike increased when the SSC in the runoff to be treated was doubled from 2,000 to 4,000 mg/L.
Effect of Overtopping Effect of Sediment Type Researchers conducted tests with three types of sediments: 1. Silica sediment (SIL-CO-SIL-49), 2. Ball clay sediment, and 3. A 50:50 mixture (by weight) of silica and ball clay sediment. The runoff slurry used in this experiment had an inlet SSC of 2,000 mg/L. Figure 9 shows that the removal efficiency of the SRD was the highest for the silica sediment and the lowest for the ball clay sediment. The 50:50 mixture (by weight) of the silica and the ball clay sediment results in a sediment removal efficiency between that for the silica and ball clay sediment. Silica particles are larger than clay particles and thus settle faster. Because of their composition, many SRDs target these large particles. However, many SRDs use flocculants and are designed to remove finer clay particles that have a surface electrostatic charge. The researchers decided that because of the many variations in sediment retention devices, a sediment mixture prepared by combining silica and ball clay would be the best option for evaluating and comparing the performance characteristics of all SRDs.
Overtopping can cause water to leave the site without getting treated. The researchers conducted experiments using silica sediment (SIL-CO-SIL-49) on an SRD (geosynthetic dike). The overtopping experiments delivered 1,500 gal of sediment-laden water into the channel. The experiments with no overtopping delivered sediment-laden water into the channel until overtopping was observed. Once overtopping was observed, the delivery of sediment-laden water into the channel was stopped. Figure 11 shows that the removal efficiency increased when water was not allowed to overtop the SRD (geosynthetic dike).
SRD TESTING After examination of the effects of various sediment concentrations and the results of overtopping tests versus those of nonovertopping tests, the researchers decided to conduct comparative testing with five different types of SRDs. These SRDs were not tested to evaluate their individual sediment retention effectiveness but were tested to evaluate the testing protocol itself. Geosynthetic dikes, untreated wattles, wattles treated with flocculants, silt fences, and rock check dams were evaluated during these test runs.
Effect of Sediment Concentration
Ponding Volume
The SSC in the runoff to be treated affects the removal efficiency of the SRD. The researchers tested two concentrations of silica sediment
Figure 12 shows that the geosynthetic dike and wattles (untreated and treated) retained water in amounts equal to their design capacities,
FIGURE 9 Removal efficiency measured using geosynthetic dikes for three sediment types (suspended sediment concentration ⴝ 2,000 mg/L); SIL-CO-SIL-49, SIL-CO-SIL-49 plus ball clay, and ball clay.
McFalls, Desai, Foster, and Li
81
FIGURE 10 Removal efficiency measured using geosynthetic dikes for SIL-CO-SIL-49 (overtopping and no overtopping) at 2,000 and 4,000 mg/L.
whereas the silt fence and rock check dam did not retain amounts of water equal to their design capacities. Both the silt fence and the rock check dam had very high design capacities and flow-through rates, which resulted in a volume of sediment-laden water less than the design capacity being retained behind these SRDs.
RECOMMENDATIONS FOR TEST PROTOCOL On the basis of the test results from 2008 and 2009 discussed above, Texas Transportation Institute (TTI) researchers have developed a protocol for evaluation for SRDs. This protocol is designed to test the many various types of SRDs available to the Texas DOT construction and maintenance divisions effectively, consistently, and fairly.
Sediment Removal Efficiency Table 1 indicates the sediment removal efficiency of the five SRDs tested during calibration of the facility. This removal efficiency percentage is representative of the performance results of the proposed tests.
1. Preparing the channel. The testing channel shall be cleaned and the soil in the installation zone shall be resurfaced to match the channel profile. 2. Installing the SRD. The SRD shall be installed in the installation zone according to the manufacturer’s instructions. Note that in the
FIGURE 11 Removal efficiency measured using geosynthetic dikes for SIL-CO-SIL-49 (suspended sediment concentration ⴝ 2,000 and 4,000 mg/L) under two conditions: overtopping and no overtopping.
82
Transportation Research Record 2170
FIGURE 12 Design capacity and ponding volume for five SRDs. Values below the name of SRD indicate total volume of sediment-laden water treated.
absence of specific instructions from the manufacturer, SRD installation shall be carried out according to the discretion of the technicians. The installation details, such as the number of stakes, the spacing between stakes, the presence or absence of an apron, the trenching depth, and the height of SRD after installation shall be recorded. 3. Testing. – Instrumentation. The turbidity probes and bubbler tubes shall be connected to the appropriate locations at the inlet and the outlet. Technicians shall ensure that the flowmeters and turbidity meter are recording data correctly. Note that while the turbidity probes and bubbler tubes are being connected, special attention shall be directed to ensuring that the locations are dirt free.
TABLE 1 Removal of Sediment by Five SRDs Tested at the Channel Sediment Control Device
Mass In kg (lb)
Mass Out kg (lb)
Removal Efficiency (%)
Geosynthetic dike
2.8 (6.1) 3.3 (7.2) 3.3 (7.2) 0.58 (1.3) 0.65 (1.4) 0.71 (1.6) 0.67 (1.47) 0.70 (1.54) 1.47 (1.47) 14.3 (31.4) 14.3 (31.6) 13.7 (30.1) 12.7 (28.0) 12.5 (27.6) 12.9 (28.4)
2.2 (4.8) 2.7 (6.0) 2.7 (6.0) 0.31 (0.69) 0.36 (0.79) 0.39 (0.85) 0.24 (0.54) 0.28 (0.61) 0.30 (0.67) 12.2 (26.9) 12.7 (28.0) 11.5 (25.3) 12.4 (27.3) 12.2 (27.0) 12.7 (27.9)
20 16 17 46 45 46 63 61 54 14 11 16 2 2 2
Wattle: untreated
Wattle: treated
Silt fence
Rock check dam
– Test to determine SRD flow-through characteristics. The test is optional if the manufacturer can provide TTI staff with the established flow-through rate(s) of the product. • Sediment preparation. No sediment shall be added to the 1,500 gal of water in the mixing during this process. • Testing flow. Water shall be released into the channel at a flow rate of ∼60 gal/min by controlling the butterfly valve on the mixing tank. The valve shall be closed and the flow of water into the channel shall be stopped when water begins to overtop the SRD. The maximum flow rate at the outlet shall be recorded and the inflow rate to be applied during performance testing on the SRD shall be determined. For example, if the maximum flow rate observed at the outlet is 15 gal/min, the SRD falls in the flow category of 10 to 20 gal/min and a maximum inflow rate of 20 gal/min will be applied during performance testing of the SRD. – Performance testing of SRD. Three repetitions of the performance test will be conducted on the SRD before it is removed from the installation zone. • Sediment preparation. A total of 12.5 lb of SIL-CO-SIL-49 and 12.5 lb of ball clay shall be mixed in 1,500 gal of water to create sediment-laden water with an SSC of 2,000 mg/L. The sediment-laden water shall be kept stirred in the mixing tank until the test has ended. • Testing flow. Water shall be released into the channel at a flow rate defined by the SRD flow category by controlling the butterfly valve on the mixing tank. The entire 1,500 gal of sediment-laden water shall be emptied into the channel. The test will continue until no water is retained behind the SRD. – Data processing. Data from the flowmeter and turbidity meter shall be downloaded to the field laptop. All relevant calculations will be performed using the Excel spreadsheet program. 4. Data recording. The following data will be reported to the Texas DOT following each product evaluation: – Product installation details, – Flowthrough rate (ft3/s),
McFalls, Desai, Foster, and Li
– Maximum flow rate (gal/min), – Ponding volume (gal), – Turbidity (nephelometric turbidity unit) at inlet and outlet, – SSC (mg/L) at inlet and outlet, – Mass loading (lb), and – Removal efficiency (%).
CONCLUSIONS The test protocol proposed here is capable of quantifying the sediment removal performance of SRDs with reasonable accuracy. It is expected that SRDs will soon be scrutinized for their effectiveness in retaining sediments. The availability of this protocol is timely, and the protocol should contribute significantly to the transportation and construction fields.
ACKNOWLEDGMENT This study was sponsored by the Texas Department of Transportation Research and Technology Implementation Office under the Roadside Sediment Control Device Evaluation Program.
83
REFERENCES 1. U.S. Census Bureau. 2002 Economic Census: Schedules of Industry Schedule Series, 2002. http://www.census.gov/econ/census02/. Accessed June 10, 2006. 2. Landphair, H. C., J. R. Schutt, B. E. Peterson, and M. Li. Alternatives to Silt Fence for Temporary Sediment Control at Highway Construction Sites: Guidelines for TxDOT. Technical Report 0-1737-S. Texas Transportation Institute, College Station, 1997. 3. Storm Water Phase II Final Rule: Construction Site Runoff Control Minimum Control Measure. Report EPA 833/F-00/008. Office of Water, U.S. Environmental Protection Agency, Washington, D.C., 2000. 4. Barrett, M. E., J. F. Malina, Jr., R. J. Charbeneau, and G. H. Ward. Water Quality and Quantity Impacts of Highway Construction and Operation: Summary and Conclusions. Center for Research in Water Resources Technical Report 266. University of Texas Press, Austin, 1995. 5. Viklander, M. Particle Size Distribution and Metal Content in Street Sediments. Journal of Environmental Engineering, Vol. 124, No. 8, 1998, pp. 761–766. 6. Liebens, J. Heavy Metal Contamination of Sediments in Stormwater Management Systems: The Effect of Land Use, Particle Size, and Age. Environmental Geology, Vol. 41, No. 3–4, 2001, pp. 341–351. 7. Lee, J. H., K. W. Bang, L. H. Ketchum, J. S. Chloe, and M. J. Yu. First Flush Analysis of Urban Storm Runoff. Science of the Total Environment, Vol. 293, No. 1–3, 2002, pp. 163–175. The Physicochemical and Biological Processes in Soils Committee peer-reviewed this paper.