The feasibility of using PET for proton dose monitoring is examined here in detail. ... The main advantage of proton therapy over conventional radiotherapy with ...
Phys. Med. Biol. 41 (1996) 177–196. Printed in the UK
Proton dose monitoring with PET: quantitative studies in Lucite U Oelfke†‡, G K Y Lam†§ and M S Atkins†k † TRIUMF, Batho Biomedical Facility, 4004 Wesbrook Mall, Vancouver, BC, Canada V6T 2A3 ‡ British Columbia Cancer Agency, Department of Developmental Radiotherapy, Vancouver, BC, Canada § British Columbia Cancer Agency, Department of Clinical Physics, Vancouver, BC, Canada k Simon Fraser University, Department of Computer Science, Burnaby, BC, Canada Received 29 June 1995
Abstract. The feasibility of using PET for proton dose monitoring is examined here in detail. First experimental studies in a Lucite phantom have been performed at the medical TRIUMF proton beamline for proton energies of 62 MeV and 110 MeV. The proton dose delivered to the phantom ranged from 16 Gy up to 317 Gy. The induced activity was analysed 20–40 min after the irradiation with a PET scanner. The obtained depth activity profiles were compared to our calculation based on a model using available isotope production cross-section data. Both the observed absolute count rates and the activity profiles were found to agree very well with this model. Effects such as proton range straggling, inelastic nuclear interactions and the energy spectrum of the emitted positrons were studied in detail and found to change the activities by 5–10%. The lateral deposition of dose in the phantom could be very well localized by the induced activity. However, the spatial correlation between dose depth profiles and depth activity profiles was found to be poor, hence the extraction of isodose profiles from activity profiles seems to be very difficult.
1. Introduction The main advantage of proton therapy over conventional radiotherapy with x-rays or electrons is its capability to deliver dose very selectively to a defined target volume while sparing most of the surrounding healthy tissue from radiation damage. This very precise form of radiotherapy necessarily involves extremely steep dose gradients at the target boundaries, so accurate target alignment during proton therapy treatment is crucial. Hence there is a need for tools such as in vivo dose localization techniques to verify a proton treatment plan and to ensure the high quality of proton radiotherapy. The visualization of induced activity patterns with a PET camera in radiotherapy has been described in previous papers for other radiation beams, i.e. for pion therapy (Goodman et al 1986, Shirato et al 1989), neutron therapy (Vynckier et al 1989, Klerck et al 1988) and heavy-ion therapy (Enghardt et al 1992, Tomitami et al 1993). Recently, various groups (Vynckier et al 1993, Paans and Schippers 1993, Litzenberg et al 1992) have started to investigate the use of PET techniques for in vivo dose monitoring of proton dose profiles. However, these investigations conclude that far more detailed studies are needed to evaluate the final clinical usefulness of this new dosimetry concept. Our presented study aims to serve this purpose. c 1996 IOP Publishing Ltd 0031-9155/96/010177+20$19.50
177
178
U Oelfke et al
During a proton treatment, a small fraction of protons—usually less than 0.5% for the conventionally employed therapeutic energies—activates positron emitting isotopes I , e.g. 11 C, 13 N and 15 O. The most relevant activation reactions and their characteristics, including the energy thresholds ET I for the activation process, the isotope decay constant λI and the maximal kinetic energies Eemax + (I ) of the emitted positrons are listed in table 1. The decay of the isotopes, or more precisely the recombination of the emitted positrons with an electron of the surrounding tissue, can be observed with a PET camera. The PET scanning of the induced activity can be performed either ‘on line’, i.e., during the actual irradiation with protons, or ‘off line’, i.e., a certain time after the treatment is completed. The ‘on line’ technique is attractive, because it potentially allows an immediate correction for any misalignment of the target volume by comparing expected and measured activities; however it requires a very fast processing of the measured data. The ‘off line’ technique allows analysis of the activity patterns in more detail, e.g. dynamic scans to identify a certain isotope can be performed. Table 1. Isotope production processes. Activation process
ET I (MeV)
λI (min−1 )
Eemax + (I ) (MeV)
p + 16 O → 15 O + (p, n) p + 16 O → 13 N + α, 2(p, n) p + 16 O → 11 C + 3(p, n) p + 14 N → 13 N + (p, n) p + 14 N → 11 C + α, 2(p, n) p + 12 C → 11 C + (p, n)
16.6 5.5 14.3 11.2 3.1 20.1
0.3414 0.0695 0.0340 0.0695 0.0340 0.0340
1.73 1.19 0.96 1.19 0.96 0.96
In our study, we focus on the ‘off line’ analysis of PET activity profiles and its spatial correlation to dose, especially for the case of dose depth profiles. The rest of the paper is organized as follows. Section 2 describes our experimental set-up and the process of data collection and analysis. In section 3 we provide the framework of our model calculations. Our analysis of the proton induced activity profiles, their correlation to dose and the comparison to our model are described in section 4. Various sensitivities of the model, e.g. the dependence of the activity patterns on details of the proton flux, are studied. Finally, the impact of our study on the feasibility of proton dose monitoring with the help of a PET camera is discussed in section 5. 2. Materials and methods A Lucite phantom was activated with 62 MeV or 110 MeV protons at the TRIUMF medical beamline 2C and then transported to a CTI/Siemens ECAT 953b PET scanner at the hospital of the University of British Columbia nearby. Scanning of the induced activity started about 20–40 min after the irradiation. Five different sets of data were taken. In the first four scans the activity signal for a dose profile of a raw Bragg peak (RBP) of 110 MeV and 62 MeV protons was recorded; in the fifth scan we analysed the activity pattern induced by a spread out Bragg peak (SOBP) of 2 cm plateau width with 62 MeV protons to compare with the activity induced by a raw Bragg peak. Lucite was chosen as phantom material because its nuclear composition (C5 H8 O2 ) together with our ‘off line’ scanning technique guarantees a strong and almost clean activity signal from the activation process 12 C(p, pn)11 C. The corresponding activation cross-section is well known experimentally and clearly dominates the much smaller isotope production
Proton dose monitoring with PET
179
of 11 C and 13 N from 16 O (Landolt–B¨ornstein 1973). Furthermore, our experiment is not sensitive to the strong 15 O activity signal arising from the process 16 O(p, pn)15 O because most of the produced 15 O isotopes, with a half-life of 2.02 min, decay during the transport of the Lucite phantom to the PET scanner. The choice of Lucite as a phantom material therefore yields an activity signal whose analysis and comparison to model calculations is not afflicted by insufficient or poor data for the isotope production mechanism. Clearly Lucite cannot serve as a tissue equivalent probe; however, it can serve well to study the general mechanism of proton dose monitoring with PET techniques. For the irradiations a proton current ranging between 0.5 nA and 5 nA was extracted from the cyclotron. The phantom, a Lucite cylinder of 19.4 cm diameter and 21.5 cm length placed 10 cm downstream from the final collimator was irradiated with a uniform lateral beam profile of 20 mm or 30 mm in diameter. The irradiation time varied between 3 and 26 min, and an estimated total dose from 16 Gy up to 317 Gy was delivered to the phantom. The proton ranges in Lucite for the two selected energies of 62 and 110 MeV are approximately 2.9 and 8.0 cm, respectively. Table 2 summarizes the irradiation parameters of our experiments, i.e., the proton energy E0 , the proton flux 8, the irradiation time tR and the estimated total dose delivered to the phantom.
Table 2. Irradiation parameters. Scan No
Energy (MeV)
Flux 8 (cm2 s)−1 × 10⁸
tR (min)
Dose (Gy)
Bragg peak
1 2 3 4 5
110 110 110 62 62
0.48 0.22 1.1 0.20 0.17
3 22 26 23 23
16 53 317 81 67
RBP RBP RBP RBP SOBP
The total activity induced in the Lucite phantom right after the beam was turned off was estimated to range between 5.9 MBq and 0.2 MBq. The estimate of the induced activity per volume only takes into account the main activation of 11 C from 12 C. More detailed information about our estimates of induced activities can be found in appendix A. After a time delay of 20–40 min, the phantom was scanned with a CTI/Siemens ECAT 953b PET scanner. This scanner analyses an axial field of view of 10.4 cm in depth so we obtain 31 lateral activity profiles, each separated by a depth of 3.375 mm. For the irradiations with 110 MeV protons we positioned the phantom so that its beam entry surface coincides with the first imaging plane of the scanner. For the activations with 62 MeV protons the phantom is shifted 1.5 cm further inside the axial field of view of the scanner so that we can monitor closely the activity build up at the phantom entrance. All scans were performed in the twodimensional (2D) data acquisition mode. This scanning mode was preferred over the also available three-dimensional (3D) data acquisition because the well established normalization and calibration procedure of the scanner in 2D mode allows a more reliable determination of absolute activities. The sensitivity of the scanner was determined to 154 000 counts s−1 (µCi ml−1 )−1 . The overall scan time varied between 15 min and 1 h. For the first three scans, i.e. for activations with 110 MeV protons, the procedure of dynamic scanning was used in order to identify the activity contributions due to different isotopes. The scan conditions, including the time delay ttrans between irradiation and scanning, are provided in table 3.
180
U Oelfke et al Table 3. Scan parameters. Scan No
ttrans (min)
PET scan
Frames × min
1 2 3 4 5
30 24 24 40 25
Dynamic Dynamic Dynamic Static Static
30 × 2 15 × 2 15 × 1 1 × 30 1 × 30
3. Model calculations of the induced activity A phenomenological model for the proton flux together with isotope production cross-section data is used to predict the proton induced activity for a homogeneous medium. In this section we describe the basic features of our model calculations. First, in subsection 3.1, we give a general description of the model including its three main components: (i) the production of positron emitting isotopes through proton irradiations, (ii) the subsequent isotope decay and (iii) the detection of the corresponding activity with a PET camera. Then, in subsection 3.2, we describe in detail our calculations of the one-dimensional (1D) activity profiles presented in section 4. 3.1. The calculation of spatial activity profiles In the isotope production process a target volume composed of different target nuclei A Z NT is irradiated for a time tR with a beam of monoenergetic protons of energy E0 . The A0 probability of an activation of the nucleus A Z NT to a positron emitting isotope Z 0 NI is given by the isotope production cross-sections σT I (E). The cross-sections σT I are a function of the kinetic energy E of the protons inside the medium. Each specific activation process only occurs for energies E smaller than a certain threshold energy ET I . Usually, the relevant threshold energies for proton induced activations in tissue are of the order of 5–20 MeV, so that the range of the induced activity always will turn out to be smaller than the actual proton range in the medium. The produced activity per volume aIE0 at a point r is proportional to the proton flux 8E0 (r), the isotope production cross-section σT I and the density ρT (r) of E0 E0 target nuclei A Z NT inside the medium, i.e., aI (r) ∝ 8 (r)ρT (r)σT I (E(r)). For the time dependence of the induced activity profiles aI (r, t) the loss of isotopes due to decay has to be taken into account in addition to the production rate. The decay of A0 + Z 0 NI into a positron e , a neutrino νe and a residual nucleus is characterized by its decay constant λI . Taking into account that a specific isotope I can be produced from different target nuclei, the activity profile aIE0 (r, t) takes the form ( X (1 − e−λI t ) if t 6 tR E0 E0 (3.1) ρT (r)8 (r, t)σT I (E(r)) aI (r, t) = if t > tR . (1 − e−λI tR ) e−λI (t−tR ) T In (3.1) it is assumed that neither the target nuclei nor the activated isotopes are able to move within the medium, so for example blood flow effects in tissue as studied by Okunieff et al (1992) cannot be analysed with (3.1). The two different time dependences in (3.1), t 6 tR and t > tR , correspond to an observation time t during and after the irradiation process, i.e. they refer to an on line or off line monitoring technique. So far, we have calculated the proton induced activity distribution arising from a specific 0 positron emitting isotope A Z 0 NI . A PET camera, however, detects the characteristic γ -ray
Proton dose monitoring with PET
181
pair emerging from the annihilation point of the emitted positron. This indirect detection technique does not allow identification of a specific isotope; i.e., a PET camera is an ‘isotope blind’ detector which simultaneously registers the total activity of all β + decaying isotopes. Moreover, one has to be aware that a PET camera does not locate the primary activation event. The range spectrum of the emitted positrons causes a small displacement between the location of the isotope activation and the positron annihilation. This effect, together with the spatial resolution of the PET camera itself, determines the spatial accuracy and precision of the detected activity profiles. The activity pattern obtained from a PET scan is consequently given as the sum of activity profiles (3.1), convoluted with a spatial distribution ReI+ (r −r 0 ), i.e., XZ E0 (3.2) dr 0 aIE0 (r 0 , t)ReI+ (|r − r 0 |) aP ET (r, t) = I
ReI+ (|r
0
where − r |) accounts for the kinetic energy spectrum of the emitted positrons and the spatial resolution of the PET camera. Finally, we generalize the result of (3.2), which was derived for a beam of monoenergetic protons, to a beam characterized by an energy spectrum ρen (E), i.e., Z aP ET (r, t) = dEρen (E)aPEET (r, t). (3.3) The activity pattern described by (3.1)–(3.3) shows a complex dependence on r and t which usually cannot be decoupled. Time independent spatial profiles of relative activity will be obtained for the special case where only one specific isotope has been activated, but, even for this simplified case, the prediction of the spatial activity distribution requires prior knowledge of various input data, e.g., data for the isotope production cross-sections σT I . Furthermore, the prediction of the activity crucially depends on a reliable model for the proton flux 8E0 (r) inside the medium. In order to simplify our calculations, we will consider next the special case of 1D depth activity profiles. 3.2. Model calculations of depth activity profiles The study of 1D depth activity profiles simplifies the calculation of the activity pattern significantly, specifically because a phenomenological parametrization for the proton flux can be employed (Janni 1982). This reduction of the 3D profiles in subsection 3.1 will somewhat constrain the validity of our study, e.g., we cannot account for beam divergence effects or lateral phantom inhomogeneities. However, because we are analysing induced activity patterns for a homogeneous medium, we consider the analysis of depth activity profiles as a valuable initial test of proton dose monitoring with PET techniques. In what follows all effects that change the lateral proton flux with increasing depth z will be neglected, i.e., we assume 8E0 (r) = 8E0 (z). Therefore, neither the usual beam divergence nor the effect of lateral proton scattering are considered and lateral density variations in the target volume are ignored. Hence, the density of the different target nuclei is assumed to be of the form ρT (r) = ρT (z). With these assumptions we obtain the 1D depth activity profiles aIE0 (z, t), a simplified version of (3.1) ( X (1 − e−λI t ) if t 6 tR E0 E0 ρT (z)8 (z)σT I (E(z)) (3.4) aI (z, t) = −λI tR −λI (t−tR ) (1 − e )e if t > tR . T In (3.4) E(z) is the average kinetic energy of a proton at a penetration depth z. This is determined in the CSDA approximation from the proton stopping power Sm of the target
182
U Oelfke et al
medium z=
1 ρm (z)
Z
E
E0
dE 0
1 . Sm (E 0 )
(3.5)
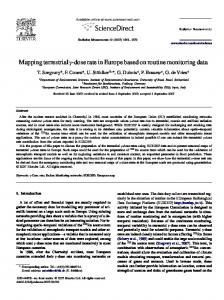
The evaluation of experimental induced activity profiles with the help of (3.4), (3.5) and (3.3) requires four basic sets of input data: (i) a phenomenological parametrization of the proton flux 8E0 (z) inside the target medium; (ii) cross-section data σT I for the relevant isotope activation processes; (iii) a parametrization of the initial energy spectrum ρen (E) for the proton beam; and (iv) a parametrization of the spatial distribution ReI+ . The parametrization of the proton flux 8(E(z)) we use is based on the phenomenological model given by Janni (1982) . It includes the effect of range straggling and accounts for the loss of protons due to inelastic nuclear interactions. A brief description of this model and its application for the calculation of depth activity profiles is given in appendix B. The isotope production cross-sections σT I were obtained from Landolt–B¨ornstein (1973) and are shown in figure 1. For the proton activation of Lucite (C5 H8 O2 ) only the three most significant activation processes were taken into account, the dominant 11 C production through neutron knockout from 12 C and the activation of 16 O to either 11 C or 13 N. Although there is initially a considerable activation of the short-lived isotope 15 O from 16 O, we do not include this activation process in our calculation because almost all of the short-lived 15 O isotopes had already decayed before we began scanning. The energy spectra of the initial proton beams for E0 = 62 MeV and E0 = 110 MeV are approximated by Gaussians, whose widths (standard deviation) σE0 are fitted to reproduce the depth dose profiles measured on the central beam axis in water. For the corresponding fits, we first calculate the depth dose curves for monoenergetic protons by using the model in appendix B for the proton flux and the stopping power data of Janni (1982). The resulting raw Bragg curves are then convoluted with a Gaussian spectrum, whose width was adjusted to fit the experimental depth dose curves. The best fit for the two proton energies used are obtained with σ62 = 0.7 MeV and σ110 = 1.0 MeV respectively. Figure 2 shows the quality of the fit we achieve for 110 MeV protons. A comparable fit of the depth dose curve is obtained for the proton beam of 62 MeV. The calculation of depth activity profiles also requires a parametrization of the I I in (3.2). Re+ accounts for the different positron range spectra of different distribution Re+ isotopes as well as for the spatial resolution of the PET scanner. The medium range of a positron, emerging from the decay 11 C and 13 N in Lucite is approximately 0.6 mm and 1.3 mm (Berger and Seltzer 1964). Our PET scanner, however, has a spatial resolution of 5–6 mm full width at half maximum (FWHM). Both components, the positron range and the spatial PET resolution, are approximated by Gaussian distributions with widths of 1.0 mm and 2.8 mm respectively. The convolution of these two separate Gaussians resulted in a Gaussian spectrum for ReI+ with a standard deviation of 3.0 mm. 4. Results and discussion 4.1. The strength of the activity signal The strength of the proton induced activity signal is the first important measure for evaluating the feasibility of proton dose monitoring with PET techniques. In our phantom study,
Proton dose monitoring with PET
183
Figure 1. Our spline fits of the isotope production cross-sections for the proton induced β + activation of 12 C and 16 O. The underlying data of this fit, obtained from Landolt–B¨ornstein (1973) and references therein, are also shown.
where the dominant activation mechanism, the neutron knockout from 12 C, is very well understood, we first analysed whether the absolute activity values derived from a simple model calculation are indeed observed in our experiment. Two quantities, the total activity induced into the phantom and the activity per volume in the entrance slice of the phantom, were chosen as reference points for this comparison. The theoretical estimate of the induced activity only takes into account the activation of 11 C from 12 C. Under this assumption, the activity per volume induced into Lucite can be approximately described by (A.3) of appendix A, i.e., C aLuc (z, t) (MBq cm−3 ) = 3.68(z)(108 s−1 cm−2 )σCC (E(z)) (barn)(1 − e−λC tR ) e−λC (t−tR ) . (4.1) C For our calculation of aLuc (z = 0) in the entrance slice of the phantom we used the proton flux 8 and the irradiation and transport times given in table 2 and table 3. The production cross-section σCC for 62 MeV and 110 MeV protons is interpolated from the data given in Landolt–B¨ornstein (1973). The total activity in a volume defined by a lateral profile F and a maximum proton range R is obtained by integrating (4.1), i.e., Z R C dz aLuc (z). (4.2) ACLuc (MBq) = F 0
The results of our activity measurements at the beginning of the PET scan together with our estimates based on (4.1) and (4.2) are shown in table 4. The count rate for the static scan No 4 refers to the averaged count rate for the scanning time of 30 min.
184
U Oelfke et al
Figure 2. The dose distribution of an RBP for 110 MeV protons is used to determine the energy spectrum of the initial proton beam. We show a model calculation for a Gaussian energy spectrum, whose width σE was fitted to σE = 1 MeV, in comparison to our experimental data.
Table 4. Proton induced activities (RBP). exp
Scan
Proton energy (MeV)
Atot (MBq)
Acalc tot (MBq)
a exp (z = 0) (Bq mm−3 )
a calc (z = 0) Bq mm−3 )
1 2 3 4
110 110 110 62
0.15 0.47 2.52 0.042
0.14 0.44 2.41 0.038
3.5 10.7 62.9 4.0
3.4 10.4 58.7 5.1
For the phantom irradiations with 110 MeV protons the absolute activity measured and the activity per volume in the entrance slice agree fairly well with our theoretical estimates, i.e. over a wide range of activities, e.g. 0.15–2.5 MBq for the total activity, the deviations observed between experiment and calculation are within 5–7% . Even count rates as low as 3–4 counts mm−3 in the entrance slice can be predicted and measured consistently. For the irradiation with 62 MeV protons, however, the induced activities could not be reliably predicted. The discrepancies between our estimates and the measured data, shown in table 4, are −10% and +20% for the total activity and the activity per volume in the entrance slice. Paans and Schippers (1993) observed a similar degree of discrepancy between measurement and theoretical estimate of the total activity. They used a 55 MeV proton
Proton dose monitoring with PET
185
beam to activate a melamime and a polyethyleneglycol target. Their subsequent analysis of the induced activity with a Siemens ECAT 951/31 scanner showed a total activity of 5.1 MBq and 4.1 MBq for the two targets while an activity of 6.2 MBq and 6.4 MBq was anticipated. Paans and Schippers attributed this 20–50% discrepancy between measured activity and calculation to uncertainties in their model calculation, e.g., uncertainties in the data used for the isotope production cross-section. The model calculation in our analysis, however, is much more precise and is based on the well known 12 C(p, pn)11 C isotope production cross-section (Landolt–B¨ornstein 1973), so the observed 10–20% discrepancy between predicted and measured activity can not easily be explained by uncertainties in the model calculation. It seems more likely that the observed deviations are related to the limited spatial resolution of our PET camera and the very low count rate observed for this activation. For 62 MeV protons the induced depth activity profile in Lucite only extends over a range of 3 cm. The spatial resolution of our PET camera, with an FWHM of 5–6 mm, seems to be insufficient to allow for an accurate scan of such a short activity profile at low count rates. 4.2. Dynamic scans The induced activity in our Lucite phantom (C5 H8 O2 ) arises from the three isotopes C, 13 N and 15 O which are produced by the activation of 12 C and 16 O. The dominant isotope production mechanisms are the neutron knockout reactions 12 C(p, pn)11 C and 16 O(p, pn)15 O. Smaller amounts of 11 C and 13 N arise from the processes 16 C(p, 2(pn))13 N and 16 O(p, 3(pn))11 C. The four corresponding isotope production cross-sections have been shown previously in figure 1. To determine the extent to which different isotopes contribute to our detected activities, we perform a set of dynamic PET scans for the analysis of our three activations with 110 MeV protons. In the dynamic scanning protocol the induced activity is recorded for 15–30 frames of 1 or 2 min (see table 3). The decay of the total activity signal is then fitted with a linear combination of the three exponential decays for 15 O, 13 N and 11 C by using the relative abundance of the isotopes as fit parameters. In all three of our scans no significant activity contribution from the isotopes 13 N or 15 O can be identified. For the short-lived isotope 15 O this result is expected, because the number of 15 O isotopes is reduced by a factor of at least 1000 during the transport of the phantom. The relative abundance of 13 N isotopes is also expected to be small, because the ratio of the 13 N and 11 C production cross-sections is smaller than 0.1 for almost the whole range of proton energies (see figure 1). Considering the magnitudes of the isotope production cross-sections for 13 N and 11 C as well as their different decay constants, we expected to find an activity contribution from 13 N of approximately 10% at the end of the proton range, which was not observed. There are two potential factors that may contribute to this discrepancy, one rooted in the location of the scan and the other in the spatial extension of the activity we seek to detect. We may fail to detect the 13 N toward the end of the proton range because the overall activity signal is weaker there due to the reduced proton flux. Note that we found a maximal activity of 6 Bq mm−3 in the corresponding lateral phantom slice at the beginning of the PET scan. Detecting the 13 N activity component maybe further complicated by the relatively short extension (3–4 mm in depth) of the 13 N activity in comparison to the broad spatial resolution of our PET scanner (5–6 mm FWHM). In contrast to our results, Paans and Schippers (1993) were able to identify a 2% 13 N activity component when they studied the activation of polyethyleneglycol with 55 MeV 11
186
U Oelfke et al
protons. Surprisingly, they also report that a significant number of 13 N isotopes was found very close to the phantom entrance. Paans and Schippers attribute this part of the 13 N activity to 13 N production through the 16 O(p, 2(pn))13 N channel. This explanation, however, requires a significant increase of the 16 O(p, 2(pn))13 N cross-section with respect to the corresponding 12 C(p, pn)11 C cross-section for proton energies around 50 MeV. This is not supported by the available cross-section data (Landolt–B¨ornstein 1973). 4.3. Depth activity profiles and their correlation to dose We also compare the depth activity profiles obtained from the PET scans with our model calculation and analyse the spatial correlation between relative dose and activity. 1D depth activity profiles were obtained by integrating the activity for each lateral profile measured. As discussed in subsection 4.2 we only observed activity contributions from one specific isotope (11 C). The results of our model calculation, based on (3.2)–(3.4), use the proton flux model of appendix B, which takes into account the effects of energy straggling and inelastic nuclear interactions. 4.3.1. Activations with 110 MeV protons. The experimental data for our studies with 110 MeV protons are compared with our model calculations in figure 3. The induced activity profile was found to be almost constant from the phantom entrance up to a penetration depth of 6 cm in Lucite. This particular shape of the profile results from an accidental cancellation of two effects. First, the 12 C(p, pn)11 C cross-section, which increases with decreasing proton energy down to 45 MeV (see figure 1), tends to increase the activity up to a penetration depth of roughly 6 cm. This activity increase, however, is compensated by the decrease of proton flux in the phantom, so that the combined effect of cross-section and proton flux results in a constant activity plateau. The activity plateau and its distal decrease, consistently observed in all three activations, are well reproduced by our model calculation. The predicted activity profile was found to agree with our measured data within ±5%. In addition to the calculated and measured activity profiles, figure 3 also shows the corresponding depth dose profile of an RBP for 110 MeV protons at TRIUMF. The depth dose curves were obtained by scaling the dose profiles measured in water to the density of Lucite. There is obviously no positive spatial correlation in depth between the induced relative activity and relative dose in figure 3. This result, also found by Paans and Schippers (1993), is expected because the activity and dose determining quantities, the isotope production cross-section and the proton stopping power, exhibit quite a different dependence on the proton energy. The broad continuous shape of the 12 C(p, pn)11 C crosssection (see figure 1) clearly differs from the proton stopping power, which is strongly peaked at the end of the proton range, so the resulting profiles of activity and dose look quite different. Hence a prediction of absorbed dose based on induced activity profiles seems to be difficult. Of special interest for our study is the question of whether the maximal proton range can be derived reliably from the induced activity pattern. Due to the energy thresholds of the isotope activation reactions the range of the activity will always turn out to be smaller than the maximal penetration depth of the protons. For our activations, the approximately 20 MeV energy threshold ET I for the 12 C(p, pn)11 C process causes a loss in range of approximately 3.6 mm in Lucite (Janni 1982). We observed that the distal 50% activity value is located 6–7 mm in front of the position of the Bragg peak (see figure 3). This spatial offset between activity and dose profile is at least partially due to the spatial resolution of our PET camera (5–6 mm FWHM). A similar difference between activity and proton range
Proton dose monitoring with PET
187
Figure 3. Relative depth dose and depth activity profiles for an activation of Lucite with 110 MeV protons. A model calculation of the proton induced activity, represented by the black dots, is shown in comparison to the activity data obtained in PET scan No 3. The entrance surface of the phantom is positioned at a depth z = 0. The corresponding dose distribution of an RBP is represented by the dashed line.
of 5–6 mm was reported by Vynckier et al (1993) who analysed a phantom activation with 85 MeV protons. We therefore believe that the in vivo determination of the maximal proton range with currently available PET scanners has an uncertainty of at least 2–3 mm. In our model calculations we also studied the sensitivity of the induced activity pattern to details of the proton flux, i.e. the sensitivity of the profile to the phenomena of inelastic nuclear interactions or energy straggling. The influence of inelastic nuclear interactions was found to be of the order of 10%. Figure 4 shows the two activity profiles where this effect is is either included or neglected. Neglecting the inelastic interactions, which mostly occur in the entrance region of the phantom, caused a slight slant of the whole profile. The effect of energy straggling on the activity profile was expected to be small and was found indeed to be of the order of 1%.
4.3.2. Activations with 62 MeV protons. The activations performed with the lower-energy protons of 62 MeV show qualitatively a very similar result to the activations with 110 MeV protons. The induced activity ranges up to 3 cm depth so that only 12 lateral profiles were obtained. The comparison of our model calculations with the measured activity data is shown in figure 5. The analysis of this short activity profile reveals clearly the sensitivity of our
188
U Oelfke et al
Figure 4. Two model calculations of the β + activity induced by 110 MeV protons in Lucite. Our full calculation, represented by the black dots, is compared to a study where the effect of inelastic nuclear interactions on the proton flux is neglected. Both profiles were normalized to their maximum activity value.
measurement to the spatial resolution of our PET scanner. The activity detected at the phantom entrance rises up to its maximum value at a penetration depth of 1 cm, which corresponds to a residual proton energy of approximately 45 MeV. For penetration depths greater than 1 cm the combined decrease in isotope production cross-section and proton flux then determines the distal decrease of the activity pattern. The measured activity profile and our model calculation are found to agree within ±10%. The offset in depth between the distal 50% activity value and the peak position of the dose profile is again 6–7 mm, as shown in figure 5. In addition to analysing this activity for an RBP dose profile of 62 MeV protons, we also studied the activity pattern for an SOBP with a plateau width of 2 cm. The measured activity profile together with the prediction of our model calculation is shown in figure 6. Both the activity and the dose profile are slightly shifted in comparison to the results of figure 5, due to the minimal thickness of the range modulator. However, the shapes of the obtained activity profiles for the RBP in figure 5 and the SOBP in figure 6 are almost identical. This result clearly indicates that a depth dose profile cannot be uniquely determined from the proton induced activity pattern. In order to emphasize this point, we show in figure 7 the predicted activity profile for a 57 MeV RBP in comparison to our previous result for the 62 MeV SOBP. The relative activity profiles for these quite different depth
Proton dose monitoring with PET
189
Figure 5. Relative depth dose and depth activity profiles for an activation of Lucite with 62 MeV protons. A model calculation of the proton induced activity, represented by the black dots, is shown in comparison to the activity data obtained in PET scan No 2. The corresponding dose distribution of an RBP is represented by the dashed line.
dose profiles agree within ±5%, i.e., in general the induced activity profile is not uniquely correlated to a corresponding dose distribution. 4.4. Lateral localization of activity and its correlation to dose Our study of the lateral activity deposition and its correlation to dose is not as detailed as our analysis of the depth activity profiles, e.g., no corresponding model calculations or explicit comparisons of lateral dose and activity profiles are performed. However, we analyse the lateral location of the induced activity for one activations with each of 110 MeV or 62 MeV protons. The lateral dose and activity profiles are mainly determined by the aperture of the final collimator in front of the phantom. For both irradiations a circular aperture is used. The analysis of the lateral dose profiles shows that for our experimental set-up the 50% isodose level is approximately located at the position of the collimator edge projected into the considered lateral plane. No significant beam divergence is observed, so the aperture radius of the final collimator approximately defines the 50% isodose level for all lateral planes. For each image plane we define a region of interest (ROI) whose boundaries are determined by the 50% isoactivity contour. The area of this ROI was then used to define the radius R50 of an area equivalent circular ROI. This radius R50 , characterizing the 50% isoactivity level, was compared to the radius of the 50% isodose contour. The results of this comparison for each plane of activity are shown in figure 8. For
190
U Oelfke et al
Figure 6. Relative depth dose and depth activity activity profiles obtained for an SOBP of 2 cm plateau width with 62 MeV protons. The range of both profiles is shifted by 3 mm towards the phantom entrance due to the special design of the range modulator used.
both activations, the one with 110 MeV protons and an aperture of 15 mm radius and the one with 62 MeV and an aperture of 10 mm radius, the 50% activity and dose contours are found to agree within ±1.5 mm. 5. Summary and conclusions Proton dose monitoring with PET techniques and its application in proton radiotherapy are still under investigation (Vynckier et al 1993, Paans and Schippers 1993, Litzenberg et al 1992, Oelfke et al 1994). In order to evaluate this new concept of in vivo dosimetry, we studied the activation of a Lucite phantom with 110 MeV and 62 MeV protons. The induced activity profiles, measured with a CTI/Siemens ECAT 953b PET scanner, were first compared to a model calculation. Then the correlation between induced activity profiles and absorbed dose were studied in detail. First, we analysed the strength of the induced activity and its detectability with our PET camera. For both proton energies, there was good agreement between our model calculation and the induced average count rates ranging from 3–5 Bq mm−3 to 60–100 Bq mm−3 . The average induced activity after a typical proton therapy treatment is expected to be of the order of 20–50 Bq mm−3 , e.g. Vynckier et al (1993) reported an average activity of 40 Bq mm−3 for the delivery of a 3 Gy fraction with 85 MeV protons. Our study indicates that an activity signal of this strength can be reliably detected with currently available PET cameras. This
Proton dose monitoring with PET
191
Figure 7. The comparison of relative depth dose and depth activity profiles demonstrates that dose and induced activity are not uniquely correlated. The activity profiles obtained for the quite different dose distributions of an RBP and SOBP are almost identical over the whole range of penetration depths.
however, would require that the PET scanner is located close to the proton therapy facility (Vynckier et al 1993). The lateral localization of absorbed dose by the detection of the induced activity seems to be limited only by the spatial resolution of the PET scanner. In our study the 50% isodose and 50% isoactivity contour were found to coincide within a margin of ±1.5 mm. Depth activity profiles for both proton energies of 110 MeV and 62 MeV could be measured in good agreement with our model calculation, i.e., the observed deviations were of the order of 5–10%. The sensitivity of our calculation to details of the model used for the proton flux was also analysed. The effect of energy straggling was found to be negleglible (1–2%); however, the inclusion of inelastic nuclear interactions, at least at higher proton energies, can significantly change the observed activity profiles. The correlation between depth dose profiles and the corresponding depth activity profiles is usually poor, e.g. in our study the distal 50% activity value was found to be located 6–7 mm in front of the dose peak for an RBP. The loss in activity range is caused by the specific energy thresholds of the isotope production process and the limited spatial resolution of the PET camera, but even for a PET camera with ideal spatial resolution, the dose profile will usually extend up to 3–4 mm further in depth. Furthermore, the shape of the induced activity profile does usually not allow derivation of the corresponding depth dose curve. For example, we demonstrated that the relative activity profiles for an RBP of 57 MeV and an SOBP of 2 cm plateau width are almost identical.
192
U Oelfke et al
Figure 8. (a) The lateral activity distribution for the activation of Lucite with 110 MeV protons: the effective 50% isoactivity radius R50 , i.e. the radius which on average defines the 50% isoactivity contour, for each lateral plane in PET scan No 2. R50 is almost constant over the whole range of penetration depths and agrees with the corresponding isodose contour of approximately 15 mm within ±1.5 mm. (b) The lateral activity distribution for the activation of Lucite with 62 MeV protons: the effective 50% isoactivity radius R50 , i.e. the radius which on average defines the 50% isoactivity contour, for each lateral plane in PET scan No 4. R50 is almost constant over the whole range of penetration depths and agrees with the corresponding isodose contour of approximately 10 mm within ±1 mm.
Proton dose monitoring with PET
193
A good spatial correlation between depth dose and depth activity can only be expected if the activation cross-section varies with proton energy similar to the proton stopping power, i.e., for a cross-section with a pronounced peak close to the maximum proton range. The dominant cross-sections for the proton activation of tissue, the neutron knockout reactions from 12 C and 16 O, however, do not show such a structure. The verification of depth dose profiles with PET techniques will therefore be limited to a comparison between the measured activity and an activity profile derived from a model calculation. Although our analysis of the prospect of proton dose monitoring with PET techniques is positive in general, we want to emphasize that our results refer to an idealized phantom study. For the verification of a patient treatment, several complicating factors have to be considered in addition. First, the nuclear composition of the irradiated tissue (including inhomogeneities) is usually not well known, so that the prediction of the induced activity may be quite difficult. Furthermore, most of the activity in tissue will arise from the activation of oxygen, which to some extent is dissolved within the patient’s blood stream. The blood flow may therefore dislocate the original activity and severly disturb the anticipated activity pattern. Acknowledgments We would like to thank Dr V Sossi and K Buckley for performing the PET scans at the UBC hospital, Dr E Blackmore and Dr J Vincent for providing the proton beam at the TRIUMF beamline 2C and Dr T Ruth for his continuing support of this project. This project was partially funded by the Canadian Natural Science and Engineering agency under grant #4010, and by TRIUMF. Appendix A. Calculation of induced activities in compounds In this appendix we give a short derivation of a formula which allows calculation of the proton induced activity in a compound. The compound, e.g. tissue or phantom material, consists of different target nuclei NT with atomic number AT . Usually, the mass density ρC of the target and the mass fractions ωT of the individual nuclei NT , i.e. ωT = mass(NT )/mass(C), are known. A proton irradiation of the compound results in an activity which is proportional to the proton flux 8, the activation cross-sections σT I and the density ρT of target nuclei (see (3.4)), i.e., X aIE0 (z, t) = ρT (z)8E0 (z)σT I (E(z))(1 − e−λI tR ) e−λI (t−tR ) . (A.1) T
The density ρT can be expressed in terms of the mass density ρC and the mass fraction ωT as ρT = ρC (ωT /AT )/mN
(A.2) −24
where mN is the mass of a nucleon, i.e. mN = 1.674 × 10 g. Employing the relation (A.2) in (A.1) results in the following useful relation for practical activity calculations: X ωT E0 aI,Comp (MBq cm−3 ) = 60 8E0 (108 s−1 cm−2 )ρC (g cm−3 ) σT I (E(z)) (barn) AT T ×(1 − e−λI tR ) e−λI (t−tR ) . (A.3) For the special case of our Lucite (C5 H8 O2 ) phantom, where only the dominant activation process 12 C(p, pn)11 C was considered, (A.3) yields the result given in (4.1).
194
U Oelfke et al
Appendix B. The proton flux model and its application in activity calculations For the calculation of depth activity profiles, as described in section 3, we use a phenomenological parametrization of the proton flux inside the target medium, which is based on the work of Janni (1982). The model considers the depth variation of the flux for a monoenergetic proton beam of energy E0 inside a homogeneous medium. All lateral effects, e.g. lateral displacements from multiple Coulomb scattering or beam divergence effects, are neglected. We first briefly describe the three main components of the flux model, i.e., the reduction of the proton velocity through elastic collisions with atomic electrons, the absorption of protons through inelastic nuclear interactions and the effect of energy straggling. (i) Elastic collisions. Elastic proton–atom collisions and inelastic proton nuclear processes are the two fundamental reactions responsible for the decrease in proton flux with increasing penetration depth. The most important part, the loss of kinetic energy due to elastic collisions, is parametrized in terms of the collisional stopping power Sm of the medium, i.e., 8E0 (z) = 8E0 (0)v(z)/v(0) where the average velocity for a proton of mass mp q v(z) = E(z)(E(z) + 2mp c2 )c2/[E(z) + mp c2 ] is related to Sm by the energy range relation (3.5), i.e., Z E 1 1 . dE 0 z= ρm (z) E0 Sm (E 0 )
(B.1)
(B.2)
(B.3)
(ii) Inelastic nuclear collisions. The inelastic nuclear processes are assumed to be totally absorptive, i.e. for each inelastic proton nucleus collision a proton will be lost from the proton fluence. The respective decrease of 8E0 (z) becomes more significant with increasing proton energy E0 and is determined by the probability Pabs (E) that a proton experiences an inelastic nuclear collision throughout its entire stopping process in the target volume. The E0 of 8E0 (z) due to inelastic collisions can be easily shown to depend on relative change rabs Pabs as E0 rabs (z) = [1 − Pabs (E0 )]/[1 − Pabs (E(z))].
(B.4)
(iii) Energy straggling. So far, the actual energy spectrum resulting from statistical effects in the proton energy loss has not been taken into account. An initially monoenergetic beam of protons acquires an increasing energy spread while passing through the target medium. This energy straggling can be accounted for by introducing a spectrum FsE0 (z 0 − z) of penetration depths z 0 centred around the average penetration depth of the proton ensemble. The effect of FsE0 (z 0 − z) on the activity profiles is expected to be small, so a Gaussian approximation of the actual spectrum seems to be reasonable, i.e., p FsE0 (z 0 − z) = [ (1/2π)/σ E0 (z)] exp(−(z − z 0 )2 /2(σ E0 (z))2 ). (B.5) The width σ E0 (z) decreases with increasing average penetration depth z and is determined by the variance σs (E) for total pathlength straggling, i.e, q (B.6) σ E0 (z) = σs2 (E0 ) − σs2 (E(z)) as defined by Janni (1982).
Proton dose monitoring with PET
195
The combination of the three effects, (i)–(iii), yields the following relation for the proton flux inside a homogeneous medium, provided that any lateral changes in proton flux can be neglected: Z v(z 0 ) E0 0 r (z ). (B.7) 8E0 (z) = 8E0 (0) dz 0 FsE0 (z 0 − z) v(0) abs The phenomenological parametrization of the stopping power Sm , the probability of an inelastic nuclear interaction Pabs , and the straggling distribution FsE0 for various target materials can be found in the work of Janni (1982). The application of (B.7) for the calculation of depth activity profiles (3.4) yields the following result for aIE0 (z): Z v(z 0 ) E0 0 X aIE0 (z, t) = 8E0 (0) dz 0 FsE0 (z 0 − z) r (z ) ρT (z 0 )σT I (E(z 0 ))(1 − e−λI tR ) e−λI (t−tR ) . v(0) abs T (B.8) The activity profiles in (B.8) can no longer be calculated as a simple product of the proton flux and the activation cross section σT I because we have explicitly included the effect of energy straggling in our flux model. However, in practice the variation of σT I over the effective energy spread of the straggling distribution is extremely small, so (B.8) is well approximated by X ρT σT I (E(z))(1 − e−λI tR ) e−λI (t−tR ) (B.9) aIE0 (z, t) = 8E0 (z) T
which is our result given in (3.4), where 8E0 (z) is calculated according to (B.7). References Berger M J and Seltzer S M 1964 Tables of Energy Losses and Ranges of Electrons and Positrons NASA SP-3012 (Washington, DC: National Bureau of Standards, Scientific and Technical Information Division) Enghardt W et al 1992 The spatial distribution of positron emitted nuclei generated by relativistic light ion beams in organic matter Phys. Med. Biol. 37 2127–31 Goodman G B, Lam G K Y, Harrison R W, Bergstr¨om M, Martin W R and Pate B D 1986 The use of positron emission tomography in pion radiotherapy Int. J. Radiat. Oncol. Biol. Phys. 12 1867–71 Janni J F 1982 Proton range–energy tables: 1 keV–10 GeV At. Data Nucl. Data Tables 27 147 Klerck J, Smathers J, Myers L, Mandelkern M and Digby W 1988 Fast neutron dosimetry using positron emission tomography Proc. World Congress on Medical Physics and Biomedical Engineering (San Antonio, 1988); Phys. Med. Biol. 33 (Supplement 1) 5 Landolt–B¨ornstein 1973 Excitation Functions for Charged Particle Induced Nuclear Reactions (Numerical Data and Functional Relationships in Science and Technology 5, Part b) (Berlin: Springer) Litzenberg D W, Bajema J F, Becchetti F D, Brown J A, Roberts D A, Caraher J, Hutchins G, Ronningen R, Smith R and Abbot M 1992 On-line monitoring and PET imaging of proton radiotherapy beams IEEE MIC (October, 1992) Oelfke U, Lam G K Y and Atkins M S 1994 The feasibility of proton dose monitoring with PET: quantitative studies Med. Phys. 21 896 (Abstract) Okunieff P, Lee J and Vaupel P 1992 Measurement of human tumor blood flow: a positron technique using an artifact of high energy radiation therapy Oxygen Transport to Tissue XIV ed W Erdmann and D F Bruley (New York: Plenum) pp 169–75 Paans A M J and Schippers J M 1993 Proton therapy in combination with PET as monitor: a feasibility study IEEE Trans. Nucl. Sci. 40 1041–4 Shirato H, Harrison R, Kornelson R O, Lam G K Y, Gaffney C C and Goodman G B 1989 Detection of pion induced radioactivity by autoradiography and positron emission tomography Med. Phys. 16 338–45 Tomitami T, Sudo M, Minohara S, Kohno T, Takada E and Kanai T 1993 Feasibility study on the application of auto activation of heavy ions to the monitoring of the dose distribution Proc. Int. Congress of Radiation Oncology (Kyoto, 1993) p 393
196
U Oelfke et al
Vynckier S, Derreumaux S, Richard F, Bol A, Michel C and Wambersie A 1993 Is it possible to verify directly a proton-treatment plan using positron emission tomography? Radiother. Oncol. 26 275–7 Vynckier S, Vanneste F, Richard F, Bol A, Michel C and Wambersie A 1989 Control of patient positioning for fast neutron therapy using positron emission tomography Br. J. Radiol. 62 1031–2