energies Article
Pyrolysis of Polyolefins Using Rotating Arc Plasma Technology for Production of Acetylene Ming Zhang, Jie Ma, Baogen Su, Guangdong Wen, Qiwei Yang * and Qilong Ren Key Laboratory of Biomass Chemical Engineering, College of Chemical and Biological Engineering, Zhejiang University, Hangzhou 310027, Zhejiang, China;
[email protected] (M.Z.);
[email protected] (J.M.);
[email protected] (B.S.);
[email protected] (G.W.);
[email protected] (Q.R.) * Correspondence:
[email protected]; Tel.: +86-571-8795-1125 Academic Editor: Shusheng Pang Received: 17 February 2017; Accepted: 26 March 2017; Published: 10 April 2017
Abstract: Polyolefin, as one of the most widely used macromolecule materials, has been one of the most serious threats to the environment. Current treatment methods of waste polyolefin including landfill, incineration, and thermal degradation have suffered from severe problems such as secondary pollution and the generation of other toxic substances. In this article, we report for the first time a high-efficiency method to produce high-value C2 H2 from polyolefins using a rotating direct current arc plasma reactor, using polyethylene and polypropylene as feedstocks. The essence of this method is that a reductive atmosphere of pyrolysis enables a thermodynamic preference to C2 H2 over other carbon-containing gas and the rotating direct current arc plasma reactor allows for a uniform distribution of high temperature to ensure high conversion of polymers. Thermodynamic simulation of product composition was performed, and the effect of plasma input power, polyolefin feed rate, and working gas flow rate on the pyrolysis results was experimentally investigated. It was found that, with proper parameter control, approximately complete conversion of carbon in polyolefin could be obtained, with a C2 H2 selectivity higher than 80% and a C2 H2 yield higher than 70%. These results not only create new opportunities for the reuse of polymer waste, but are also instructive for the green production of C2 H2 . Keywords: plasma; rotating arc; polyolefin; pyrolysis; acetylene
1. Introduction The 21st century has been recognized as the era of polymers. Despite its short history, polymer has been one of the most widely used materials in industry and daily life, due to excellent properties such as low density, resistance to fatigue and corrosion, great strength, sound insulation, and low maintenance cost [1–3]. Polyolefin, represented by polyethylene and polypropylene, is the most common polymeric material [4,5]; polyethylene alone has a global production of 155 t. However, severe pollution problems accompany the wide use of polymer because polymeric material is stable and is not prone to decomposition reactions under usual environmental conditions [6,7], which means the deposition of polyethylene in landfills requires a great deal of space. With the exception of a few polymers that can be handled by environmentally friendly degradation, polymeric waste treatment is achieved by landfill, incineration or thermal degradation [7–12], which causes secondary pollution or generates other toxic substances such as dioxin [13]. Therefore, the development of reliable recycling or decomposition methods is an urgent necessity. Thermal plasma technology has attracted great interest in recent years due to great advantages, such as those shown in the direct pyrolysis of coal, hydrocarbons, biomass and solid waste into primary petrochemicals via its properties such as high temperature, high energy density and large numbers of active particles [14–25]. It is also regarded as a means of recycling macromolecule materials more Energies 2017, 10, 513; doi:10.3390/en10040513
www.mdpi.com/journal/energies
Energies 2017, 10, 513
2 of 13
efficiently, by converting them into monomers or light hydrocarbon gas that can be reused in the polymer production cycle or other ways, making it the subject of several investigations. Guddeti et al. used an induction-coupled radio frequency plasma-heated reactor to convert polyethylene and polypropylene into light gases such as propylene, ethylene and methane in argon atmosphere [26,27]. Chang et al. tried thermal plasma pyrolysis of used tires for the production of syngas in argon atmosphere [28]. Although these studies achieved good conversions, a significant shortcoming is that the main pyrolysis product in these studies are olefins, methane and syngas, whose economic value is low. Moreover, olefins can be obtained more economically via petroleum routes, while methane is present in nature as natural gas and shale gas, and syngas is also widely available. Therefore, the search for an efficient method of turning polymers into more valuable products with higher conversion and yield is attracting more and more interest. To address the above problems, we report here for the first time a highly efficient method of producing C2 H2 from polyolefins with a rotating direct current arc plasma reactor, using polyethylene and polypropylene as feedstocks. C2 H2 has a higher commercial price than C2 H4 and syngas, and is scarcely produced from the petroleum and natural gas industry. The essence of our strategy is that a reductive atmosphere of pyrolysis enables a thermodynamic preference to C2 H2 over other carbon-containing gases, and the rotating DC arc plasma reactor allows for a uniform distribution of high temperature to ensure the high conversion of polymers. Under optimum conditions, an approximately complete carbon conversion was achieved, with a C2 H2 yield of 81.4% and a selectivity of 83.8%. In fact, nowadays the dominant technology for producing C2 H2 is the hydrolyzation of calcium carbide, which requires heavy consumption of water and energy and causes severe CO2 discharge. Thus these results not only create new opportunities for the reuse of polymer waste, but are also instructive for the green production of C2 H2 . 2. Materials and Methods 2.1. Model Feedstock and Injection Powder of high density polyethylene, as well as polypropylene, obtained from Shanghai GuanBu Electromechanical Technology Co., Ltd. (Shanghai, China), were used as feedstock. The particle size of polyethylene varied from 20 µm to 80 µm, while polypropylene particle size varied from 100 µm to 230 µm. The polyethylene powder was fluidized in a flow of argon carrier gas and fed from a screw feeder into the plasma torch. The feed rate could be adjusted from 12 g/min to 30 g/min. 2.2. Thermodynamic Simulation The simulation of pyrolysis reaction of polyethylene was performed in the program Chemkin 4.1. An equilibrium model was used to carry out the simulation of thermal equilibrium composition of the pyrolysis result, with species considered including H2 , O2 , H2 O(g), C(g), CH4, CO, CO, CH2 O, CH3 OH, C2 H2 , C2 H4 , C2 H6 , C3 H6 and C3 H8 . The input temperature varied from 1000 K to 5000 K, with pressure at 0.1 MPa. 2.3. Reactor Set-Up A schematic diagram of the rotating DC arc plasma system, which consists of a plasma torch, an injector, a quenching unit and a sampling device, was shown in Figure 1. The torch, with an inner diameter of 25 mm, consists of a tube shaped copper anode and a rod shaped tungsten cathode, both water-cooled. A field coil was designed around the copper anode in order to generate a magnetic field, which would make the arc rotate with a high speed. The rotating arc would not only form a uniform and stable jet at extremely high temperature (>3000 K), but also contribute to the mixing of feedstock and working gas. The operating parameters of the plasma reactor are listed in Table 1.
Energies 2017, 10, 513 Energies 2017, 10, 513
3 of 13 3 of 13
Figure 1. 1. Schematic diagram of 50 kW rotating rotating DC DC arc arc plasma plasma reactor. reactor. 1—material 1—material feeder, feeder, 2—DC 2—DC Figure power supply, supply,3—cathode, 3—cathode,4—field 4—fieldcoil, coil,5—anode, 5—anode,6—heat 6—heatexchanger, exchanger,7—GC, 7—GC,8—quenching 8—quenchingunit. unit. power Table 1. Operating parameters parameters of of plasma plasma reactor. reactor. Table 1.
Process Parameters Process Parameters Current (A) Current (A) Voltage (V) Voltage (V) Input power(kW) (kW) Input power Magnetic flux intensity Magnetic flux intensity (T)(T) Feed Feedrate rate(g/min) (g/min) 3 /h) Carrier gas 3/h) Carrier gas(Ar) (Ar)(Nm (Nm Working gas (H2 ) (Nm3 /h) Working gas (H2) (Nm3/h)
Range Range 60–200 60–200 180–270 180–270 10–30 10–30 0.020–0.096 0.020–0.096 10–20 10–20 11 3–7 3–7
Optimum Optimum 80–100 80–100 200 200 12–15 12–15 0.096 0.096 // 11 5 5
2.4. 2.4. Gas Gas Analysis Analysis The The product product gas gas was was analyzed analyzed by by aa gas gas chromatograph chromatograph (KEXIAO, (KEXIAO, GC-1690) GC-1690) (Hangzhou (Hangzhou Kexiao Kexiao Chemical Equipment Co., Co.,Ltd, Ltd.,Hangzhou, Hangzhou, China) with a thermal conductivity detector (TCD), Chemical Equipment China) with a thermal conductivity detector (TCD), and and PLOT 5A molecular sieve packed column followed by PLOT Q capillary column. PLOT 5A molecular sieve packed column followed by PLOT Q capillary column. 2.5. Evaluation of Pyrolysis 2.5. Evaluation of Pyrolysis The carbon conversion to gaseous product (X), selectivity and yield of acetylene (Se and Y), The carbon conversion to gaseous product (X), selectivity and yield of acetylene (Se and Y), and and the specific energy consumption of acetylene (SEC) were the main parameters to evaluate the the specific energy consumption of acetylene (SEC) were the main parameters to evaluate the pyrolysis results, which were calculated as follows: pyrolysis results, which were calculated as follows: nn
X X==
∑ mmii ×× CCi i%% 11
mmf s × ×CC f% s% fs fs
m Acetylene ×1212 Se = nm Acetylene × 1313 × 100% Se = nm × C % × 100% ∑ i i i mi × Ci % i
Y = X × Se Y =X × Se U×I SEC = 1000 × × Iacetylene Um SEC = 1000 × macetylene
(1) (1)
(2) (2) (3) (3) (4)
(4)
Energies Energies 2017, 2017, 10, 10, 513 513
4 of 13
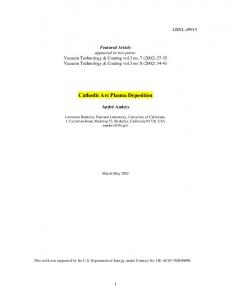
where mi is the flow rate of gaseous component i in g/min, Ci% is the mass fraction of C in gaseous where mi is ithe flow rate component i in the mass of C inin gaseous i % isfraction component in kg/kg, mfsof is gaseous the feed rate in g/min, Cfsg/min, % is theCmass offraction C in feedstock kg/kg, component i in kg/kg, m is the feed rate in g/min, C % is the mass fraction of C in feedstock in fs fs U and I are the working voltage and current, respectively in V and A. kg/kg, U and I are the working voltage and current, respectively in V and A. 3. Results and Discussion 3. Results and Discussion 3.1. Thermodynamic Simulation 3.1. Thermodynamic Simulation Thermodynamicsimulation simulation of polyethylene (PE) pyrolysis was out carried outto qualitatively in order to Thermodynamic of polyethylene (PE) pyrolysis was carried in order qualitatively predict the product of the reaction. The H/C ratio was set at 7.92, which was theassame predict the product of the reaction. The H/C ratio was set at 7.92, which was the same H/C one H/C asofone of the experiments described below Section 3.2 (PE feedg/min rate at and 17.65 g/min and series the series experiments described below in Section 3.2in(PE feed rate at 17.65 the working the working 5 Nm3/h). Thermal plasma pyrolysis is proved to be a reaction gas flow rate gas at 5flow Nm3rate /h). at Thermal plasma pyrolysis is proved to be a reaction completed incompleted extremely in extremely short time (0.4 ms for small molecular hydrocarbons in gas or liquid state and 4 ms for short time (0.4 ms for small molecular hydrocarbons in gas or liquid state and 4 ms for coal particles) coal particles) by the studies reported [19,29]. The equilibrium temperature varied from 1000 K to by the studies reported [19,29]. The equilibrium temperature varied from 1000 K to 5000 K. Figure 2 5000 K. Figure 2 shows the results of simulation: a variety of gaseous products were present in the shows the results of simulation: a variety of gaseous products were present in the product gas. product The main products hydrocarbon products (present in higher mole fractions 1%) were C2H2, The maingas. hydrocarbon (present in mole fractions than 1%)higher were Cthan 2 H2 , C2 H4 and CH4 . C 2H4 and CH4. C2H2 content stabilized at 10% at 1500–3000 K, while mole fractions of C2H4 and CH4 C2 H2 content stabilized at 10% at 1500–3000 K, while mole fractions of C2 H4 and CH4 dropped rapidly dropped rapidlytemperature. with increasing With increase in temperature to over 3000 K, with increasing Withtemperature. further increase in further temperature to over 3000 K, carbon would turn carbon would turn into fromgaseous hydrocarbons gaseous carbonswas (C not andwhat C2), which was notAs what we from hydrocarbons carbonsinto (C and C2 ), which we expected. shown expected. As shown in Figure 2, C 2H2 could be obtained as the main gaseous hydrocarbon product at in Figure 2, C2 H2 could be obtained as the main gaseous hydrocarbon product at a relatively high a relatively high temperature, proving it ato promising to utilize PE waste. temperature, therefore provingtherefore it a promising route utilize PEroute waste. 1
H2 CH4
H
C2H2
ϕ
0.1
C
0.01
C2
C4H2
C2H4 1E-3
C2H6 1E-4 1000
1500
2000
2500
3000
3500
4000
4500
5000
Equilibrium Temperature (K) Figure 2. Thermodynamic simulation simulation of Figure 2. Thermodynamic of PE PE pyrolysis pyrolysis in in equilibrium equilibrium model. model.
3.2. Effect of Input Power and Feed Rate The balance balance of of heat heattransfer transferininthe theplasma plasmatorch, torch, which was controlled input power of which was controlled by by thethe input power of the the plasma system characteristics of the working feedstock, parameter plasma system andand the the characteristics of the working gasgas andand feedstock, waswas thethe keykey parameter of of mass flow rate thesystem. system.Three Threegroups groupsofofexperiments experimentswere werecarried carried out out to investigate the thethe mass flow rate ininthe influence influence of input power, power, feed feed rate rate and and working working gas gas flow flow rate rate on the pyrolysis pyrolysis of PE. First, we carried out a series of experiments in order to investigate the effect of input power and PE feed rate on the plasma acetylene. PEPE powder waswas injected intointo the plasma torchtorch at feed plasma conversion conversionofofPE PEpowder powderinto into acetylene. powder injected the plasma at 3 3 rates of 12 of g/min and 17.65 g/min, withwith a constant working gas flow rate at 5 Nm carrier gas feed rates 12 g/min and 17.65 g/min, a constant working gas flow rate at 5 /h, Nma/h, a carrier 3/h, and flow rate rate at 1 Nm /h, and magnetic flux intensity at 0.077 T, while the input varied varied from 14from kW gas flow at 13Nm magnetic flux intensity at 0.077 T, while the power input power to 26 kW. 26 kW. 14 approximately kW to approximately The product gases were principally mixtures of hydrogen and light hydrocarbons such as acetylene, ethylene and methane, as well as ignorable ignorable amounts of C C33s (70%) achieved at all since a higher gascarbon flow rate would reduce the energy density highercould input power would be be required to get the energy density most suitable for acetylene formation. With proper controlled three working rates. Highermost input power for for acetylene high carbon conversion and C2H2 yield was required to getgas theflow energy density suitable formation. With proper controlled conditions, a high carbon conversion (>95%) of CC2H could be achieved required at the higher gas flow rates. 2H 2 (>70%) conditions, a high carbon conversion (>95%)and andaahigh high yield yield of 2 (>70%) could be achieved at allat all
90 100
90 100
80 90
80 90
70 80
70 80 3
Carbon conversion (3 Nm /h) 3 Carbon conversion (5 Nm /h) 3 Carbon conversion (7 Nm /h) 3 3 Yield of acetylene (3 Nm Carbon conversion (3 Nm/h) /h) 3 3 Yield of acetylene Carbon conversion(5(5Nm Nm/h) /h) 3 3 Yield of acetylene Carbon conversion(7(7Nm Nm/h) /h)
60 70 50 60 40 50 10
60 70 50 60
3
12
Yield of acetylene (3 Nm /h) 14 16 18 320 Yield of acetylene (5 Nm /h) 3 Yield of acetylene (7 Nm /h)
22
24
26
28
40 50 30
Input Power (kW)
40 10
12
14
16
18
20
22
24
26
C2H2 (%) Yield Yield of C2Hof2 (%)
Carbon Conversion Carbon Conversion (%) (%)
three three working gas flow rates. Higher input carbonconversion conversion and C22yield H2 yield working gas flow rates. Higher inputpower power for for high high carbon and C2H was was 100 100 required at theathigher gasgas flow rates. required the higher flow rates.
40 30
28
Figure 8. Variation in the carbon conversion and selectivity of C2H2 at working gas flow rate of 3 Input Power (kW) Nm3/h, 5 Nm3/h, 7 Nm3/h (Carrier gas flow rate: 1 Nm3/h; feed rate: 17.65 g/min; magnetic flux intensity: T). in the carbon conversion and selectivity of C2H2 at working gas flow rate of 3 Figure 8. 0.077 Variation
Figure 8. Variation in the carbon conversion and selectivity of C2 H2 at working gas flow rate of 3/h, 7 Nm3/h (Carrier gas flow rate: 1 Nm3/h; feed rate: 17.65 g/min; magnetic flux 5 Nm Nm 3 /h,3/h, 3 /h, 3 NmThe 5 Nm 7 Nm3 /h (Carrier gas flow rate: 1 Nm3 /h; feed rate: 17.65 g/min; magnetic flux variation intensity: 0.077in T).SEC of C2H2 at varied working gas flow rates is shown in Figure 9. It is obvious intensity: 0.077 T). gas flow rate was beneficial for better SEC of C2H2. At a gas flow rate of 3 Nm3/h that a lower working
and with kW in input SEC of C2H2gas (15.69 2H2) was achieved. The 11.26 variation SECpower, of C2Hthe 2 at best varied working flowkWh/kg-C rates is shown in Figure 9. It is obvious As seen in this series of experiments, a lower working gas flow rate, leading to lower arc 3/h The in SECgas of flow C2 Hrate varied working gas flow is2shown Figure It is obvious that variation a lower working beneficial for better SECrates of C2H . At a gasinflow ratea 9. of 3 Nm 2 at was voltage and input power, made it easier to achieve higher selectivity of acetylene (>85%) and lower with 11.26 kW input the beneficial best SEC offor C2H 2 (15.69 kWh/kg-C 2) was achieved. that aand lower working gas flowpower, rate was better SEC of C H 2H . At a gas flow rate of 3 Nm3 /h 2
2
As seen this series of the experiments, gas flow rate, leading to a lower arc and with 11.26 kWininput power, best SEC aoflower C2 H2working (15.69 kWh/kg-C 2 H2 ) was achieved. voltage and input power, made it easier to achieve higher selectivity of acetylene (>85%)to and As seen in this series of experiments, a lower working gas flow rate, leading a lower lower arc voltage and input power, made it easier to achieve higher selectivity of acetylene (>85%) and lower
Energies 2017, 10, 513
9 of 13
Energies 2017, 10, 513
9 of 13
specific energy consumption, and required lower input power to obtain a satisfying carbon conversion specific energy consumption, and required lower input power to obtain a satisfying carbon and yield of acetylene. At 15.12 kW input power and a 17.65 g/min feed rate, product gas with conversion yield of acetylene. At 15.12 kW input power and a 17.65 g/min feed rate, product9 of gas Energies 2017, and 10, 513 13 a carbon of 94.54%, C2 H2 yield 77.43%, C2 H2Cselectivity of 81.90% and an SEC of C H2 withconversion a carbon conversion of 94.54%, C2H2 of yield of 77.43%, 2H2 selectivity of 81.90% and an SEC of 2 of 19.86 obtained, which is quite aninput impressive specific energy consumption, required lower power pyrolysis to pyrolysis obtain result. a result. satisfying carbon 2H 2 was C 2HkWh/kg-C 2 of 19.86 kWh/kg-C 2H 2 was and obtained, which is quite an impressive Specific Energy Consumption (kWh/kg-C H) Specific Energy Consumption (kWh/kg-C H) 2 2 2 2
conversion and yield of acetylene. At 15.12 kW input power and a 17.65 g/min feed rate, product gas with a carbon conversion80of 94.54%, C2H2 yield of 77.43%, C2H2 selectivity of 81.90% and an SEC of C2H2 of 19.86 kWh/kg-C2H2 was obtained, which is quite an impressive pyrolysis result. 3
80 60
3 Nm /h 3 5 Nm /h 3 7 Nm /h
60 40
3 Nm /h 3 5 Nm /h 3 7 Nm /h
3
40 20
20 0 10
12
14
16
18
20
22
24
26
28
30
Input Power (kW)
Figure 9. Variation in the0specific energy consumption (SEC) of C2H2 at working gas flow rate of 3 Nm3/h,
10 12 energy 14 16 18 20 22 30 Figure 9. 3Variation in the specific consumption (SEC)24of C262 H2 28at working gas flow rate of 3/h (Carrier gas flow rate: 1 Nm3/h; feed rate: 17.65 g/min; magnetic 53Nm /h, 7 Nm flux intensity: 0.077 T). 3 3 3 Input Power (kW) 3 Nm /h, 5 Nm /h, 7 Nm /h (Carrier gas flow rate: 1 Nm /h; feed rate: 17.65 g/min; magnetic flux intensity: T).Pyrolysis 3.4. Polypropylene Figure0.077 9. Variation in the specific energy consumption (SEC) of C2H2 at working gas flow rate of 3 Nm3/h,
5 Nm3/h, 7 Nm3/h (Carrier gas flow rate: 1 Nm3/h; feed rate: 17.65 g/min; magnetic flux intensity: 0.077 T).
Polypropylene is also a widely used polyolefin. A series of experiments on polypropylene 3.4. Polypropylene Pyrolysis pyrolysis was carried out to see if thermal plasma was also an efficient route to the utilization of 3.4. Polypropylene Pyrolysis polypropylene. Propylene fed into the polyolefin. plasma torch A at 17.65 with working flow rate Polypropylene is also awas widely used seriesg/min, of experiments ongas polypropylene 3/h and carrier 3/h. TheA Polypropylene is also a widely used polyolefin. series of experiments on polypropylene set at 5 Nm gas flow rate at 1 Nm product gas composition was quite similar pyrolysis was carried out to see if thermal plasma was also an efficient route to the utilization of pyrolysis was carried out to see if2,thermal plasma wasvariation also an efficient route to theofutilization of to that of PE pyrolysis: mostly C 2H C 2H4 and CH 4. The in the composition product gas polypropylene. Propylene was fed into the plasma torch at 17.65 g/min, with working gas flow rate polypropylene. Propylene fedfraction into theofplasma torch atat17.65 g/min, with working gas flowwith rate is shown in Figure 10. Thewas mole C2H2 peaked 6% and then dropped gradually set at 5 Nm3 /h and carrier gas flow rate at 1 Nm3 /h. The product gas composition was quite similar 3/h and carrier gas flow rate at 1 Nm3/h. The product gas composition was quite similar set at 5 Nm increased input power, while the concentrations of C2H4 and CH4 increased with input power due to to that PE mostly CC2 H C22HH4 4and and CH The variation the composition of product 4 . input to of that of pyrolysis: PE pyrolysis: mostly 2the H22,, plasma C CH 4. The variation inchanged. thein composition of product gas the temperature variation within reactor as power gas isisshown in Figure 10. The mole fraction of C H peaked at 6% and then dropped gradually 2 2 peaked 2 shown in Figure 10. The mole fraction of C2H at 6% and then dropped gradually with with 7 thethe increased input power, while concentrations andCH CH with input power due to increased input power, while concentrationsof ofCC22H44 and 4 increased with input power due to 4 increased the temperature variation within the plasmareactor reactor as input the temperature variation within the plasma inputpower powerchanged. changed.
Mole Fraction Mole Fraction (%) (%)
6
7 5 6 4
C2H2 C2H4
5 3
CH4 C2H2
4 2
C2H4
3 1
CH4
2 0 1
12
14
16
18
20
22
24
26
28
30
32
Input Power (kW)
0 12 14 of16product 18 20 with 22 varied 24 26 28 30 (Carrier 32 Figure 10. Variation in composition gas input power gas flow rate: 1 3 3 Nm /h; working gas flow rate: 5 Nm /h; feed rate:Power 17.65 g/min; magnetic flux intensity: 0.077 T). Input (kW)
Figure 10. Variation in compositionof ofproduct product gas input power (Carrier gas flow Figure 10. Variation in composition gaswith withvaried varied input power (Carrier gasrate: flow1 rate: 3/h; working gas flow rate: 5 Nm3/h; feed rate: 17.65 g/min; magnetic flux intensity: 0.077 T). Nm 3 3 1 Nm /h; working gas flow rate: 5 Nm /h; feed rate: 17.65 g/min; magnetic flux intensity: 0.077 T).
Energies 2017, 10, 513
10 of 13
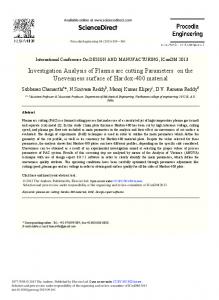
The effect power on the selectivity of C2 H2 is illustrated in Figure 11. With the10variation Energies 2017, of 10, input 513 of 13 Energies 2017, 10, 513 10 of 13 in the composition of product gas shown in Figure 10, it was quite obvious that the selectivity of The decrease effect of input power on the selectivity of C2H2 is illustrated 11.11 With the variation C2 H2 would withpower increased power, is exactlyinasFigure Figure shows. The carbon The effect of input on theinput selectivity of Cwhich 2H2 is illustrated in Figure 11. With the variation in the composition of product gas shown in Figure 10, it was quite obvious that the selectivity of C2H2 conversion and yield of ofproduct C2 H2 is Figure10, 12, which follows similar tendency that in in the composition gasshown shown in in Figure it was quite obviousathat the selectivity of to C2H 2 would decrease with increased input power, which is exactly as Figure 11 shows. The carbon PE pyrolysis. Carbon conversion thepower, yield of C2 His2 peaked respectively at 94.37% 72.55%, would decrease with increasedand input which exactly as Figure 11 shows. The and carbon conversion and yield of C2H2 is shown in Figure 12, which follows a similar tendency to that in PE conversion andwith yieldinput of C2power H2 is shown in the Figure 12, which follows a similar tendency to thatwith in PE before decreasing dueyield to variation in the temperature in the reactor varied pyrolysis. Carbon conversion and the of C 2H2 peaked respectively at 94.37% and 72.55%, before Carbon conversion and the yield of C 2H2 peaked respectively at 94.37% and 72.55%, before inputpyrolysis. power. Figure 13 shows the variation in specific energy consumption (SEC) of C H 2 2 with decreasing with input power due to the variation in the temperature in the reactor with varied input decreasing with input power due to the variation in the temperature in the reactor with varied input varied inputFigure power. With proper working parameters, the SEC of C could 20varied kWh/kg-C power. 13 shows the variation in specific energy consumption (SEC) C2H2be with input 2 H2 , 2 H2 of power. Figure 13 shows the variation in specific energy consumption (SEC) of C2H2 with varied input whichpower. is quite impressive. Variations among results bebefound among2Hthe pyrolysis results With proper working parameters, thethe SEC of C2Hcould 2 could 20 kWh/kg-C 2, which is quite power. With proper working parameters, the SEC of C2H2 could be 20 kWh/kg-C2H2, which is quite impressive. Variations among the results could be found the pyrolysis results size of polyethylene of polyethylene and polypropylene. It is speculated thatamong the variation in particle and molecular impressive. Variations among the results could be found among the pyrolysis results of polyethylene and polypropylene. It is speculated that the variation in particle size influence and molecular structure are transfer the structure are the main cause of the results. The particle would the structure rate of heat and polypropylene. It is speculated that the variation in size particle size and molecular are the main cause of the results. The particle size would influence the rate of heat transfer and gasification, and gasification, would affect the pyrolysis. Theofmethyl groupand on the carbon chain main cause oftherefore the results. The particle sizeresults would of influence the rate heat transfer gasification, therefore would affect the results of pyrolysis. The methyl group on the carbon chain of of polypropylene would affect the random main-chain scission, depolymerization and the side-group therefore would affect the results of pyrolysis. The methyl group on the carbon chain of polypropylene would affect the random main-chain scission, depolymerization and the side-group polypropylene would affect main-chain scission, depolymerization and the side-group reactions, but the specific effectthe on random pyrolysis is not clear. reactions, but the specific effect on pyrolysis is not clear. reactions, the specific effectdescribed on pyrolysis is notsection, clear. it can be concluded that thermal plasma Based onbut the experiments inthis this Based on the experiments described in section, it can be concluded that thermal plasma is a Based on the experiments described in this section, it can concluded that thermal plasma isplasma a is a promising to utilize polypropylene.Therefore, Therefore, it be may expected thermal promising route route to utilize polypropylene. it may be be expected thatthat thermal plasma promising route to utilize polypropylene. Therefore, it may be expected that thermal plasma technology could be used in the utilization technology could be used in the utilizationofofother other polyolefins. polyolefins. technology could be used in the utilization of other polyolefins.
Selectivity HH(%) SelectivityofofCC (%) 2 22 2
90 90
80 80
70 70
60 60
50 50
12 12
14 14
16 16
18 18
20 20
22 22
24 24
26 26
Input power (kW) Input power (kW)
28 28
30 30
32 32
Figure 11. Variation in the selectivity of C2H2with with varied varied input power (Carrier gas flow rate: 1 Nm /h; 3 Figure 11. Variation in the selectivity ofof CC inputpower power (Carrier flow 1 3Nm 2H 22 with varied Figure 11. Variation in the selectivity 2H input (Carrier gasgas flow rate:rate: 1 Nm /h; /h; 3/h; feed rate: 17.65 g/min; magnetic flux intensity: 0.077 T). working gas flow rate: 5 Nm 3 3/h;feed working gas flow rate:rate: 5 Nm /h; 17.65g/min; g/min; magnetic intensity: working gas flow 5 Nm feed rate: rate: 17.65 magnetic fluxflux intensity: 0.0770.077 T). T). 100 100
100 100
90 90
90 90
80 80
80 80
Carbon Conversion Carbon Yield ofConversion C2H2 Yield of C2H2
70 70 60 60 50 50 40 40
70 70 60 60
Yield HH YieldofofCC 2 22 2
Carbon CarbonConversion Conversion(%) (%)
3
50 50
12 12
14 14
16 16
18 18
20 20
22 22
24 24
26 26
Input Power (kW) Input Power (kW)
28 28
30 30
40 3240 32
Figure 12. Variation in carbon conversion and the yield of C2H2 with varied input power (Carrier gas flow Figure 12. Variation in carbon conversion and the yield of C2H2 with varied input power (Carrier gas flow
3/h; feed rate: 17.65 g/min; magnetic flux intensity: 0.077 T). rate: Nm3/h; working gas flow rate: 5 Nmand Figure 12.1 Variation in carbon conversion the yield of C2 H2 with varied input power (Carrier gas rate: 1 Nm3/h; working gas flow rate: 5 Nm3/h; feed 3rate: 17.65 g/min; magnetic flux intensity: 0.077 T). 3 flow rate: 1 Nm /h; working gas flow rate: 5 Nm /h; feed rate: 17.65 g/min; magnetic flux intensity: 0.077 T).
Energies 2017, 10, 513
11 of 13 11 of 13
Specific Energy Consumption (kWh/kg-C2H2)
Energies 2017, 10, 513 80 70 60 50 40 30 20 10 0 12
14
16
18
20
22
24
26
28
30
32
Input Power (kW)
Figure 13. Variation in specific energy consumption of C2H2 with varied input power (Carrier gas flow Figure 13. Variation in specific energy consumption of C2 H2 with varied input power (Carrier gas rate: 1 Nm3/h; working gas flow rate: 5 Nm3/h; feed rate: 17.65 g/min; magnetic flux intensity: 0.077 T). flow rate: 1 Nm3 /h; working gas flow rate: 5 Nm3 /h; feed rate: 17.65 g/min; magnetic flux intensity: 0.077 T). 4. Conclusions
The feasibility of plasma pyrolysis of polyolefin for production of C2H2 using a rotating arc plasma reactor has been demonstrated for the first time on a laboratory scale, using powder of polyethylene and as model feedstock. The gaseous products were principally light The feasibility of PP plasma pyrolysis of polyolefin for production of C rotatingofarc plasma 2 H2 usingaamixture hydrocarbons, mostly C 2 H 2 along with some C 2 H 4 and CH 4 . Input power, feed rate and working gas reactor has been demonstrated for the first time on a laboratory scale, using powder of polyethylene flow werefeedstock. the primary parameters in this work. Carbon conversion increased with and PP asrate model The gaseousinvestigated products were principally a mixture of light hydrocarbons, the increase of input power and reached a peak of approximately 90–95% before it began to decrease mostly C2 H2 along with some C2 H4 and CH4 . Input power, feed rate and working gas flow rate were with further increase of input power. Lower input power was beneficial to higher selectivity and the primary parameters investigated in this work. Carbon conversion increased with the increase of lower SEC of C2H2. An increase of the feed rate would require higher input power to get the whole input power and reached a peak of approximately 90–95% before it began to decrease with further feedstock pyrolyzed, and would lead to a higher C2H2 concentration in product gas. Higher working increase input input power was beneficial higher selectivity and lower SEC ofaC2 H2 . gas of flow ratepower. would Lower lower the energy density, so a highertoinput power was required to achieve An increase of the feed rateWith would require higher control input power the whole feedstock better pyrolysis result. proper parameter in the to PEget pyrolysis, a product gaspyrolyzed, with and would lead to 10% a higher C2 H2 be concentration Higher working gas rate would approximately C2H2 could obtained, withina product selectivitygas. higher than 80%, a yield of flow C2H2 higher anddensity, a complete carbon input conversion, wellrequired as a SEC than 20 kWh/kg-C 2H2result. . lowerthan the 70%, energy so a higher poweraswas to lower achieve a better pyrolysis Impressive results were also obtained in the experiments on propylene pyrolysis. This work shows With proper parameter control in the PE pyrolysis, a product gas with approximately 10% C2 H2 could that DC with arc plasma is a promising forathe production C2H2 from be obtained, a selectivity higher method than 80%, yield of C2 H2ofhigher than polyolefins. 70%, and a Considering complete carbon the high value and limited sources of C2H2, and the fact that it is scarcely produced from petroleum conversion, as well as a SEC lower than 20 kWh/kg-C2 H2 . Impressive results were also obtained in and natural gas industry, this experiment creates a new opportunity for the high-value conversion of the experiments on propylene pyrolysis. This work shows that DC arc plasma is a promising method waste polyolefins, and is also instructive for the green production of C2H2 with much less CO2 for the production of C2 Hconsumption Considering the high value and limited sources of C H , 2 from polyolefins. discharge and energy than the calcium carbide method. In the future, more studies are 2 2 and the fact to that it is scarcely produced from petroleum and natural gas industry, thisefficient experiment needed improve the proposed method. For example, it is necessary to develop more creates a new opportunity for the high-value conversion of waste polyolefins, and is also instructive methods of recovering energy from the high temperature pyrolysis gas to reduce the energy cost, and for the green production of C with much and energy consumption than the calcium the characterization and of less the CO solid products from pyrolysis is also important to the 2 H2utilization 2 discharge overall economy of future, pyrolysis process. Theare pyrolysis kinds polymer waste needs be carbide method. In the more studies neededof to more improve theofproposed method. Fortoexample, studied as well. it is necessary to develop more efficient methods of recovering energy from the high temperature
4. Conclusions
pyrolysis gas to reduce the energy cost, and the characterization and utilization of the solid products Acknowledgement: The authors are grateful for the financial support from the National Key Research and from pyrolysis is also important to the overall economy of pyrolysis process. The pyrolysis of more Development Program of China (2016YFB0301800) and the National High Technology Research and kindsDevelopment of polymerProgram waste of needs be studied as well. Chinato (2015AA020201). Author Contributions: Qiwei Yang Baogen conceived and designedfrom the experiments; Ming and and Acknowledgments: The authors are and grateful forSuthe financial support the National KeyZhang Research Jie Ma performed the experiments; Guangdong Wen and Qilong Ren analyzed the data; Ming Zhang wrote the Development Program of China (2016YFB0301800) and the National High Technology Research and Development paper. Program of China (2015AA020201).
Author Contributions: Yang and Baogen Su conceived Conflicts of Interest:Qiwei The authors declare no conflict of interest.and designed the experiments; Ming Zhang and Jie Ma performed the experiments; Guangdong Wen and Qilong Ren analyzed the data; Ming Zhang wrote the paper. Conflicts of Interest: The authors declare no conflict of interest.
Energies 2017, 10, 513
12 of 13
Nomenclature mi Ci % mfs Cfs % U I X Se Y SEC
Flow rate of component i (g/min) Mass fraction of C in component i (%) Feed rate (g/min) Mass fraction of C in feedstock (%) Arc voltage (V) Arc current (A) Carbon conversion to gaseous product (%) Selectivity of acetylene (%) Yield of acetylene (%) Specific energy consumption of acetylene (%)
References 1. 2. 3.
4. 5. 6. 7.
8. 9. 10.
11. 12. 13. 14. 15. 16. 17. 18.
Moulay, S. Chemical modification of poly(vinyl chloride)-still on the run. Prog. Polym. Sci. 2010, 35, 303–331. [CrossRef] Hamad, K.; Kaseem, M.; Deri, F. Recycling of waste from polymer materials: An overview of the recent works. Polym. Degrad. Stab. 2013, 98, 2801–2812. [CrossRef] Achiliasa, D.S.; Roupakiasa, C.; Megalokonomosa, P.; Lappasb, A.A.; Antonakoub, E.V. Chemical recycling of plastic wastes made from polyethylene (LDPE and HDPE) and polypropylene (PP). J. Hazard. Mater. 2007, 149, 536–542. [CrossRef] [PubMed] Abreu, D.A.P.; Losada, P.P.; Angulo, I.; Cruz, J.M. Development of new polyolefin films with nanoclays for application in food packaging. Eur. Polym. J. 2007, 43, 2229–2243. [CrossRef] Pasti, L.; Melucci, D.; Contado, C.; Dondi, F.; Mingozzi, I. Calibration in thermal field flow fractionation with polydisperse standards: Application to polyolefin characterization. J. Sep. Sci. 2015, 25, 691–702. [CrossRef] Huang, S.-J. Polymer Waste management–biodegradation, incineration, and recycling. J. Macromol. Sci. A 1995, 32, 593–597. [CrossRef] He, M.; Xiao, B.; Hu, Z.; Liu, S.; Guo, X.; Luo, S. Syngas production from catalytic gasification of waste polyethylene: Influence of temperature on gas yield and composition. Int. J. Hydrogen Energy 2009, 34, 1342–1348. [CrossRef] Yu, J.; Sun, L.; Ma, C.; Qiao, Y.; Yao, H. Thermal degradation of PVC: A review. Waste Manag. 2016, 48, 300–314. [CrossRef] [PubMed] Conesa, J.A.; Font, R.; Marcilla, A.; Garcia, A.N. Pyrolysis of polyethylene in a fluidized bed reactor. Energy Fuels 1994, 8, 1238–1246. [CrossRef] Westerhout, R.W.J.; Waanders, J.; Kuipers, J.A.M.; Swaaij, W.P.M. Kinetics of the low-temperature pyrolysis of polyethene, polypropene, and polystyrene modeling, experimental determination, and comparison with literature models and data. Ind. Eng. Chem. Res. 1997, 36, 1955–1964. [CrossRef] Hınıslıoglu, ˘ S.; Agar, ˘ E. Use of waste high density polyethylene as bitumen modifier in asphalt concrete mix. Mater. Lett. 2004, 58, 267–271. [CrossRef] Ciliz, N.K.; Ekinci, E.; Snape, C.E. Pyrolysis of virgin and waste polypropylene and its mixtures with waste polyethylene and polystyrene. Waste Manag. 2004, 24, 173–181. [CrossRef] [PubMed] Christmann, W.; Kasiske, D.; Klöppel, K.D.; Partscht, H.; Rotard, W. Combustion of polyvinylchloride: An important source for the formation of PCDD/PCDF. Chemosphere 1989, 19, 387–392. [CrossRef] Ma, J.; Su, B.; Wen, G.; Ren, Q.; Yang, Y.; Yang, Q.; Xing, H. Kinetic modeling and experimental validation of the pyrolysis of propane in hydrogen plasma. Int. J. Hydrogen Energy 2016, 41, 22689–22697. [CrossRef] Yan, B.; Cheng, Y.; Cheng, Y. Particle-scale modeling of coal devolatilization behaviors for coal pyrolysis in thermal plasma reactors. AIChE J. 2014, 61, 913–921. [CrossRef] Zhang, M.; Xue, W.; Su, B.; Bao, Z.; Wen, G.; Xing, H.; Ren, Q. Conversion of glycerol into syngas by rotating DC arc plasma. Energy 2017, 123, 1–8. [CrossRef] Xu; Yang, X.; Sun, Y.; Zhang, J.; Song, J. MW-DC hybrid plasma conversion of natural gas to acetylene. Acta Chim. Sin. 2005, 63, 625–630. Gehrmann, K.; Schmidt, H. Pyrolysis of hydrocarbons using a hydrogen plasma. In Proceedings of the 8th World Petroleum Congress, Moscow, Russia, 13–18 June 1971.
Energies 2017, 10, 513
19. 20. 21. 22. 23. 24. 25. 26. 27. 28. 29.
13 of 13
Beiers, H.G.; Baumann, H.; Bittner, D.; Klein, J.; Jüntgen, H. Pyrolysis of some gaseous and liquid hydrocarbons in hydrogen plasma. Fuel 1988, 67, 1012–1016. [CrossRef] Tao, X.; Dai, W.; Chen, Q.; Yin, Y.; Dai, X. Experimental study on production of acetylene from natural gas by plasma jet. Nat. Gas Ind. 2006, 26, 131–134. Chen, H.; Xie, K. Thermodynamic analysis of the hydrogen-carbon system for acetylene production by plasma. Chin. J. Process Eng. 2002, 2, 112–117. Arena, U. Process and technological aspects of municipal solid waste gasification: A review. Waste Manag. 2012, 32, 625–639. [CrossRef] [PubMed] Sakai, S.; Hiraoka, M. Municipal solid waste incinerator residue recycling by thermal processes. Waste Manag. 2000, 20, 249–258. [CrossRef] Zhang, Q.; Dor, L.; Fenigshtein, D.; Yang, W.; Blasiak, W. Gasification of municipal solid waste in the Plasma Gasification Melting process. Appl. Energy 2012, 90, 106–112. [CrossRef] Kerzelis, R.; Mecius, V.; Valinciute, V.; Valincius, V. Waste and biomass treatment employing plasma technology. High Temp. Mater. Processes 2004, 8, 273–282. [CrossRef] Guddeti, R.R.; Knight, R.; Grossmann, E.D. Depolymerization of polyethylene using induction-coupled plasma technology. Plasma Chem. Plasma Process. 2000, 20, 37–64. [CrossRef] Guddeti, R.R.; Knight, R.; Grossmann, E.D. Depolymerization of polypropylene in an induction-coupled plasma (ICP) reactor. Ind. Eng. Chem. Res. 2000, 39, 1171–1176. [CrossRef] Chang, J.-S.; Gu, B.-W.; Looy, P.C.; Chu, F.-Y.; Simpson, C.J. Thermal plasma pyrolysis of used old tires for production of syngas. J. Environ. Sci. Health A 1996, 31, 1781–1799. [CrossRef] Baumann, H.; Bitter, D.; Beiers, H.G.; Klein, J.; Jüntgen, H. Pyrolysis of coal in hydrogen and helium plasmas. Fuel 1988, 67, 1120–1123. [CrossRef] © 2017 by the authors. Licensee MDPI, Basel, Switzerland. This article is an open access article distributed under the terms and conditions of the Creative Commons Attribution (CC BY) license (http://creativecommons.org/licenses/by/4.0/).