Digital Geographic Information Working Group. Devillers, R., and Jeansoulin, R., 2006. Fundamentals of Spatial Data Quality. London, ISTE. ISBN: 1905209568.
11th AGILE International Conference on Geographic Information Science 2008 University of Girona, Spain
Page 1 of 8
Quality Of Geographic Information Patchworks Patrick Maué, Sven Schade Institute for Geoinformatics, University of Münster (first.last)@uni-muenster.de
Abstract: Information asymmetry between Geographic Information (GI) providers and searching users is still the main hindrance for the integration of web-based GI. Two typical scenarios show that spatial variability of quality aspects is often neglected. In a first scenario (Volunteered Geographic Information, VGI), feature completeness is identified as a challenging quality aspect. Completeness of feature attributes poses challenges in the second scenario (merging national data to an international data set). For modelling and representing spatial variable quality aspects, we rely on well-known and mature methods. As one of the solutions, the region quad-tree is proposed for modelling the completeness of spatial data sets. Open research issues, especially for the field of VGI, emerge.
INTRODUCTION Distributing Geographic Information (GI) in the web poses new challenges for discovery and evaluation. Quality uncertainty (Akerlof, 1970) - the information asymmetry between the GI provider and searching user - is still the main hindrance for the integration of web-based, often user-created GI for critical applications that are part of many decision-making processes. Geographic data are an abstracted representation of the real, geographical world. They are commonly modelled as features with attributes (ISO/TC211, 2005). Their quality is „a measure of the difference between the data and the reality they represent, and becomes poorer as the data and the corresponding reality diverge“ (Goodchild, 2006). Specific quality aspects, for example the positional accuracy, can be directly attached to the features and feature attributes. Others can only be described in respect to the whole feature set. One of the latter is completeness of spatial data. This paper focuses on this quality aspect of GI. An in depth overview of this and other quality aspects can be found in (Guptill and Morrison, 1995; Veregin, 1999; Devillers and Jeansoulin, 2006) and in recent standards (ISO/TC-211 2003). Quality control mechanisms, which either rely on automated methods or thorough (peer-) reviews by specialists, are tools to ensure a minimum level of quality (ISO/TC211, 2003; Pyzdek and Keller, 2003). However, reviews and algorithms can only cover existing content. The do not help to prevent the lack of data. Especially in the case of GI, lack of completeness can span over several dimensions. Some areas can have missing attribute values (thematic), can have less coverage (spatial), or the data is not available for the whole time period (temporal). In some scenarios quality assurance cannot ensure completeness, and in these cases there needs to be a way to communicate the spatial heterogeneity of this quality. Especially the spatial variability of completeness is normally neglected, but plays an important role in the scenarios which will be introduced in the next section. The era of nationwide mapping agencies which are able to cover the whole country's area is on its decline (Goodchild, 2007). Future research needs to deal with datasets, which are actually patchworks (National Research Council, 2007). This paper contributes to this problem by showing the specific challenges for representing the patchwork in the meta-data of GI. For this purpose, two common scenarios are outlined below. Approaches to cope with arising challenges are discussed thereafter. The last section presents conclusions and an outline of future work.
11th AGILE International Conference on Geographic Information Science 2008 University of Girona, Spain
Page 2 of 8
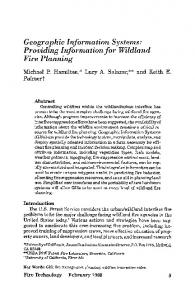
COMPLETENESS The term completeness is used to denote many different notions (figure 1). In this work, completeness is considered on the data level, model completeness is out of scope. Model completeness depends on the intended use, i.e. does a data model cover the subset of reality that is perceived by some application. This subset of reality is also called universe of discourse. In contrast data completeness targets usage independent errors of omission (Brassel et al., 1995). Defining errors of omission as the difference between the entities that are represented in a data set and those, which are present in the universe of discourse is topic to long discussions (Morrison, 1988; SDTS, 1992; Brassel et al., 1995).
Figure 1: Categorizing completeness, adopted and extended from (Brassel et al., 1995) Formal completeness considers the formal structure of a data set. Syntactical and structural rules, as well as the provision of meta-data need to be checked by according methods for quality control. Related aspects can be tested automatically. Aside the formatting issues that are addressed by formal completeness, feature completeness and attribute completeness deserve major consideration (Defence Mapping Agency, 1991). The former considers complete features, i.e. are all instances that fall under the used data model specifications, included in the data set. Attribute completeness targets the attributes of a feature, i.e. partial omission of information. Both aspects of completeness need to be considered separately for each feature type inside a spatial data model. Attribute completeness needs to be assessed separately for each feature type that is present in the data model. In addition to local attribute completeness, global attribute completeness may be used to indicate if attributes are missing for the complete data set. Depending on the kind of attribute (Chrisman, 2001),, spatial completeness can be distinguished from temporal completeness and thematic completeness. Measures for feature completeness and the varying aspects of attribute completeness can be given in estimated percentages (Brassel et al., 1995). These percentages should specify the relation between the number of features (respectively attributes) that are encoded in the data set and the total number of features (respectively attributes) that should be encoded using the considered type. In the case of spatial completeness, where the spatial attribute represents some spatial extent, the number can be replaced by the covered area. As elaborated in the next section, in some scenarios feature completeness and aspects of attribute completeness may vary over space, i.e. depending on the spatial extent of a data set. Some areas can have missing attribute values (thematic), can have less coverage (spatial), or the data is not available for the whole time period (temporal).
11th AGILE International Conference on Geographic Information Science 2008 University of Girona, Spain
Page 3 of 8
SCENARIOS This section presents two scenarios, which are common to today’s geographic information handling. The spatial variability of certain spatial data qualities has been a known problem for several years now, the following two examples focus on two recent applications where the lack of completeness is a common problem. Contributions by different parties – usually also of varying quality – to the data sets result in GI patchworks and meta-data management has to deal with this new challenge.
Scenario I - Volunteered Geographic Information Volunteered Geographic Information (VGI) is, according to Goodchild, a „special case of the more general Web phenomenon of user-generated content“ (Goodchild, 2007). Projects like OpenStreetMap 1 or Wikimapia 2 let anyone contribute to the collaboratively created GI, e.g. by mapping the street network or letting user annotate the displayed satellite images. As the name VGI already suggests this information is volunteered. It depends on the good-will and the expertise of the contributing users. No leading party exists which distributes tasks and determines which areas need to be mapped, or defines which areas are sufficiently complete. Compared to the commonly used GI provided by established mapping agencies, the structure of VGI is usually simple. But due to the continuous updates its structure is also highly dynamic and can change significantly over time.
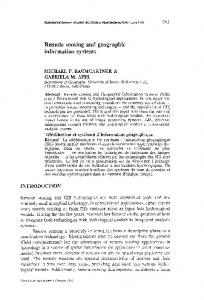
Figure 2: A volunteered street map of Münster, Germany (left) and Girona, Spain (right) Looking at the introduced taxonomy of completeness (figure 1), VGI is usually facing the problem of missing features. Figure 2 shows an example of the cities Münster (Germany) and Girona (Spain). Whereas in Münster all streets are present and even footpaths have been logged and uploaded, only very few streets in Girona are represented 3 . In addition to missing of whole features (feature incompleteness), lack of thematic attributes is usually an issue for VGI. In some cases geometries are provided, but the name of the street is missing
http://www.openstreetmap.org http://www.wikimapia.org 3 Compare to Google Maps: http://maps.g oogle.com/maps?ll=41.966893,2.80014&z=13 1 2
11th AGILE International Conference on Geographic Information Science 2008 University of Girona, Spain
Page 4 of 8
(thematic incompleteness). In the screen shot of Münster's street map, several streets have no labels attached to it. Incorrect geometry or topology appears, sometimes line strings may, for example, miss a connecting arc (spatial incompleteness). The third, temporal incompleteness, is not yet an issue for VGI. The goal of most projects is to represent the current state of the earth. The idea of showing the earth's past and its changes over time has not yet been introduced. The first two kinds of completeness occur, but are quite homogeneously distributed over space. Data about road names and small segments of streets are missing in many cases and no spatialdependency is discovered so far. In contrast, the former (feature completeness) depends on the considered spatial extent. Several reasons exist why certain areas of the globe are not mapped in such projects. All of them have in common that they are difficult or even impossible to avoid. Usually they have to be dealt with if VGI is going to be integrated into an application. On a global scale the digital divide is certainly the biggest problem. Most VGI projects depend on available hardware like GPS devices and laptops, which is a problem in less developed countries. Existing alternatives like the public domain Census Tiger data set leads to less coverage in other, similar projects like OpenStreetMap. Lack of such alternatives is actually the reason why such projects are initiated. On local scales we have also differences of completeness. Contributing volunteers, sometimes also coined spatially-aware people, are locals who want to see their own region (or city) represented in the project. If such enthusiasts do not exist for a particular area, the region remains unmapped unless someone without the local knowledge takes over. Due to these regions the result of the many contributions remains always a patchwork of parts, which are mapped with a very high quality and many which aren't mapped at all.
Scenario II – Cross Border Patchwork(s) Another setting, where a patchwork of different levels of completeness appears regularly, is given by cases where originally heterogeneous data from well-known sources is merged to comprehensive features sets. Especially in the frequently appearing cross-border scenarios in Europe (INSPIRE 2004) the quality of the data sets of different countries can vary significantly. Here national data sets that represent a specific domain are merged to data sets, which cover the spatial extent of Europe. Choosing the lowest common denominator is the usual approach, resulting in a map that has been deliberately stripped of certain attributes or features of higher quality. Such a merging process can be compared with the JOIN-operation which combines records of two tables in a database. Either a natural JOIN is performed, which results in a table only containing the relations with matching attributes of both source tables. Or, an outer JOIN is used, which includes all relations of both tables, filling up non-present attributes with null-values. Resulting data might be less usable and might even be inconsistent, but all the information that has existed before the application of the merging operation is preserved. The result of merging two spatial datasets, normally with the UNIONoperation, still needs to comply with a given schema. The feature type in the new resulting dataset has all the attributes defined in both of the source schemas, but the features have – usually – never values for all of their attributes. This information needs to be communicated to the evaluating user who wants to decide if the given data set fits his purpose. Again, a data patchwork with heterogeneous quality is generated, and needs to be represented. Both introduced scenarios lack completeness, but the category can differ. Whereas VGI usually ships with feature incompleteness, users of merged GI have to deal with the lack of attribute completeness, most often in its spatial and thematic dimension. The following section introduces an approach for encoding and representing the spatial variability of incompleteness of such GI.
HANDLING THE SPATIAL VARIABILITY OF DATA QUALITY ASPECTS Various metaphors have been proposed to visualize the spatial variability of data quality. Areas with, for example, less certainty can be blurred, less saturated, or displayed in different colours.
11th AGILE International Conference on Geographic Information Science 2008 University of Girona, Spain
Page 5 of 8
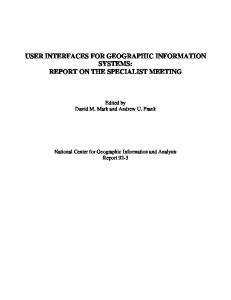
Another interesting idea which seems particularly well suited for the lack of completeness is a fog cover which hides unmapped areas (MacEachren, 1992). Graded representation of completeness is not possible with fog, but defining different levels of completeness seems to be arbitrary anyway. But it is possible to define a threshold: either the map is complete (all existing paths have been mapped) or has reached a certain level of completeness (streets are mapped, but not the foot paths). Regardless of which metaphor is used for the visualization of spatial variability, we need to reconsider our view on meta-data for GI as a text-based document with a fixed set of fields for describing the nature of the data. This holds especially for completeness reports (Brassel et al., 1995). Meta-data needs to comprise all information required for the evaluation of GI's fitness of use, which means one should be able to annotate GI with all kinds of appropriate information (coming in different forms like images or even audio annotations). In addition, VGI like the OpenStreetMap are often updated (GPS traces are uploaded to OpenStreetMaps in a frequency of less than one set of traces per 30 minutes). Meta-data needs to be updated frequently to represent this continuous change of the described data. Checking for thematic completeness of formal completeness can be performed mostly automatically by simply testing if values are present for the existing attributes. Detecting feature completeness of even spatial completeness of the data is a more challenging problem. Looking at the two screen shots (figure 2), one can clearly see that the street network of Girona is not yet complete. Determining if the street network of Münster is complete is not as easy. Finding areas, which lack completeness, is simpler than telling that a certain area as reached full (which means, a certifiable level of) completeness. The usual approach for determining quality is the comparison with other data sets, the “golden standard”, which have been identified as complete. But VGI often includes information that has never been mapped before. Finding a “golden standard” can be difficult here. Wikipedia, an also volunteered collaborative effort to create a free online encyclopaedia, relies on a user-driven peer review. Users can mark incomplete or just too short articles as stubs 4 , which should give other users the incentive to contribute and complete the article. In case of VGI, users might have the possibility to mark regions, which lack in their view contributions and require more work. For the development of a meta-data structure for GI, spatial variability of quality aspects like completeness should be taken into account. One possible way to encode the spatial variability would be to add an additional layer for each quality aspect in question to the dataset. By this quality aspects become geospatial information in their own right. They can be mapped using the above mentioned techniques. Feature completeness, for example, is continuous over space. An according layer would need some field-model for the representation. The question of a suited discretization (Goodchild, 1993) remains. Choropleth maps and isolines suggest a precision in this information which does not exist. Exact borders between areas with a certain level of completeness would be arbitrary lines which do no reflect the true nature of this quality aspect. A better approach for visualising spatially varying quality aspects, which is less precise but does also require far less resources in terms of space, is a well-known hierarchical structure for the twodimensional space: the region quad-tree (figure 3). A raster model for fields is applied to the area. The area of the map is decomposed into four equal quadrants, which again can be divided into four quadrants, and so on (Rigaux et al., 2001; Kardos et al., 2005).
4
Find out about it here: http://en.wikipedia.org/wiki/Wikipedia:Stub
11th AGILE International Conference on Geographic Information Science 2008 University of Girona, Spain
Page 6 of 8
Figure 3: Example of encoding spatial variability with the help of the region quad-tree Identifying a geospatial data set matching my requirements often implies to choose between several search results. Displaying the spatial variability of quality aspects needs to be intuitive and user-friendly to make quick understanding of the varying quality possible. The region quad-tree is an efficient way to encode the required information and is therefore an appropriate solution for fast visualisation.
CONCLUSIONS AND FUTURE WORK We gave a short overview on spatial variability of spatial data quality, with focus on completeness as one of GI's external qualities. Two common scenarios, the new phenomenon of volunteered GI and the often occurring integration of cross-border GI, were introduced and its implications with completeness were discussed. For modelling and representing the quality we can rely on well-known and mature methods. One of the more common solutions, the region quad-tree, has been discussed for modelling the spatially varying information about certain spatial data qualities. The region quad-tree enables reasonable high precision with minimum overhead, and its widespread use ensures the support of freely available algorithms and software packages to create such models. The paper was focussed on the completeness of GI, but the presented methods can as well be applied to other spatial data qualities as long as it affects the feature set (and not the features itself) and it varies over space. Some of the questions, which remain unanswered, are concerned with the provider and the user of VGI. Who is defining the incompleteness of spatial data? How can we communicate spatial data qualities and their spatial variability intuitively to address not only specialists but also the untrained users (who actually are the target audience of VGI platforms)? Who benefits of higher quality data? Why should user volunteer to improve the quality of VGI? Watching and studying the communities evolving around existing VGI platforms might help to find answers to some of these questions. The challenge regarding the supply of quality information is the most basic problem. Whereas national data providers are clearly responsible and capable for describing the quality of their data set in crossboarder scenarios, responsibilities and generation methods for VGI are not researched yet. Solutions like the region quad-tree are well established since decades, but using them for visualising quality information is an approach yet to come. The intention of this paper is not to not reinvent the wheel and propose yet another solution. It is rather an attempt to change our mindsets
11th AGILE International Conference on Geographic Information Science 2008 University of Girona, Spain
Page 7 of 8
towards GI's meta-data, and to take quality in meta-data seriously. Quality of spatial data is and has always been a neglected issue within GI science, and with evolving applications for VGI and their use also within quality-critical applications (for example for participatory GIS), this lack of solutions for managing and communicating quality gets even more apparent. Future research, and also future VGI applications, have to find new methods to include spatial data quality as well as quality control methods, and in particular raise awareness for the problem.
Acknowledgements This research has been supported by the EU-IST Project No. FP6-26514 (SWING). We like to
thank the reviewers for their valuable comments. BIBLIOGRAPHY Akerlof, G.A. The Market for 'Lemons': Quality Uncertainty and the Market Mechanism. In Quarterly Journal of Economics 84(3). The MIT Press: 488–500, 1970. Brassel, K., and F. Bucher, et al., Completeness. In: Guptill, SC and Morrison, JL (ed.) Elements of Spatial Data Quality. Pergamon Press Inc. 1995. Chrisman, N., 2001. Exploring Geographic Information Systems. Wiley. ISBN: 0471314250. Defence Mapping Agency, 1991. Digital geographic information exchange standard (DIGEST). Digital Geographic Information Working Group. Devillers, R., and Jeansoulin, R., 2006. Fundamentals of Spatial Data Quality. London, ISTE. ISBN: 1905209568 Goodchild, M.F., The state of GIS for environmental problem solving. In: Goodchild, MF, Parks, BO and Steyaert, LT (ed.) Environmental Modelling with GIS. New York, Oxford University Press: 8-15, 1993. Goodchild, M.F., Foreword. In: Devillers, R and Jeansoulin, R (ed.) Fundamentals of Spatial Data Quality. London, ISTE: 13–16, 2006. Goodchild, M.F., Citizen as Sensors: The World of Volunteered Geography. In: Workshop on Volunteered Geographic Information. Santa Barbara, CA, 2007. Goodchild, M.F., Citizens as voluntary sensors: spatial data infrastructure in the world of Web 2.0. In: M. Craglia (ed.). International Journal of Spatial Data Infrastructures Research (2): 24–32, 2007. Guptill, S.C., and J.L. Morrison, 1995. Elements of Spatial Data Quality (The International Cartographic Association). Pergamon Press Inc. ISBN: 0080424325. INSPIRE (2004) INSPIRE scoping paper. ISO/TC211 (2003) 19114 Geographic information — Quality evaluation procedures. ISO/TC211 (2005) 19109 Geographic information – Rules for application schema. ISO/TC-211 (2003) ISO 19115:2003. Geographic information - Metadata, International Organization for Standardization Kardos, J. and G. Benwell, et al. The Visualisation of Uncertainty for Spatially Referenced Census Data Using Hierarchical Tessellations. In: J. Wilson, A. Fotheringham, G. Hunter (ed.) Transactions in GIS 9(1): 19–34. 2005.
11th AGILE International Conference on Geographic Information Science 2008 University of Girona, Spain
Page 8 of 8
MacEachren, A.M., Visualizing Uncertain Information. In: Cartographic Perspective (13): 10-19. 1992. Morrison, J.L., The proposed standard for digital cartographic data. In: The American Cartographer (15): 129-135. 1988. National Research Council, 2007. Successful Response Starts with a Map: Improving Geospatial Support for Disaster Management Press. N. Academies. Washington, DC. ISBN: 0309103401. Pyzdek, T. and P.A. Keller, 2003. Quality Engineering Handbook. CRC Press. ISBN: 0824746147 Rigaux, P., M. Scholl, and A. Voisard, 2001. Spatial Databases: With Application to GIS. Morgan Kaufmann. ISBN: 1558605886. SDTS, 1992. Spatial Data Transfer Standard (SDTS). U.S. Department of Commerce. Veregin, H., Data Quality Parameters. In: Longley, P. (ed) Geographical Information Systems – Principles and Technical Issues. New York, Wiley & Sons. 177-190. 1999.