(section 5.2.1); (2) best-practices rules promoted by BPMN practitioners in the ..... With Software as a Service (SaaS) adoption, organizations do not need to host ...... BPMN models as Error Free, which is the same as the probability of getting a error free ...... ness process must be carefully administered, by the service desk.
Anacleto Cortez e Correia Mestre
Quality of Process Modeling Using BPMN: A Model-Driven Approach
Dissertação para obtenção do Grau de Doutor em Engenharia Informática
Orientador : Professor Doutor Fernando Manuel Pereira da Costa Brito e Abreu, Professor Associado, DCTI/ISCTE-IUL e CITI/FCT/UNL Co-orientador : Professor Doutor Vasco Miguel Moreira do Amaral, Professor Auxiliar, CITI/FCT/UNL
Júri: Presidente:
Luís M. M. da Costa Caires, Professor Catedrático, DI/FCT/UNL
Arguentes:
Geert Poels, Professor Catedrático, Ghent University, Bélgica Toacy Cavalcante de Oliveira, Professor Auxiliar, UFRJ
Vogais:
Ana Maria Dinis Moreira, Professora Associada, DI/FCT/UNL Fernando Brito e Abreu, Professor Associado, DCTI/ISCTE-IUL Paulo Rupino da Cunha, Professor Auxiliar, DEI/FCT/UC Miguel L. B. Mira da Silva, Professor Auxiliar, DEI/IST/UTL
January, 2014
[This page is intentionally blank]
iii
Quality of Process Modeling Using BPMN: A Model-Driven Approach A elaboração desta tese beneficiou do regime de isenção de propinas de doutoramento, no âmbito do Protocolo de Cooperação existente entre a faculdade de Ciências e Tecnologia da Universidade Nova de Lisboa e o Instituto Politécnico de Setúbal. c Anacleto Cortez e Correia, Faculdade de Ciências e Tecnologia, UniversiCopyright dade Nova de Lisboa A Faculdade de Ciências e Tecnologia e a Universidade Nova de Lisboa têm o direito, perpétuo e sem limites geográficos, de arquivar e publicar esta dissertação através de exemplares impressos reproduzidos em papel ou de forma digital, ou por qualquer outro meio conhecido ou que venha a ser inventado, e de a divulgar através de repositórios científicos e de admitir a sua cópia e distribuição com objectivos educacionais ou de investigação, não comerciais, desde que seja dado crédito ao autor e editor.
[This page is intentionally blank]
To Flora, Alexandre and Guilherme and to the memory of my mother
[This page is intentionally blank]
Acknowledgements
I would like to thank all the people who have helped me through the years along the route. I thank my supervisors, Professor Doutor Fernando Brito e Abreu and Professor Doutor Vasco Amaral, as well as the members of the CAT, Professors Mira da Silva and Paulo Rupino for helping me through their comments and reviews in several phases of this work, namely when it was important to focus on the core of the research and delimiting its scope. I would also like to acknowledge the UAIIDE-IPS, specially Sandra Silva and Cláudia Louro, for providing me all the necessary logistic support. I want to emphasize my special appreciation to the President of the Institituto Politécnico de Setúbal (IPS), Professor Armando Pires, for his strategic vision and the contribution for the enhancement of the IPS’s prominence as academic institution. The leadership of Professor Armando Pires allowed IPS’s lecturers and myself, to benefit from the Programa Formação Avançada he promoted. This praiseworthy initiative was subsequently supplemented by the PROTEC program sponsored through the Fundação para a Ciência e Tecnologia. I express my gratitude to the teachers and colleagues of the Departamento de Informática of the Faculdade de Ciências e Tecnologia, Universidade Nova de Lisboa (FCT/UNL), namely those whose classes I attended in the preparation’s year of the PhD, Professors José Alferes, João Araújo, Miguel Monteiro, and Miguel Goulão. A special acknowledgment goes to my colleague Jorge Freitas, who helped me upon the academic integration at the FCT. My PhD’s compagnons de route Sérgio Bryton and Luís Silva, also helped me with their comments and support. I also greatly acknowledge my fellows José Pereira and Nuno Gonçalves at Escola Superior de Tecnologia (IPS-EST), who assisted me collecting data for the quasi-experiment carried out on this dissertation. To all who made bearable the challenging moments through their friendship, specially Francisco Mendeiros, Nelson, Judite, Martiniano, and their families. My special thanks to my wife Flora, and my sons Alexandre and Guilherme, for their love and support.
vii
[This page is intentionally blank]
Abstract
Context: The BPMN 2.0 specification contains the rules regarding the correct usage of the language’s constructs. Practitioners have also proposed best-practices for producing better BPMN models. However, those rules are expressed in natural language, yielding sometimes ambiguous interpretation, and therefore, flaws in produced BPMN models. Objective: Ensuring the correctness of BPMN models is critical for the automation of processes. Hence, errors in the BPMN models specification should be detected and corrected at design time, since faults detected at latter stages of processes’ development can be more costly and hard to correct. So, we need to assess the quality of BPMN models in a rigorous and systematic way. Method: We follow a model-driven approach for formalization and empirical validation of BPMN well-formedness rules and BPMN measures for enhancing the quality of BPMN models. Results: The rule mining of BPMN specification, as well as recently published BPMN works, allowed the gathering of more than a hundred of BPMN well-formedness and best-practices rules. Furthermore, we derived a set of BPMN measures aiming to provide information to process modelers regarding the correctness of BPMN models. Both BPMN rules, as well as BPMN measures were empirically validated through samples of BPMN models. Limitations: This work does not cover control-flow formal properties in BPMN models, since they were extensively discussed in other process modeling research works. Conclusion: We intend to contribute for improving BPMN modeling tools, through the formalization of well-formedness rules and BPMN measures to be incorporated in those tools, in order to enhance the quality of process modeling outcomes.
ix
x Keywords: business process modeling - measurement - measures - model driven engineering - model driven architecture - BPMN - quality
Resumo
Contexto: O standard BPMN 2.0 contém regras sobre a correta utilização dos elementos da linguagem. Peritos da indústria têm também proposto boas práticas para o melhor desenho de modelos BPMN. No entanto, essas regras estão expressas em linguagem natural, sendo por isso susceptíveis de gerar múltiplas interpretações e consequentemente modelos incorrectos. Objectivo: Garantir a correcção dos modelos BPMN é fundamental para a automação de processos. Erros existentes em modelos BPMN, devem ser detectados e corrigidos durante o seu desenho, e não em fases posteriores do desenvolvimento dos processos, onde se torna mais caro e difícil efectuar essa correção. É necessário por isso avaliar a qualidade de modelos BPMN de uma forma rigorosa e sistemática. Método: Foi seguida uma abordagem orientada por modelos para a formalização e validação empírica de regras de construção de modelos BPMN, bem como de métricas para modelos BPMN, a fim de melhorar a qualidade dos modelos produzidos. Resultados: A recolha de regras de embebidas na especificação BPMN, bem como em obras recentemente publicadas sobre BPMN, permitiu coligir mais de uma centena de regras de construção e de boas práticas no desenho de modelos BPMN. Além disso, foi proposto um conjunto de métricas BPMN com o objetivo de fornecer informações relacionada com a correcção dos modelos BPMN, durante a modelação de processos. Tanto as regras como as métricas BPMN, foram empiricamente validados através de amostras estatísticas. Limitações: Este trabalho não cobre propriedades formais relativas ao controlo de fluxo de modelos BPMN. Conclusões: O presente trabalho pretende contribuir para a melhoria de ferramentas de modelação BPMN, embebendo nelas regras de construção de modelos, assim como métricas, a fim de melhorar os resultados da modelação de processos BPMN. xi
xii Palavras-chave: modelação de processos de negócio - medição - medidas - engenharia orientada por modelos - arquitectura orientada por modelos - BPMN - qualidade
Table of Contents
Abstract . . . . . . . . . . . . . . . . . . . . . . . . . . . . . . . . . . . . . . . . . . Table of Contents
ix xviii
Dissertation
3
1
Introduction
3
1.1
Introduction . . . . . . . . . . . . . . . . . . . . . . . . . . . . . . . . . . . .
4
1.2
Research Drivers . . . . . . . . . . . . . . . . . . . . . . . . . . . . . . . . .
5
1.2.1
Research Problems . . . . . . . . . . . . . . . . . . . . . . . . . . . .
5
1.2.2
Research Questions . . . . . . . . . . . . . . . . . . . . . . . . . . . .
6
1.2.3
Thesis Statement . . . . . . . . . . . . . . . . . . . . . . . . . . . . .
6
1.2.4
Main Contributions . . . . . . . . . . . . . . . . . . . . . . . . . . . .
6
1.3
Dissertation Outline . . . . . . . . . . . . . . . . . . . . . . . . . . . . . . .
7
1.4
Conclusion . . . . . . . . . . . . . . . . . . . . . . . . . . . . . . . . . . . . .
8
2
Process Modeling
11
2.1
The Process Paradigm . . . . . . . . . . . . . . . . . . . . . . . . . . . . . .
12
2.2
The Business Process Perspective . . . . . . . . . . . . . . . . . . . . . . . .
15
2.3
Other Process Engineering Approaches . . . . . . . . . . . . . . . . . . . .
17
2.3.1
Process Engineering . . . . . . . . . . . . . . . . . . . . . . . . . . .
17
2.3.2
Systems Engineering . . . . . . . . . . . . . . . . . . . . . . . . . . .
18
2.3.3
Industrial Engineering . . . . . . . . . . . . . . . . . . . . . . . . . .
18
2.3.4
Quality Engineering . . . . . . . . . . . . . . . . . . . . . . . . . . .
18
2.3.5
Performance Engineering . . . . . . . . . . . . . . . . . . . . . . . .
19
2.3.6
Software Engineering . . . . . . . . . . . . . . . . . . . . . . . . . .
19
2.3.7
Other Initiatives . . . . . . . . . . . . . . . . . . . . . . . . . . . . . .
20
Quality in Process Modeling . . . . . . . . . . . . . . . . . . . . . . . . . . .
20
2.4.1
20
2.4
Process-Oriented Approach . . . . . . . . . . . . . . . . . . . . . . . xiii
xiv
TABLE OF CONTENTS 2.4.2 2.5
2.6 3
Process Modeling Languages . . . . . . . . . . . . . . . . . . . . . . . . . .
23
2.5.1
A Taxonomy for BPMLs . . . . . . . . . . . . . . . . . . . . . . . . .
24
2.5.2
Characterization of BPMLs . . . . . . . . . . . . . . . . . . . . . . .
26
2.5.3
Assessment of BPMLs . . . . . . . . . . . . . . . . . . . . . . . . . .
44
Conclusion . . . . . . . . . . . . . . . . . . . . . . . . . . . . . . . . . . . . .
45 47
3.1
Introduction . . . . . . . . . . . . . . . . . . . . . . . . . . . . . . . . . . . .
48
3.2
Modeling with BPMN . . . . . . . . . . . . . . . . . . . . . . . . . . . . . .
49
3.3
BPMN Metamodel . . . . . . . . . . . . . . . . . . . . . . . . . . . . . . . .
54
3.3.1
Detail of BPMN Metamodel . . . . . . . . . . . . . . . . . . . . . . .
55
3.3.2
Flaws in the Metamodel . . . . . . . . . . . . . . . . . . . . . . . . .
57
3.3.3
Concepts not Covered & Proposed Extensions to BPMN . . . . . .
59
Weaknesses of the BPMN standard . . . . . . . . . . . . . . . . . . . . . . .
60
3.4.1
A Set of Rules for Assessing BPMN Tools . . . . . . . . . . . . . . .
60
3.4.2
A Model-snippet for BPMN Tools’ Evaluation . . . . . . . . . . . .
62
3.4.3
Results of Tools’ Assessment . . . . . . . . . . . . . . . . . . . . . .
62
Conclusion . . . . . . . . . . . . . . . . . . . . . . . . . . . . . . . . . . . . .
64
3.5
State-of-the-Art on Quality in Process Modeling
65
4.1
Introduction . . . . . . . . . . . . . . . . . . . . . . . . . . . . . . . . . . . .
66
4.2
Quality on Process Modeling . . . . . . . . . . . . . . . . . . . . . . . . . .
67
4.2.1
Quality Verification . . . . . . . . . . . . . . . . . . . . . . . . . . . .
67
4.2.2
Quality Measurement . . . . . . . . . . . . . . . . . . . . . . . . . .
68
Verification of BPMN Models . . . . . . . . . . . . . . . . . . . . . . . . . .
69
4.3.1
Systematic Review . . . . . . . . . . . . . . . . . . . . . . . . . . . .
69
4.3.2
Protocol Instantiation . . . . . . . . . . . . . . . . . . . . . . . . . .
70
4.3.3
BPMN Formal Verification Methods . . . . . . . . . . . . . . . . . .
76
4.3.4
Conclusions on Verification of BPMN Models . . . . . . . . . . . .
77
4.4
Measurement of BPMN Models . . . . . . . . . . . . . . . . . . . . . . . . .
78
4.5
Conclusion . . . . . . . . . . . . . . . . . . . . . . . . . . . . . . . . . . . . .
79
4.3
5
22
Analysis of the BPMN
3.4
4
Product-Oriented Approach . . . . . . . . . . . . . . . . . . . . . . .
Verification of BPMN Models
81
5.1
Introduction . . . . . . . . . . . . . . . . . . . . . . . . . . . . . . . . . . . .
82
5.2
BPMN Rules Formalization . . . . . . . . . . . . . . . . . . . . . . . . . . .
83
5.2.1
Well formedness Rules . . . . . . . . . . . . . . . . . . . . . . . . . .
84
5.2.2
Best-practices Rules . . . . . . . . . . . . . . . . . . . . . . . . . . .
88
Conclusion . . . . . . . . . . . . . . . . . . . . . . . . . . . . . . . . . . . . .
91
5.3
TABLE OF CONTENTS
xv
6
Measurement of BPMN Models
93
6.1
Introduction . . . . . . . . . . . . . . . . . . . . . . . . . . . . . . . . . . . .
94
6.2
Terminology on Process Modeling Measurement . . . . . . . . . . . . . . .
95
6.3
A Framework for Measurement of BPMN Models . . . . . . . . . . . . . . 100
6.4
6.5 7
Overview . . . . . . . . . . . . . . . . . . . . . . . . . . . . . . . . . 100
6.3.2
Detailed Activities . . . . . . . . . . . . . . . . . . . . . . . . . . . . 102
Measures Derivation for BPMN Process Models . . . . . . . . . . . . . . . 108 6.4.1
BPMN Measurement Inception . . . . . . . . . . . . . . . . . . . . . 108
6.4.2
Definition of Base Measures for Internal Attributes . . . . . . . . . 111
6.4.3
Definition of Indirect Measures for External Attributes . . . . . . . 118
Conclusion . . . . . . . . . . . . . . . . . . . . . . . . . . . . . . . . . . . . . 121
Model Driven Approach for BPMN Verification and Measurement
123
7.1
Introduction . . . . . . . . . . . . . . . . . . . . . . . . . . . . . . . . . . . . 124
7.2
Process Modeling in Model Driven Engineering . . . . . . . . . . . . . . . 125
7.3
7.4 8
6.3.1
7.2.1
BPMN in the context of MDA . . . . . . . . . . . . . . . . . . . . . . 127
7.2.2
Model-based Testing of BPMN Models . . . . . . . . . . . . . . . . 132
Instantiation for BPMN Verification and Measurement . . . . . . . . . . . 134 7.3.1
BPMN Models’ Verification and Measurement . . . . . . . . . . . . 135
7.3.2
Data Collection for Empirical Validation . . . . . . . . . . . . . . . 140
Conclusion . . . . . . . . . . . . . . . . . . . . . . . . . . . . . . . . . . . . . 143
Empirical Studies on BPMN Verification
145
8.1
Introduction . . . . . . . . . . . . . . . . . . . . . . . . . . . . . . . . . . . . 146
8.2
Choosing the Research Method . . . . . . . . . . . . . . . . . . . . . . . . . 147
8.3
8.4
8.5
8.2.1
Presenting Research Methods . . . . . . . . . . . . . . . . . . . . . . 147
8.2.2
Scientific Method’s Instantiation for BPMN Experiments . . . . . . 150
Empirical Studies’ Definition . . . . . . . . . . . . . . . . . . . . . . . . . . 151 8.3.1
Addressing Research Problems . . . . . . . . . . . . . . . . . . . . . 151
8.3.2
Addressing Research Questions and Objectives . . . . . . . . . . . 152
8.3.3
Context Definition . . . . . . . . . . . . . . . . . . . . . . . . . . . . 153
First Empirical Study . . . . . . . . . . . . . . . . . . . . . . . . . . . . . . . 154 8.4.1
Empirical Study Planning . . . . . . . . . . . . . . . . . . . . . . . . 154
8.4.2
Empirical Study Execution . . . . . . . . . . . . . . . . . . . . . . . 164
8.4.3
Empirical Study Data Analysis . . . . . . . . . . . . . . . . . . . . . 165
8.4.4
Empirical Study Results . . . . . . . . . . . . . . . . . . . . . . . . . 179
Second Empirical Study . . . . . . . . . . . . . . . . . . . . . . . . . . . . . 183 8.5.1
Empirical Study Planning . . . . . . . . . . . . . . . . . . . . . . . . 184
8.5.2
Empirical Study Execution . . . . . . . . . . . . . . . . . . . . . . . 190
8.5.3
Empirical Study Data Analysis . . . . . . . . . . . . . . . . . . . . . 190
8.5.4
Empirical Study Results . . . . . . . . . . . . . . . . . . . . . . . . . 195
xvi
TABLE OF CONTENTS 8.6
9
Conclusion . . . . . . . . . . . . . . . . . . . . . . . . . . . . . . . . . . . . . 198
Empirical Study on BPMN Measurement
201
9.1
Introduction . . . . . . . . . . . . . . . . . . . . . . . . . . . . . . . . . . . . 202
9.2
BPMN Measurement Empirical Study . . . . . . . . . . . . . . . . . . . . . 203
9.3
Empirical Study Definition . . . . . . . . . . . . . . . . . . . . . . . . . . . . 203
9.4
9.3.1
Addressing Research Problem . . . . . . . . . . . . . . . . . . . . . 203
9.3.2
Addressing Research Questions and Objectives . . . . . . . . . . . 204
9.3.3
Context Definition . . . . . . . . . . . . . . . . . . . . . . . . . . . . 205
Empirical Study Planning . . . . . . . . . . . . . . . . . . . . . . . . . . . . 205 9.4.1
Goals . . . . . . . . . . . . . . . . . . . . . . . . . . . . . . . . . . . . 205
9.4.2
Hypotheses and Variables . . . . . . . . . . . . . . . . . . . . . . . . 206
9.4.3
Subjects selection . . . . . . . . . . . . . . . . . . . . . . . . . . . . . 207
9.4.4
Experimental Design . . . . . . . . . . . . . . . . . . . . . . . . . . . 207
9.4.5
Collection Procedure . . . . . . . . . . . . . . . . . . . . . . . . . . . 208
9.4.6
Analysis Procedure . . . . . . . . . . . . . . . . . . . . . . . . . . . . 208
9.4.7
Instrumentation . . . . . . . . . . . . . . . . . . . . . . . . . . . . . . 208
9.5
Empirical Study Execution . . . . . . . . . . . . . . . . . . . . . . . . . . . . 209
9.6
Empirical Study Data Analysis . . . . . . . . . . . . . . . . . . . . . . . . . 209
9.7
9.8
9.6.1
Data Description . . . . . . . . . . . . . . . . . . . . . . . . . . . . . 209
9.6.2
Hypotheses Testing . . . . . . . . . . . . . . . . . . . . . . . . . . . . 211
Empirical Study Results . . . . . . . . . . . . . . . . . . . . . . . . . . . . . 217 9.7.1
Interpretation . . . . . . . . . . . . . . . . . . . . . . . . . . . . . . . 217
9.7.2
Inferences . . . . . . . . . . . . . . . . . . . . . . . . . . . . . . . . . 218
9.7.3
Lessons Learned . . . . . . . . . . . . . . . . . . . . . . . . . . . . . 219
Conclusion . . . . . . . . . . . . . . . . . . . . . . . . . . . . . . . . . . . . . 219
10 Conclusion
221
10.1 Synthesis . . . . . . . . . . . . . . . . . . . . . . . . . . . . . . . . . . . . . . 222 10.2 Contributions . . . . . . . . . . . . . . . . . . . . . . . . . . . . . . . . . . . 223 10.2.1 Major Contributions . . . . . . . . . . . . . . . . . . . . . . . . . . . 224 10.2.2 Minor Contributions . . . . . . . . . . . . . . . . . . . . . . . . . . . 224 10.3 Future Work . . . . . . . . . . . . . . . . . . . . . . . . . . . . . . . . . . . . 225
Appendixes
259
Glossary
259
A Process Modeling Languages
265
A.1 Other Process Modeling Languages . . . . . . . . . . . . . . . . . . . . . . 265 A.2 Formalizations of BPMN Verification . . . . . . . . . . . . . . . . . . . . . . 266 A.2.1 Communicating Sequential Processes . . . . . . . . . . . . . . . . . 266
TABLE OF CONTENTS
xvii
A.2.2 Petri Nets . . . . . . . . . . . . . . . . . . . . . . . . . . . . . . . . . 267 A.2.3 Web Ontology Language . . . . . . . . . . . . . . . . . . . . . . . . 267 A.2.4 Abstract State Machines . . . . . . . . . . . . . . . . . . . . . . . . . 268 B A Catalog of BPMN Patterns and Anti-Patterns (Sample)
271
B.1 A Top-Level Process can only be instantiated by a restricted set of Start Events types . . . . . . . . . . . . . . . . . . . . . . . . . . . . . . . . . . . . 271 B.2 Outgoing Sequence Flow not allowed in an End Event. . . . . . . . . . . . 272 B.3 Outgoing Message Flow not allowed in a Catch Event. . . . . . . . . . . . 273 B.4 A Catch Event with incoming Message Flow must have Message or Multiple type . . . . . . . . . . . . . . . . . . . . . . . . . . . . . . . . . . . . . . . 274 B.5 Explicit Start/End Events do not allow Activities or Gateways without incoming/outgoing Sequence Flow . . . . . . . . . . . . . . . . . . . . . . . . 275 B.6 A conditional Sequence Flow cannot be used if there is only one sequence flow out of the element . . . . . . . . . . . . . . . . . . . . . . . . . . . . . . 276 B.7 A Boundary Event must have exactly one outgoing Sequence Flow (unless it has the Compensation type) . . . . . . . . . . . . . . . . . . . . . . . . . . 277 B.8 Use a Timer Intermediate Event with an Event Gateway . . . . . . . . . . . 278 B.9 Use a Default Condition at an Exclusive Gateway . . . . . . . . . . . . . . 279 B.10 Two Activities in the same Process should not have the same name . . . . 280 C Data Collection for a Survey on Effectiveness of Current BPMN Tools on Detection of Rules Violations on Process Models
281
D Sample of BPMN Process Models used in Empirical Validation
287
E Well-formedness Rules for BPMN Metamodel
295
F A Business Process of Financial Services Provisioning
301
F.1
Introduction . . . . . . . . . . . . . . . . . . . . . . . . . . . . . . . . . . . . 301
F.2
The IT Service support of Business Process . . . . . . . . . . . . . . . . . . 303
F.3
Main Activities of Business Process . . . . . . . . . . . . . . . . . . . . . . . 303 F.3.1
Startup . . . . . . . . . . . . . . . . . . . . . . . . . . . . . . . . . . . 303
F.3.2
Open Financial Session . . . . . . . . . . . . . . . . . . . . . . . . . 304
F.3.3
Withdraw Cash . . . . . . . . . . . . . . . . . . . . . . . . . . . . . . 306
F.3.4
Deposit Cash . . . . . . . . . . . . . . . . . . . . . . . . . . . . . . . 307
F.3.5
Deposit Check
F.3.6
Transfer Amount . . . . . . . . . . . . . . . . . . . . . . . . . . . . . 309
F.3.7
Query Balance . . . . . . . . . . . . . . . . . . . . . . . . . . . . . . . 309
F.3.8
Shutdown . . . . . . . . . . . . . . . . . . . . . . . . . . . . . . . . . 310
F.3.9
Spares Replacement . . . . . . . . . . . . . . . . . . . . . . . . . . . 310
. . . . . . . . . . . . . . . . . . . . . . . . . . . . . . 308
F.3.10 Information Sources . . . . . . . . . . . . . . . . . . . . . . . . . . . 310
xviii
TABLE OF CONTENTS
G Business Process Modeling Example
313
G.1 Introduction . . . . . . . . . . . . . . . . . . . . . . . . . . . . . . . . . . . . 313 G.2 Business Process Overview . . . . . . . . . . . . . . . . . . . . . . . . . . . 314 G.2.1 Sub-Process Withdraw Cash . . . . . . . . . . . . . . . . . . . . . . 316 G.2.2 Required Modeling Work . . . . . . . . . . . . . . . . . . . . . . . . 316 G.2.3 Proposed Solution for the Modeling Case . . . . . . . . . . . . . . . 316 H A Process-Oriented Approach for BPMN modeling
319
List of Figures
1.1
Process model of the dissertation . . . . . . . . . . . . . . . . . . . . . . . .
2.1
The Workflow Reference Model and main associated standards (Sources:
10
WfMC/OMG/W3C) . . . . . . . . . . . . . . . . . . . . . . . . . . . . . . .
14
2.2
The Business Process Management life cycle (Adapted from: [Wes07]) . .
17
2.3
Activity Diagram metamodel [OMG07b] . . . . . . . . . . . . . . . . . . .
29
2.4
Event-Driven Process Chain metamodel . . . . . . . . . . . . . . . . . . . .
31
2.5
Classical Petri Nets metamodel . . . . . . . . . . . . . . . . . . . . . . . . .
33
2.6
Yet Another Workflow Language metamodel . . . . . . . . . . . . . . . . .
36
2.7
Subject-oriented Business Process Management metamodel . . . . . . . . .
38
2.8
Business Process Execution Language metamodel . . . . . . . . . . . . . .
42
3.1
Standards Timeline - Releases ( Source: [SWB+ 12]) . . . . . . . . . . . . . .
50
3.2
Concrete syntax of BPMN . . . . . . . . . . . . . . . . . . . . . . . . . . . .
51
3.3
Event types in BPMN (Source [BPM11]) . . . . . . . . . . . . . . . . . . . .
52
3.4
BPMN abstract syntax – a subset of the BPMN metamodel . . . . . . . . .
56
3.5
Process metaclass’ connections . . . . . . . . . . . . . . . . . . . . . . . . .
56
3.6
Main meta-classes in a process orchestration . . . . . . . . . . . . . . . . .
57
3.7
Derived meta-classes from FlowNode . . . . . . . . . . . . . . . . . . . . . .
57
3.8
A non-directional DataAssociation connected to a SequenceFlow . . . . . . .
58
3.9
An instance of SubProcess receiving/sending instances of MessageFlow . .
59
3.10 Model-snippet for assessment of the effectiveness of BPMN tools verification 63 5.1
A Throwing Escalation Intermediate Event matches a non-Interrupting Escalation Catch Event . . . . . . . . . . . . . . . . . . . . . . . . . . . . . . .
5.2
A flow from an Interrupting Catch Event must merge the normal flow through an Exclusive Gateway . . . . . . . . . . . . . . . . . . . . . . . . .
5.3
85 87
An Event SubProcess must not have any incoming or outgoing Sequence Flows . . . . . . . . . . . . . . . . . . . . . . . . . . . . . . . . . . . . . . . . xix
88
xx
LIST OF FIGURES 5.4
Use explicitly Start Events and End Events . . . . . . . . . . . . . . . . . .
89
5.5
Simultaneous merging and splitting gateway should be avoided . . . . . .
90
5.6
An event should have at most one outgoing Sequence Flow . . . . . . . .
91
6.1
Concepts regarding process modeling measurement . . . . . . . . . . . . .
97
6.2
Measures’ definition and validation . . . . . . . . . . . . . . . . . . . . . . 101
6.3
A BPMN Model P constituted by 3 sub-models: a generic sub-model (top), the sub-model of SubProcess1 (middle) and the sub-model of SubProcess2 (bottom). . . . . . . . . . . . . . . . . . . . . . . . . . . . . . . . . . . . . . . 105
7.1
Processware Megamodel (adapted from [FN05]) . . . . . . . . . . . . . . . 126
7.2
BPMN diagrams in MDA levels of abstraction . . . . . . . . . . . . . . . . 129
7.3
MDA transformation architecture . . . . . . . . . . . . . . . . . . . . . . . . 131
7.4
A framework for BPMN model-based testing . . . . . . . . . . . . . . . . . 133
7.5
The EA2USE transformation tool . . . . . . . . . . . . . . . . . . . . . . . . 136
7.6
The XPDL2USE transformation . . . . . . . . . . . . . . . . . . . . . . . . . 136
7.7
Building BPMN syntax validator through: Lane 1 – the transformation of the BPMN metamodel into the USE abstract syntax and the construction of EA2USE transformation; and Lane 2 – the construction of XPDL2USE transformation . . . . . . . . . . . . . . . . . . . . . . . . . . . . . . . . . . . 137
7.8
Building and verifying BPMN models snippets for BPMN well-formedness rules derivation . . . . . . . . . . . . . . . . . . . . . . . . . . . . . . . . . . 138
7.9
The USE environment loaded with BPMN metamodel and the BPMN diagram presented in Figure 7.10 . . . . . . . . . . . . . . . . . . . . . . . . . . 139
7.10 A BPMN simple diagram of a transactional sub-process . . . . . . . . . . . 139 7.11 Data Collection of BPMN process models for empirical validation . . . . . 142 8.1
The BPMN empirical study framework . . . . . . . . . . . . . . . . . . . . 150
8.2
Pareto diagrams for BPMN elements and rules . . . . . . . . . . . . . . . . 167
8.3
Radar diagram depicting the BPMN elements’ usage by Source . . . . . . . 168
9.1
Radar diagram depicting the BPMN measures by Source . . . . . . . . . . 210
B.1 A Top-Level Process can only be instantiated by a restricted set of Start Events types . . . . . . . . . . . . . . . . . . . . . . . . . . . . . . . . . . . . 272 B.2 Outgoing Sequence Flow not allowed in an End Event . . . . . . . . . . . 273 B.3 Outgoing Message Flow not allowed in a Catch Event . . . . . . . . . . . . 273 B.4 A Catch Event with incoming Message Flow must have Message or Multiple type . . . . . . . . . . . . . . . . . . . . . . . . . . . . . . . . . . . . . . . 274 B.5 Explicit Start/End Events do not allow Activities or Gateways without incoming/outgoing Sequence Flow . . . . . . . . . . . . . . . . . . . . . . . . 275 B.6 A conditional Sequence Flow cannot be used if there is only one sequence flow out of the element . . . . . . . . . . . . . . . . . . . . . . . . . . . . . . 276
LIST OF FIGURES
xxi
B.7 A Boundary Event must have exactly one outgoing Sequence Flow (unless it has the Compensation type) . . . . . . . . . . . . . . . . . . . . . . . . . . 277 B.8 Use a Timer Intermediate Event with an Event Gateway . . . . . . . . . . . 278 B.9 Always use a Default Condition with an Exclusive Gateway . . . . . . . . 279 B.10 Activities on the same Process should have different names . . . . . . . . . 280 C.1 Model-snippet implemented in Adonis Community Edition (Version: 2.01.00.812)281 C.2 Model-snippet implemented in Aris Express (Version: 2.4) . . . . . . . . . 282 C.3 Model-snippet implemented in Bizagi (Version: 2.3.0.5) . . . . . . . . . . . 282 C.4 Model-snippet implemented in Enterprise Architect (Version: 9.0.908) . . 282 C.5 Model-snippet implemented in eClarus (Version: 2.1.0.200904272037) . . . 283 C.6 Model-snippet implemented in iGrafx Process 2013 (Version: 15.0.1.1547) . 283 C.7 Model-snippet implemented in MagicDraw (Version: 17.0.3) . . . . . . . . 283 C.8 Model-snippet implemented in Modelio (Version: 2.2.1) . . . . . . . . . . . 284 C.9 Model-snippet implemented in Signavio (Version: 6.2) . . . . . . . . . . . . 284 C.10 Model-snippet implemented in TIBCO (Version: 3.5.3.022) . . . . . . . . . 285 C.11 Model-snippet implemented in Visio & BPMN 2.0 Modeler (Versions: 14.0.6/3.1)285 F.1
Business Process Model of Financial Services Provisioning . . . . . . . . . 304
G.1 Overview of the Business Process for Providing Financial Services . . . . . 314 G.2 Detail of the Sub-Process Make Financial Operation . . . . . . . . . . . . . . 315 G.3 Detail of the Sub-Process Choose Operation . . . . . . . . . . . . . . . . . . . 315 G.4 Detail of the Sub-Process Withdraw Cash . . . . . . . . . . . . . . . . . . . . 317 G.5 Detail of the Sub-Process Receive Withdraw Data . . . . . . . . . . . . . . . . 317 G.6 Detail of the Sub-Process Handle Withdraw Approval . . . . . . . . . . . . . 317 G.7 Detail of the Sub-Process Finalize Withdraw . . . . . . . . . . . . . . . . . . 318
[This page is intentionally blank]
List of Tables
2.1
Summary of BPMLs Assessment . . . . . . . . . . . . . . . . . . . . . . . .
3.1
Rules’ violations detected on a model-snippet, by a sample of BPMN mod-
44
eling tools . . . . . . . . . . . . . . . . . . . . . . . . . . . . . . . . . . . . .
63
4.1
Research Works Selected . . . . . . . . . . . . . . . . . . . . . . . . . . . . .
72
4.2
Classification of the selected studies . . . . . . . . . . . . . . . . . . . . . .
76
8.1
Independent and dependent variables for HAi hypotheses . . . . . . . . . . 157
8.2
Independent and dependent variables used by HAi hypotheses . . . . . . . 157
8.3
Description of variables of the sample S1 . . . . . . . . . . . . . . . . . . . . 166
8.4
Percentage of cases per number of rules violations . . . . . . . . . . . . . . 167
8.5
Descriptive statistics (I) . . . . . . . . . . . . . . . . . . . . . . . . . . . . . . 169
8.6
Tests of Normality (I) . . . . . . . . . . . . . . . . . . . . . . . . . . . . . . . 169
8.7
Ranks for HA1 . . . . . . . . . . . . . . . . . . . . . . . . . . . . . . . . . . . 174
8.8
Wilcoxon Signed Ranks test for the Total S NOK variable . . . . . . . . . . . 174
8.9
Ranks for HA1c . . . . . . . . . . . . . . . . . . . . . . . . . . . . . . . . . . . 175
8.10 Mann-Whitney U test for the Total S NOK variablea . . . . . . . . . . . . . 175 8.11 Two-Sample Kolmogorov-Smirnov test for the Total S NOK variablea . . . . . 176 8.12 Descriptive statistics by Source (I) . . . . . . . . . . . . . . . . . . . . . . . . 176 8.13 Descriptive statistics by Source (II) . . . . . . . . . . . . . . . . . . . . . . . 176 8.14 Spearman’s rho for HA2 , HA2a and HA2b . . . . . . . . . . . . . . . . . . . . 177 8.15 Spearman’s rho for variables Activities, Events, Gateways . . . . . . . . . 178 8.16 Kendall’s tau b for HA3
. . . . . . . . . . . . . . . . . . . . . . . . . . . . . 178
8.17 Spearman’s rho for HA3 . . . . . . . . . . . . . . . . . . . . . . . . . . . . . . 179 8.18 Independent and dependent variables for HA1a and HA1b hypotheses . . . 185 8.19 Independent and dependent variables used by HA1a and HA1b hypotheses
185
8.20 Description of variables of the second sample . . . . . . . . . . . . . . . . . 191 8.21 Descriptive statistics (II) . . . . . . . . . . . . . . . . . . . . . . . . . . . . . 191 xxiii
xxiv
LIST OF TABLES
8.22 Tests of Normality (II) . . . . . . . . . . . . . . . . . . . . . . . . . . . . . . 191 8.23 Ranks of Total A NOK - Total M NOK for HA1a . . . . . . . . . . . . . . 193 8.24 Test Statistics of Total A NOK - Total M NOK . . . . . . . . . . . . . . . 193 8.25 Ranks for HA1b . . . . . . . . . . . . . . . . . . . . . . . . . . . . . . . . . . . 194 8.26 Mann-Whitney U test for the Total A NOK variablea . . . . . . . . . . . . . 194 8.27 Two-Sample Kolmogorov-Smirnov test for the Total A NOK variablea . . . . 195 9.1
Variables for HB1a to HB1e . . . . . . . . . . . . . . . . . . . . . . . . . . . . . 207
9.2
Description of variables of measures’ sample . . . . . . . . . . . . . . . . . 209
9.3
Descriptive statistics (III) . . . . . . . . . . . . . . . . . . . . . . . . . . . . . 210
9.4
Tests of Normality (III) . . . . . . . . . . . . . . . . . . . . . . . . . . . . . . 211
9.5
Spearman’s rho for HB1a to HB1e . . . . . . . . . . . . . . . . . . . . . . . . . 212
9.6
Spearman’s rho for BLR model . . . . . . . . . . . . . . . . . . . . . . . . . 214
9.7
Collinearity Statistics for BLR model . . . . . . . . . . . . . . . . . . . . . . 214
9.8
Step 0 - Classification Tablea,b . . . . . . . . . . . . . . . . . . . . . . . . . . 215
9.9
Step 0 - Variables in the Equation . . . . . . . . . . . . . . . . . . . . . . . . 215
9.10 Step 0 - Variables not in the Equation . . . . . . . . . . . . . . . . . . . . . . 215 9.11 Step 1 - Omnibus Tests of Model Coefficients . . . . . . . . . . . . . . . . . 216 9.12 Step 1 - Model Summary . . . . . . . . . . . . . . . . . . . . . . . . . . . . . 216 9.13 Step 1 - Hosmer and Lemeshow Test . . . . . . . . . . . . . . . . . . . . . . 216 9.14 Step 1 - Classification Tablea . . . . . . . . . . . . . . . . . . . . . . . . . . . 217 9.15 Step 1 - Variables in the Equationa
. . . . . . . . . . . . . . . . . . . . . . . 217
D.1 BPDs used in Empirical Validation . . . . . . . . . . . . . . . . . . . . . . . 288 E.1 Preciseness Rules for BPMN Metamodel . . . . . . . . . . . . . . . . . . . . 296
Listings
5.1
A Throwing Escalation Intermediate Event matches a non-Interrupting Escalation Catch Event. . . . . . . . . . . . . . . . . . . . . . . . . . . . . . . .
5.2
A flow from an Interrupting Catch Event must merge the normal flow through an Exclusive Gateway. . . . . . . . . . . . . . . . . . . . . . . . . . .
5.3
86 86
An Event SubProcess must not have any incoming or outgoing Sequence Flows. . . . . . . . . . . . . . . . . . . . . . . . . . . . . . . . . . .
87
5.4
Use explicitly Start Events and End Events. . . . . . . . . . . . . . . . . . .
89
5.5
Simultaneous merging and splitting gateway should be avoided. . . . . .
89
5.6
An event should have at most one outgoing Sequence Flow. . . . . . . . .
90
6.1
Implementation of tangle measure in OCL . . . . . . . . . . . . . . . . . . . 117
xxv
[This page is intentionally blank]
Acronyms
AD Activity Diagram. 23 AI Artificial Intelligence. 21 ASM Abstract State Machines. 268 BE Business Engineering. 21 BLR Binary Logistic Regression. 108 BP Business Process. 13 BPEL Business Process Execution Language. 23 BPM Business Process Modeling. 15 BPML Business Process Modeling Language. 23 BPMN Business Process Model and Notation. 4 BPMS Business Process Management Systems. 14 BPR Business Process Re-engineering. 16 BWW Bunge-Wand-Weber ontology. 53, 320 CIM Computation Independent Model. 128 CMM Capability Maturity Model for software. 19 CMMI Capability Maturity Model Integrated. 19 CPN Colored Petri Nets. 27 CRM Customer Relationship Management. 13 CWM Common Warehouse Common Warehouse Metamodel. 128 xxvii
xxviii EAI Enterprise Application Integration. 13 EPC Event-driven Process Chain. 23 ERP Enterprise Resource Planning. 12 GBRAM Goal-Based Requirements Analysis Method. 321 GORE Goal-Oriented Requirements Engineering. 321 GQM Goal Question Metric. 95 GQM/MEDEA Goal Question Metric/MEtric DEfinition Approach. 95 GRL Goal Requirements Language. 321 KAOS Knowledge Acquisition in autOmated Specification. 321 M2DM MetaModel-Driven Measurement. 78 MDA Model-Driven Architecture. 54 MDE Model Driven Engineering. 124 MOF Meta Object Facility. 127 NFRs Non-Functional Requirements. 319 OCL Object Constraint Language. 29, 84 ODM Ontology Definition Metamodel. 128 OMG Object Management Group. 26 OWL Web Ontology Language. 267 P/N Petri Nets. 23 PAIS Process-Aware Information System. 13 PIM Platform Independent Model. 128 PIs Performance Indicators. 21 PSM Platform Specific Model. 128 QVT Query/View/Transformation. 130 RE Requirements Engineering. 321
Acronyms
Acronyms S-BPM Subject-oriented Business Process Management. 23 SBVR Semantics of Business Vocabulary and business Rules. 128 SCM Supply Chain Management. 13 SLA Service-Level Agreements. 322 SLM Service-Level Management. 319 SOA Service-Oriented Architecture. 14 SOC Service-Oriented Computing. 14 SysML Systems Modeling Language. 18 TQM Total Quality Management. 319 WfMC Workflow Management Coalition. 13 WfMS Workflow Management Systems. 13 XMI XML Metadata Interchange. 15 XML eXtensible Markup Language. 15 XPDL XML Process Definition Language. 15 YAWL Yet Another Workflow Language. 23
xxix
[This page is intentionally blank]
Quality of Process Modeling Using BPMN: A Model-Driven Approach
1
1 Introduction
"Begin at the beginning and go on till you come to the end; then stop." – Lewis Carroll
Contents 1.1
Introduction . . . . . . . . . . . . . . . . . . . . . . . . . . . . . . . . . . .
4
1.2
Research Drivers . . . . . . . . . . . . . . . . . . . . . . . . . . . . . . . .
5
1.3
Dissertation Outline . . . . . . . . . . . . . . . . . . . . . . . . . . . . . .
7
1.4
Conclusion . . . . . . . . . . . . . . . . . . . . . . . . . . . . . . . . . . .
8
Context: The quality of process models, as outcome of the process modeling activity is crucial, since these models are used in later phases of the process life cycle. Objective: To establish the main drivers of the research to be done on process modeling quality. Method: The elicitation of the research problems, research questions and thesis statement. Results: The main contributions expected from this dissertation were elicited, namely (1) the formalization of a set of well-formedness rules that could enforce the BPMN process models quality; and (2) the derivation of a set of measures for assessing the internal and external attributes of BPMN process models. Limitations: The goodness of contributions must be assessed by empirical studies. Conclusion: A road-map outlines and delimits the research work to be done in this dissertation. 3
1. I NTRODUCTION
1.1
1.1. Introduction
Introduction
Processes are a set of coordinated activities and procedures fueled by resources, aiming to fulfill specific goals of particular stakeholders [MaP01]. In this dissertation, we are concerned with the modeling of specific type of processes: blended set of automated and manual activities that take place in organizations (see sections 2.2 and 2.3). A process can be formally documented, or merely informally defined. Regardless its nature, processes exhibit features that make them suitable for usage of modeling techniques. Business process modeling is the set of activities conducted for visually depicting qualitatively grounded models of organization’s processes, so that processes can be analyzed, monitored and improved regarding their expected value. The design of processes through process modeling is the activity carried out in the early stages of a process elicitation. This activity helps to identify problems in the beginning of the process development [RCG+ 09] and assists the design of valid process models. Moreover, a suitable analysis and verification of processes at the modeling stage would make easier the process maintenance tasks [ARGP06] by reducing its implicit costs. This is why efforts should be made to impose quality characteristics to the process models. Following a taxonomy of Mylopoulos et al. regarding quality attributes in software systems [MCN92], in this dissertation we choose the product-oriented approach to deal with the formal treatment of quality in process modeling (detailed in section 2.4). The productoriented approach attempts to define methods and tools to ensure that process modeling outcomes, i.e the process diagrams, can be evaluated to the degree to which they meet certain external quality attributes (e.g. correctness, understandability, maintainability). For representing quality characteristics of the process models we chose Business Process Model and Notation (BPMN) [BPM11] since it is nowadays the most well equipped process modeling language [RIRG05, RRIG09] (see section 2.5). BPMN is backed up by OMG, and is currently the business process notation most used among process modeling practitioners [HW11]. BPMN language definition is based upon a metamodel and is one of the languages with more modeling tools available1 (section 2.5.3). However, since BPMN rules are informally expressed in natural language there are weaknesses (see details in section 3.4) identified in the BPMN standard that hinders the production of good quality process models using currently available tools. To evaluate the quality of process models, as with the software artifacts, we are aware that quality is a multi-dimensional concept, with several characteristics. The ISO/IEC 25000 series (SQuaRE) [ISO05b], is a well known example where the factors contributing to quality are grouped to constitute the basis of a quality model. A quality model often decomposes the view of quality into different levels of quality characteristics. The interrelationships between quality characteristics and their measures are also documented. Eventually, the internal attributes are linked to external quality attributes. In the case 1
http://www.bpmn.org/ [accessed in Feb. 10, 2013]
4
1. I NTRODUCTION
1.2. Research Drivers
of process modeling, this results in a quality model with directly measurable attributes of process models diagrams (e.g. size, complexity) linked to the perceived quality by stakeholders (e.g. correctness, understandability, maintainability). So, since a quality model is a framework for quantifying and linking different quality characteristics, one could expect that if we are able to control the internal quality characteristics of process models, this will ensure a more control over the final quality of the modeling process.
1.2
Research Drivers
The starting point of our research process [WRH+ 00] was to formulate the main problems we were trying to tackle (section 1.2.1). This drove us to the research questions (section 1.2.2). To answer these questions we have to formulate some hypotheses. The explanatory theory of the problems posed by the research questions is part of the research hypotheses formulated in sections 8.4.1.2 and 9.4.2. In chapters 5 and 6 are described the research work we have performed, from which we distilled the contributions referred in section 1.2.4. For validation of our contributions, we set up some empirical studies (described in chapters 8 and 9). Based on the conducted empirical studies, we drew conclusions about the benefits and effectiveness of our proposals.
1.2.1
Research Problems
The aim of our research is to face quality issues on process models raised by the usage of the BPMN 2.0 standard. Those issues can be tackled facing the two following major sub-problems2 : 1. [RPA ] BPMN is intended for modelers with different levels of expertise and technical backgrounds, namely process analysts and process developers. However, the BPMN standard does not provide a rigorous definition that modelers could follow to produce good quality models. There is a lack on BPMN rules formalization in the BPMN standard’s documentation. Furthermore, due to the informal BPMN specification, amenable to originate different interpretations, BPMN tools do not provide an accurate and in-depth verification of process models (see details in section 3.4). This problem is important in the specific case of BPMN, given the number and type of constructs available in the language (see Figure 3.2 and 3.3). Furthermore, if models become large and complex, or several variants for the same problem are considered, checking rules compliance becomes fundamental and difficult to achieve without automatic tools. Therefore, well defined and rigorously formalized rules are required for obtaining good quality models in BPMN. 2 We label the problems as RPA and RPB for the sake of traceability with research questions, and research hypotheses
5
1. I NTRODUCTION
1.2. Research Drivers
2. [RPB ] The BPMN standard does not provide guidelines or measures regarding the internal and external attributes that well designed process models must possess. According a survey we made on BPMN tools (section 3.4), most of them do not implement sound measures, validated by empirical results that could support process modelers when designing BPMN diagrams.
1.2.2
Research Questions
With the elicitation of the actual problems, in the previous section, we can now come up with the following research questions, each of one related with the previous research problems, which will direct our research. [RQA ] Could the formalization of BPMN rules contribute for uncovering quality non conformance, as well as attaining better quality of BPMN models? (see section 8.3.2) [RQB ] What measures could assess internal and external characteristics of BPMN models? (see section 9.3.2)
1.2.3
Thesis Statement
Grounded in the research problems (section 1.2.1), the research questions (section 1.2.2) and the model-driven approach (section 7.2), we summarize the purpose of this dissertation in the following thesis statement: In order to improve BPMN models’ quality we propose a model-driven approach capable of formalizing: (i) well-formedness rules; (ii) measures for assessment of models characteristics. Since quality is a multidimensional concept (section 2.4), in the present dissertation, for the sake of focus, we are only concentrated upon the quality characteristics of correctness of BPMN process models. We will further research (see section 10.3) whether the approach pursuit in this research work, can also be applied, mutatis mutandis to other dimensions of quality (e.g. understandability, maintainability).
1.2.4
Main Contributions
The main contribution intended by this dissertation regarding process modeling with BPMN is relate with the improving of the quality of process models at design phase (build-time). This general contribution can be decomposed on the two following more detailed contributions. 6
1. I NTRODUCTION
1.2.4.1
1.3. Dissertation Outline
Process Models’ Quality Verification (CTA )
A problem found (see RPA ) in process modeling with BPMN is the need to check wellformedness of models according to the rules of the standard, in order to achieve a good quality artifact. There are three types of rules that can be considered when checking models’ correctness: (1) well-formedness rules defined at the BPMN standard document in plain text (section 5.2.1); (2) best-practices rules promoted by BPMN practitioners in the literature (section 5.2.2); and (3) rules regarding formal properties (e.g. deadlock, liveness) enforced by available model checkers3 . In this dissertation, we will add to BPMN metamodel the two first types of wellformedness rules for enforcing the process diagrams’ quality. 1.2.4.2
Process Models’ Quality Measurement (CTB )
Another problem (see RPB ) found in process modeling with BPMN is the lack of measures that can help process modelers to be knowledgeable of BPMN models’ internal attributes (e.g. size, complexity). These measures could give process modelers hints and guidelines for achieving business process model with superior external quality characteristics (e.g. correctness, understandability, maintainability). Generally, appropriate internal properties of a process model are a pre-requisite for achieving required external qualities [ISO05b]. In this dissertation, we will derive and add to BPMN metamodel measures for assessing BPMN models’ internal attributes and thus contribute for enforcing the business process diagrams’ external qualities.
1.3
Dissertation Outline
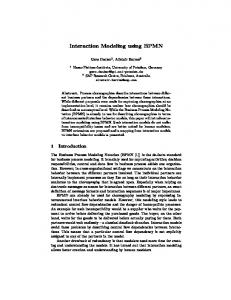
The control-flow, as well as the main data exchanged among of the activities of this dissertation (chapters of this document), was organized according the process model illustrated in Figure 1.1. 1. Inception Phase: • chapter 1 – In this chapter, we presented the motivation for the subject of quality on process modeling. Since we chose BPMN for expressing the quality in process models, we define our research problems based on the fact that BPMN has limitations for the design of good quality models. Backed up by the elicited research problems we formulated the research questions and the thesis statement of this dissertation. The expected contributions from the research work were also presented. • chapter 2 – We addressed the subject of processes and process modeling, since their early inception to the current days. We highlighted several engineering 3
This kind of rules is already covered by several proposals and tools (see chapter 4).
7
1. I NTRODUCTION
1.4. Conclusion
approaches that use the process paradigm, and introduced also, in more detail, the subject of quality upon process modeling. We assessed relevant process modeling languages, and justified the choice of BPMN for studying the quality regarding process models. • chapter 3 – We analyzed the BPMN, as well as the relationship between the BPMN metamodel and the graphical constructs of the language. Furthermore, by surveying a set of BPMN tools, we gathered evidences of the limitations of the BPMN, concerning the formalization of well-formedness rules, which hinders the production of good quality models. • chapter 4 – We surveyed the state-of-the-art of previous attempts to validate BPMN models, highlighting the merits and limitations of those approaches. 2. Research Phase: • chapter 5 – Our approach to overcome BPMN limitations is introduced, by deriving and formalizing the well-formedness rules for enrichment of the BPMN metamodel. • chapter 6 – A proposal of a set of measures is formalized for measurement of BPMN models’ internal and external quality characteristics. 3. Implementation Phase: • chapter 7 – An MDE approach was introduced for instrumentation of process models’ transformations and the data collection for the experimental studies to be presented in the next two chapters. 4. Validation Phase: • chapter 8 – Using a research approach based in the scientific method, two experimental studies are presented to give empirical evidence about the effectiveness of the verification approach proposed in chapter 5. • chapter 9 – Similarly to the previous chapter it is also presented here a experimental study. The aim is to support, through empirical evidence, the measures proposed in chapter 6 regarding process models characteristics, as well as the relationship between models’ faults and those characteristics. 5. Conclusion Phase: • chapter 10 – Some conclusions resulting from the research work previously done are discussed. The future work envisaged is also summarized.
1.4
Conclusion
This chapter was intended to give the context of the dissertation, by paving the way for the process modeling overview (chapter 2), the recent developments regarding process modeling and the BPMN (chapters 3 and 4), the presentation of main contributions (chapters 5 and 6), as well as the results’ validation (chapters 8 and 9). The chapter begins by providing the motivation for the research work on quality of process modeling (section 1.1). The chosen process modeling language (BPMN) revealed 8
1. I NTRODUCTION
1.4. Conclusion
some weaknesses that affect the quality of produced process models. This evidence settled down the framework of the research work, through the definition of the research problems, the research questions, the thesis statement and the main contributions expected from the dissertation (section 1.2). Ultimately, a plan for the dissertation was outlined to accomplish the proposed research objectives (section 1.3).
9
Figure 1.1: Process model of the dissertation
1. I NTRODUCTION 1.4. Conclusion
10
2 Process Modeling
"Never invest in a business you can’t understand." – Warren Buffett
Contents 2.1
The Process Paradigm . . . . . . . . . . . . . . . . . . . . . . . . . . . . .
12
2.2
The Business Process Perspective . . . . . . . . . . . . . . . . . . . . . .
15
2.3
Other Process Engineering Approaches . . . . . . . . . . . . . . . . . . .
17
2.4
Quality in Process Modeling . . . . . . . . . . . . . . . . . . . . . . . . .
20
2.5
Process Modeling Languages . . . . . . . . . . . . . . . . . . . . . . . . .
23
2.6
Conclusion . . . . . . . . . . . . . . . . . . . . . . . . . . . . . . . . . . .
45
Context: Nowadays, the process paradigm embodied by business processes is part of all organizations. Process modeling is concerned with the representation of processes that take place within and between organizations, by means of process models. Objective: Determine the relevant factors, a chosen process modeling language must possess, for addressing the quality of process models. Method: A set of process modeling languages was assessed for choosing the most appropriate to tackle the issues of quality of process models. Results: BPMN was chosen for addressing the quality of process models. Limitations: The survey on process modeling languages considers only the set of most relevant process modeling language. Conclusion: BPMN is nowadays the most well equipped process modeling language. 11
2. P ROCESS M ODELING
2.1
2.1. The Process Paradigm
The Process Paradigm
The Industrial Revolution, in the late 18th and early 19th centuries, brought a fundamental number of innovations that led the boost of unprecedented economic and social changes. This came mainly from the transition to new manufacturing processes, going from hand production to machine based methods, underpinned by new organization of human labor in factories through assembly lines, which greatly improved efficiency [Hob81]. Subsequent studies from Frederick Taylor [Tay11], among others, focused on work simplification, for time-motion, systematic experimentation to identify the best way of performing a task, and control systems that measured and rewarded output. Were also relevant the efforts of Henry Ford building standardized parts and assembly lines, which drew attention on the systemization of industrial and organizational tasks, to optimize the efficiency of departments and the overall organization [WM08]. These historical antecedents paved the way for the ulterior economical and organizational transformations witnessed in the 20th century, supporting products delivery, wrapped up by services, as well as the primacy of dematerialized transactions in a society driven by information [LL05]. In the beginning of the second half of the 20th century, computer applications stealthily started to be used in organizations to support the flow of activities. However, due to methodological and technological constraints, programmers were faced with the necessity of coding, in each application, all the basic functionalities (e.g. access to persistent storage and memory management). As a consequence, these functionalities redeveloped from scratch for each new different application, became embedded in each application, tighten up the application to the specific department for which it was developed [Wes07]. This led to information systems made up by isolated applications supporting organizational functions – the so called silo-based applications [Har07]. Since those software systems were owned by specific organizational units, the regular business1 process flows and information sharing was hampered, both inside the organization and with external partners. This situation had negative effects on the ability of organizations to react to changing requirements, induced by a dynamic market environment, as well as changes in technology, and regulatory legislation, which had to be reflected in software systems. The evolution in software development, due to the incorporation of principles (e.g. separation of concerns [Dij82], information hiding [Par72]) and methods (e.g. requirements engineering, object-oriented analysis and design), alongside technological innovations, contributed to relieve information flow from the restraints brought by earlier computer systems. Database management systems, for instance, in the decades of 70 and 80 of the 20th century, released applications from data constraints by guaranteeing the principle of data independence [Cod70] and the primacy of data modeling [Che76]. Enterprise Resource Planning (ERP) systems in the 90s brought a new way of delivery to applications systems. The emphasis shifted from programming to assembling and 1 In this dissertation we use the term business not in sensu stricto of a commercial activity, but in a sensu lato of an activity that someone is engaged in (see the Oxford Dictionary at http://oxforddictionaries.com).
12
2. P ROCESS M ODELING
2.1. The Process Paradigm
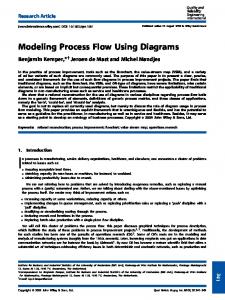
configuring systems’ functionalities, by consolidating disparate applications with an integrated corporate database. However, additional business requirements demanded new types of software systems such as, Supply Chain Management (SCM) and Customer Relationship Management (CRM). Ultimately, these systems led to situations previously seen such as data redundancy and lack of data consistency of siloed applications. Due to the increased complexity of those systems, Enterprise Application Integration (EAI) had to be used to integrate data in heterogeneous information technologies. EAI applications also revealed some drawbacks since, to a large extent, they rely on programming and configuration of adapters and message brokers. Typically, what in fact was embedded in an EAI system was the sequence of activities to be executed, constrained by a set of rules that implemented a business process2 aiming a specific business goal. Therefore, in EAI solutions, the process model was hard-coded into the information system [Wes07]. Workflow Management Systems (WfMS) proposal to solve the process integration problem was to promote business processes to first-class entities. A Business Process (BP) can be defined as a timely and space orchestrated set of activities, carried out by an organization, either internally or in conjunction with other organizations, to attain an output of value for stakeholders [Dav93, HC93]. WfMS effectiveness intends to be based on configuration of information system through business process models. An higher flexibility of information systems is aimed since changes dictated by new requirements are introduced via process models [vvdAS11]. Using WfMS analysts can define and execute business processes and the rules governing process decisions [Har07]. Another non negligible benefit of WfMS usage was the access to documentation of business process, for compliance with regulatory purposes (e.g. audits of corporate IT processes to follow the Sarbanes-Oxley Act (SOX) [Ko09], and the Third Basel Accord (BASEL III) [Sup10] that financial institutions have to comply with [Har07]). Most WfMS vendors follow a Workflow Reference Model created by the Workflow Management Coalition (WfMC) for defining WfMS’s components and functionalities as well as to identify its most important interfaces (Figure 2.1), to facilitate exchange of information in a standardized way, thus enabling interoperability between different products [CT12]. The information systems that interface with WfMS, by executing business processes involving either people, applications, or other information sources, are referred as Process-Aware Information System (PAIS) [DVDATH05]. In Figure 2.1, the component with dash border (Process Definition Tools) is the most relevant for the current dissertation, since it is the one that supports activities of business 2
In this dissertation when the concept of business process is mentioned it does not mean that we are restricting the scope of this work to commercial activities in organizations. The concept of business process must be considered in sensu lato, i.e., regarding any kind of process composed by manual or automated activities that can be done in parallel, and thus must be synchronized, consuming some sort of resources (products or services) and generating an output of value (product or service) for a stakeholder. We leave outside this definition, and so outside the scope of this work, all kind of industrial processes with real-time requirements.
13
2. P ROCESS M ODELING
2.1. The Process Paradigm
process modeling, which is our main focus in this work.
Figure 2.1: The Workflow Reference Model and main associated standards (Sources: WfMC/OMG/W3C) Currently, the most used software tools for supporting business processes are Business Process Management Systems (BPMS) [HCKP09]. They became a step forward regarding WfMS, by incorporating a diagnosis phase in the business process life cycle. In the diagnosis phase, process analysts are able to identify and improve on bottlenecks and potential fraudulent breaches of business processes using the appropriate analysis and monitoring tools [Ko09]. Furthermore, BPMS take advantage over WfMS on the contemporary distributed environments of Web services and Service-Oriented Architecture (SOA) [Erl07]. The adoption by BPMS of SOA’s IT architectural paradigm, the latest computing paradigm incarnation of Service-Oriented Computing (SOC), allow the use of technology with greater agility, with computational processes linked (e.g. by web services) in order to enable the coordination of distributed systems that support processes. So, business functionalities, can be encapsulated within services and made available in repositories through interfaces and message protocols. Therefore, conversely to the WfMSs that were based on the WfMC’s idea of a centralized enactment engine confined to a single organization, the BPMS business processes can be implemented via services’ composition upon the SOA technological infrastructure. With SOA, it becomes easier to compose and maintain information systems to the point that it is possible to shift from a carefully planned design of information systems to an on-going and permanent redesign and organic growth [vvdAS11]. With Software as a Service (SaaS) adoption, organizations do not need to host and run their own applications. They can subcontract applications’ usage to external suppliers. Even the infrastructure, can be virtualized and shared among other organizations when 14
2. P ROCESS M ODELING
2.2. The Business Process Perspective
supported by cloud computing. Since an unified and integrated perspective of organizations’ information systems can be provided by a business process perspective, no wonder that BPMS became more and more, an important tool to cope with the later technological trends, in search for an increasingly support and automation of processes.
2.2
The Business Process Perspective
Processes are a set of coordinated activities and procedures fueled by resources, aiming to fulfill specific goals of particular stakeholders. In this dissertation, we are concerned with the modeling of specific type of processes: business processes3 (e.g., purchase orders, shipping management, claim register, etc.), which are a blended set of automated and manual activities that take place in organizations. Business processes constitute the means through which organizations seek to achieve their main objective of satisfying the clients’ demands by delivering goods or services [MaP01]. A process can be formally documented, or merely informally defined. Regardless its nature, processes exhibit features that make them suitable for the usage of modeling techniques. Business Process Modeling (BPM)4 is the set of activities conducted for visually depicting qualitatively grounded models of organization’s processes, so that processes can be analyzed, monitored and improved regarding their expected value. Through process modeling the As-Is processes are analyzed to become improved To-Be processes in the future. Business process modeling is a cross-disciplinary research area that adopted a wide variety of paradigms and methodologies from different areas such as organization management theory, computer science, mathematics, linguistics, semiotics, and philosophy [Ko09]. The aim of business process modeling5 is building Business Process Diagrams (BPD) the abstract representations of processes, using either technical drawings, depicting network of graphical elements [Sin06], or structured textual information serialized in eXtensible Markup Language (XML) derived formats (e.g. XML Process Definition Language (XPDL), XML Metadata Interchange (XMI)). Since process diagrams are intended to support the activities of stakeholders with different technical backgrounds (e.g. process analysts, process designers, process implementers), they should be suitable, among other purposes, to facilitate the communication among those kinds of stakeholders [Hol09]. Business process modeling is part of a multidisciplinary research domain, the Business Process Management6 , which comprises a set of activities that besides modeling, 3
Other type of processes are referred in section 2.3, more related with industrial control system and systems with real-time requirements, therefore outside the scope of this dissertation. To not overload the text we will replace whenever possible the term business process simply by process. 4 The term was coined in the 1960s in the field of systems engineering [CT12]. 5 To not overload the text we will replace whenever possible the term business process modeling simply by process modeling. 6 The acronym BPM, used previously for Business Process Modeling, is also shared by the Business Process Management community which sometimes originates that one knowledge area is confused with the
15
2. P ROCESS M ODELING
2.2. The Business Process Perspective
includes the management, execution and analysis of processes [VdAtHW03]. Business Process Management is a set of methods, techniques and software, related to the support of processes’ design, enactment, control and analysis, involving several sources of information such as humans, organizations, applications, and documents. Business Process Management is a practical, iterative, and incremental approach7 of fine-tuning business processes, leveraging IT [Ko09]. Business Process Management is not a technology and simply provides governance of a business’s process environment to improve agility and operational performance using a systematic approach [CT12]. Business Process Modeling (BPM) is the cornerstone in the life cycle of business process management and is involved in all its phases [WHJC06]. The Business Process Management life cycle phases, as well as its contribution, are summarized below [VdAtHW03, WHJC06]: 1. Design – the business process diagrams are captured from the actual processes (AsIs business process model) and stored using graphical tools. Business process modeling is generally initiated by process analysts and managers, pursuing efficiency and quality of business processes. 2. Configuration – the BPMS and the underlying system infrastructure is customized to the organization’s specificity. The business process diagrams are adjusted to fit the actual environment of the operations. 3. Enactment – business process diagrams are deployed in a BPMS, and become executable in a real environment. 4. Diagnosis – analysis and monitoring tools assess business processes execution based on the business process model. The results concerning advantages and shortages of current business processes are displayed, preferably using a representation with a high level of abstraction. Further improvements are assessed and another turn of the cycle might be triggered. The design of processes through process modeling is the activity carried out in the early stages of a process elicitation. Tackling process modeling helps to identify problems in the early phases of process development [RCG+ 09] and assists the design of valid process models. Moreover, a suitable analysis and verification of processes at the modeling stage would make easier the process maintenance tasks [ARGP06] by reducing its implicit costs. That is why, as previously noted regarding requirements engineering and software development [SD97], it pays off the effort made upon the conceptual level of producing valid processes. Therefore, it is relevant to impose quality characteristics (e.g. correctness, understandability, maintainability) to process diagrams.
other. 7 The previous approach, enhanced and overcame by Business Process Management, was the Business Process Re-engineering (BPR) [HC93, Dav93], which took a radical reshaping of existing business processes, through the obliteration of forms of work that did not add value to the organization.
16
2. P ROCESS M ODELING
2.3. Other Process Engineering Approaches
Figure 2.2: The Business Process Management life cycle (Adapted from: [Wes07])
2.3
Other Process Engineering Approaches
Modern societies progress is powered by processes [HCV10]. Besides business process, previously mentioned (section 2.2), exist other engineering approaches, for which processes play a pivotal role [VdAVH96]. We highlight some of the approaches whose techniques (e.g. graphical notation, simulation, and performance evaluation), as well as research efforts and practitioners experience, have been influential and benefited the development and maturity of the relatively new multidisciplinary research area of business process management in general and business process modeling in particular. We have been witnessing to a confluence and integration among these different process perspectives [Har04], for which, the sharing of a common graphical representation would certainly give a greater contribution.
2.3.1
Process Engineering
Process Engineering includes, among others activities, process design, process control, and process operations. Process design consists in the design of new products or in the modification or expansion of existing ones. Process models, made at the conceptual level, serve to define and ensure that the design components fit together at the end of fabrication and construction plans. Some of the modeling techniques used in Process Engineering are: Block Flow Diagrams (BFD), Process Flow Diagrams (PFDs), and Piping and Instrumentation Diagrams (PIDs) [GW00]. Process Engineering applies systematic computer-based methods on the design, operation, control, and optimization of biological processes, chemical, and physical, [OM98]. This includes a wide range of industries, namely food, pharmaceutical, chemical, mineral processing, petrochemical, advanced material, and biotechnological [GH13]. 17
2. P ROCESS M ODELING
2.3.2
2.3. Other Process Engineering Approaches
Systems Engineering
Systems Engineering is an interdisciplinary field of engineering, focused on the design and management of complex engineering projects and systems over their life cycle [KSSB11]. These systems may include hardware, software, data, personnel, procedures, and facilities from a broad range of industry domains (e.g. aerospace, automotive, health care). System Engineering aims to analyze, designing, and organizing elements into a system that can be a product, a service, or a technology for the transformation of information [PI92]. The practice of Systems Engineering underwent by a key transition from a document-based approach to a model-based approach. In the model-based approach, the focus shifts from documentation production and control to an integrated model of the system that could help to manage complexity [FMS11]. Among the system modeling techniques used by Systems Engineering that can be considered predecessors of the current business process modeling techniques, we highlight [KSSB11]: Functional Flow Block Diagram (FFBD), Data Flow Diagram (DFD), and IDEF0 Diagram [WP93]. Recently, as a response to the requirements issued by the OMG to extend UML to support systems modeling, the Systems Modeling Language (SysML) [OMG12b] came to light. SysML is a graphical general-purpose modeling language that supports the specification, design, analysis, and verification of systems. The SysML semantic foundation allows for the representation of requirements, behavior, structure, and properties of the system and its components [FMS11].
2.3.3
Industrial Engineering
Industrial Engineering is a branch of engineering concerned with the improvement, development, implementation and monitoring of integrated systems of people, information, equipment, and material, in order to attain high quality products manufactured at lower costs, with shorter cycle times. The Industrial Engineering field usually overlaps with many other knowledge areas (e.g. management science, systems engineering, operations management, operations research, ergonomics or human factors engineering, manufacturing engineering, and safety engineering) regarding specification, prediction and evaluation of systems implementation results. The decision-making process is supported by software process modeling, expert systems, business process re-engineering, simulation software, costing manufacturing models, and several other methodologies and tools [HMVHR06].
2.3.4
Quality Engineering
Quality Engineering deals with the analysis of manufacturing systems throughout product or services life cycle, to improve the quality of the production process, as well as its output, in order to satisfy customer expectations at individual level [HBS00]. Quality engineering tools and techniques include among others, SPC (Statistical Process Control), DoE (Design of Experiment), Taguchi methods and QFD (Quality Function Deployment). 18
2. P ROCESS M ODELING
2.3. Other Process Engineering Approaches
Quality Engineering is tightly related with quality frameworks, such as Total Quality Management (TQM), Six Sigma and Lean: • With TQM the focus is the satisfaction of agreed internal and external customers’ requirements [Jon94]. TQM implementation rely on the deployment of a Quality Management Systems (QMS), as defined in the ISO 9000 family of standards [ISO05a], to assist organizations to handle a permanent monitoring of the customer’s requirements as well as the continuous improvement of the organization’s processes and services [Lon04]. ISO 9000:2000 promotes the use of a process approach when developing and structuring the various QMS activities of an organization through ISO 9004:2000 [ISO00] implementation, namely by highlighting the importance of: (i) specifying quantitatively requirements and their accomplishment; (ii) considering processes in terms of measurable added value; (iii) getting results of process performance and effectiveness; and (iv) continual improvement of processes based on objective measurements. • Originated also from manufacturing processes, Six Sigma seeks the improvement of the quality of processes’ outputs by identifying and removing the causes of defects (errors) and minimizing variability in manufacturing and processes, grounded on statistical modeling [Per06, Bru04]. • Lean is a systematic methodology to reduce the complexity and streamline processes by identifying and eliminating sources of waste that typically causes inefficiencies in the processes’ flow [Wed06].
2.3.5
Performance Engineering
Performance Engineering is a discipline related with computer systems that relies on statistics, queuing theory and probability theory. Performance engineering uses tools and processes to ensure that a system, throughout its life, meets the customer’s expectations for performance, using namely analytical and simulation modeling, as well as performance testing [MADD04].
2.3.6
Software Engineering
In Software Engineering it is generally accepted that a quality development process is inevitably more likely to produce quality software consistently than an ad hoc development process [Cro00]. The quality is correlated to the maturity of an organization’s software process on a predefined quality scale. Currently, there are three important initiatives who deal with the definition and quality measurement of software processes in particular, and processes in general [KK97a]: • the Capability Maturity Model Integrated (CMMI) [SEI10c, SEI10b, SEI10a], introduced by Software Engineering Institute (SEI) as a generalization of Capability Maturity Model for software (CMM), can be applied to the wide variety of processes in different kind of organizations. The CMMI grades organization’s processes in 19
2. P ROCESS M ODELING
2.4. Quality in Process Modeling
an increasing scale of five maturity levels: 1 – No Organized Processes (Initial); 2 – Some Organized Processes (Managed); 3 – Most Processes Organized and Standardized (Defined); 4 – Processes are Measured and Controlled (Quantitatively Managed); and 5 – Processes are Continuously Improved (Optimizing). • the ISO/IEC 15504 known as Software Process Improvement and Capability dEtermination (SPICE) [ISO04a] derived from process life cycle standard ISO/IEC 12207 and maturity models (e.g. CMM), and developed for an overall determination of the organization’s capabilities for delivering products (software, systems, and IT services). • the International Organization for Standardization (ISO) produces, among others, the series of standards ISO 9001 among which is the 9000-3 which specifies qualitysystem requirements for use when a contract between two parties requires the demonstration of a supplier’s capability to design and supply a software product. In a software development process, there is also the Software Process Engineering Metamodel (SPEM) [OMG08b], a UML profile used to describe a concrete software development process or a family of related software development processes involving or requiring the use of the UML [DRC+ 06, CdO13].
2.3.7
Other Initiatives
There are also some initiatives (e.g. Proposed Interchange Formats (PIF),Process Specification Language (PSL)) aiming to join together commonalities (e.g. inputs, activities, resources, deliverables) from different modeling approaches, keeping apart the differences among them (e.g. real-time aspects, models’ descriptive and executable aspects) [BB01]. Future research in business process modeling will certainly benefit from even more cross fertilization between the above mentioned scientifically more mature engineering domains, where the process approach has been used for decades both in industry and academic applications.
2.4
Quality in Process Modeling
Process modeling is a design discipline that produces conceptual models (process diagrams) from processes’ elicitation. Following a taxonomy of Mylopoulos et al. regarding quality attributes in software systems [MCN92], we also considerer two approaches to deal with the formal treatment of quality in process modeling: process-oriented and product-oriented approaches.
2.4.1
Process-Oriented Approach
The process-oriented approach to quality in process modeling focus its attention in the definition and assessment of the set of quality attributes that outputs of processes must 20
2. P ROCESS M ODELING
2.4. Quality in Process Modeling
attain. Therefore, according to this approach, alongside information regarding the characteristics of outputs, the processes specification should also contain information about the relevant domain dependent quality characteristics (e.g. response time, availability, accuracy) of the provided products and services. The process-oriented approach is in line with the critical-realist perspective [Moo05] according which, the design artifacts should be used to actively construct and assess the world, rather than simply describe it. Therefore, processes’ models, as an outcome of process modeling, should also provide information regarding the value attained by the stakeholders, i.e., the beneficiaries of the processes. Some research threads already developed in accordance with the process-oriented approach are described below: • The approach of Kueng and Kawalek was innovative, addressing the business processes, modeling and assessing, at a conceptual level, namely highlighting how process models can be evaluated against nonfunctional goals. They concluded that the assessment of processes, if carried out at model level, would be always partial [KK97b]. • The assessment of quality properties of processes using structural measures8 similar to those used in software [Pha98]. • Korherr and List added a context perspective to an earlier work [CKO92], which had considered functional, behavior, data and organizational perspectives. The extension of some business process modeling languages metamodels with business process goals and performance measures, allowed these concepts to become explicitly visible in the corresponding models. Furthermore, they propose a mapping of the performance measures in process modeling languages onto the process execution languages intended to enable the monitoring of process at the execution environment [LK06, KL07, Kor08]. • Go4flex approach [BPJ+ 10] uses process goals to describe what is to be achieved, instead of addressing exclusively the activities that should be done, using traditional activity oriented workflow languages. They proposed a framework including the five perspectives from Korherr and List, as well as concepts developed in the area of agents and multi-agent systems. • Popova and Sharpanskykh’s approach, coming from the areas of Artificial Intelligence (AI) and Business Engineering (BE), proposed an approach of a model of an organization that included its goals, as well as relevant Performance Indicators (PIs) (aka measures) for measurement and analysis of the organizational performance. The contribution of the approach is a framework, with formal foundations, which allows the formalization of the PI concept, the relationships among PIs, as well as the analysis and verification of temporal aspects of the represented relations, with the language Temporal Trace Language (TTL) [PS08, PS09, PS10a, PS10b, PS11] 8
We use the term measure instead of the term metric for reasons that are detailed in section 6.2, namely because its semantic overload, which cause that more recent standards (e.g. ISO/IEC 25000 and ISO/IEC 15939 series) disregarded the use of the term metric.
21
2. P ROCESS M ODELING
2.4. Quality in Process Modeling
• In [Joh08] the UML Schedulability, Performance, and Time (SPT) specification [OMG05] was composed with the UML Activity Diagram (AD) specification [OMG07a] to allow a language for simulation of processes execution within a process diagram. In [BD12] it was introduced a model-driven method for performance prediction of automated processes, implemented as an orchestration of web services, based on an BPMN extension for the specification of performance properties. • In [PZ08] it was proposed to be added to BPMN symbols, new artifacts to model process models constraints and operational conditions. The method intended to assist the early discovery of non-functional requirements during systems development. A tool support for the method was made available in [HKP11b]. The same authors also presented a survey regarding modeling quality information within process diagrams in [HKP11a].
2.4.2
Product-Oriented Approach
The product-oriented approach attempts to define methods and tools to ensure that process modeling outcomes, i.e the process diagrams, can be evaluated to the degree to which they meet certain external quality attributes (e.g. correctness, understandability, maintainability). To evaluate the quality of process diagrams, as with the software artifacts, we must be aware that quality is a multi-dimensional concept, with several characteristics. The ISO/IEC 25000 series (Software product Quality Requirements and Evaluation – SQuaRE) [ISO05b], the successor of ISO/IEC 9126 standard, is a well known example where the factors contributing to quality are grouped to constitute the basis of a quality model. A quality model often decomposes the view of quality into different levels of quality characteristics. The inter-relationships between quality characteristics and their measures are also documented. Eventually, the internal attributes are linked to external quality attributes. In the case of process modeling, this results in a quality model with directly measurable attributes of process models diagrams (e.g. size, complexity) linked to the perceived quality by stakeholders (e.g. correctness, understandability, maintainability). So, since a quality model is a framework for quantifying and linking different quality characteristics, one could expect that if we are able to control the internal quality characteristics of process models, this will ensure more control over the final quality of the modeling process. For the sake of focus, in this dissertation it will be given more attention to the productoriented aspects of process modeling. However, given the relevance of process-oriented perspective, it will be also briefly addressed as future work in chapter 10 (section 10.3). 22
2. P ROCESS M ODELING
2.5
2.5. Process Modeling Languages
Process Modeling Languages
For assessing the quality characteristics of the outcomes of process modeling, we need to do it through the elements of the process modeling language. Several notations have been developed to represent process models, since the introduction of flowcharts in the 1920s [IMR09]. Those notations are known generally as Business Process Modeling Language (BPML). Depending on the particular BPML, different syntactical and semantic constructs are used to represent concepts regarding processes, namely actions, flows of control, data, or resources. BPMLs offers a wide range of characteristics and functionalities, more or less business or IT oriented. Hence, one can find some BPMLs presenting a rich set of graphical constructs, inspired in the language terminology used in the business domain, while others, emphasize aspects such as the formal semantics, analysis methods and execution environments. Given the diversity and demanding requirements, an assessment is needed to choose the suitable BPML for each specific job, such as the measurement of quality of process models. Several surveys studying, comparing and positioning BPMLs came to light along the last decade (e.g. [Gia01, VdAtHW03, WHJC06, LK06, LS07, RRIG09, MTJ+ 10]). In line with [MTJ+ 10], BPMLs can be coarsely classified in the following two categories: • semi-formal: languages that share concerns for understandability, and are amenable of various informal or heuristic analysis. As examples of semi-formal BPML we consider BPMN [BPM11], UML Activity Diagram (AD) [OMG07a], Event-driven Process Chain (EPC) [SN00]; and • formal/executable: languages that are formal (both syntax and semantics are precisely defined9 ) and/or executable (describing the flow of activities through scripts that can be executed by workflow engines). Examples of these kind of BPMLs are Business Process Execution Language (BPEL) [OAS07], Petri Nets (P/N) [Pet62, Mur89], Yet Another Workflow Language (YAWL) [tHvdAAR09], and Subjectoriented Business Process Management (S-BPM) [Fle10]. In this work we do not address BPMLs specially tailored for dealing with specific problems [MTJ+ 10] namely: (1) process integration in electronic commerce solutions, bring together different business partners through abstract and technology independent programming interfaces and data exchange formats (e.g. RosettaNet, ebXML, BPEL4WS); and (2) object-oriented modeling languages, more adapted for representing the software (solution domain) rather than the business (problem domain) (e.g. EDOC). A brief catalog of other BPMLs not covered in this work is presented in Appendix A (section A.1). To address the research topic of quality in process modeling, we needed to choose, 9
When the semantics is formally defined, sentences in the language have a unique interpretation, i.e. the semantic of process instances resulting from process models specified in the language is well defined and not ambiguous [Wes07].
23
2. P ROCESS M ODELING
2.5. Process Modeling Languages
according to certain criteria, a language suitable for the specification and assessment of the quality attributes in process models. For this purpose, a pragmatic taxonomy is used in this research work to enable a grounded justification of the choice made.
2.5.1
A Taxonomy for BPMLs
A taxonomy is a particular classification, usually organized by generalization-specialization relationships (aka inheritance relationships). At the top of the taxonomy structure (root node) there is a single classification that aggregates common characteristics to all analyzed languages – in this case the root node is labeled as Process Modeling Language. Nodes below the root node are more specific classifications that are applied to subsets of languages. The assignment of each language to a criterion node was based on an ordinal scale. Next it will be detailed each criterion of the taxonomy, as well as the underlying ordinal scale criteria: 1. Extent of Concepts: is related to the breadth of the concepts in the process modeling language, which is related to the extent of the use of the modeling language (e.g. aiming to be used only with one purpose or several purposes, such as processes’ documentation and communication instrument, simulation and execution). Several constructs close to the domain concepts allow the language to have a broader scope, thus making it amenable to be used by process analysts and process implementers. On the other hand, a language with a small number of constructs, such as a general-purpose language that includes constructs designed to be used in several contexts and not exclusively within the process modeling, will have limited scope and, thus, will be less effective in conveying the specificities of modeling situations. (i) Narrow: the language has a small number of primitive constructs (up to 20), which however can compose complex concepts. The language extent is limited to a specific kind of task (e.g. modeling, implementation or verification). A possible drawback of the language could be the complexity of the attained process models, as well as the language’s learning curve to users; (ii) Intermediate: a medium number of constructs (20 to 40) are made available to express process models. Due to the fact the language uses concepts that are closer to the process domain, the semantic gap among different communities of users is lower. However, the language extent is also limited to a short set of tasks (e.g. modeling, simulation, verification) within process modeling; (iii) Broad: a larger number of constructs (more than 40) are available for process modeling. Simpler models can be achieved given the semantic richness of the constructs. The extent of the language is broader, since it could include tasks such as modeling, implementation and verification. 2. Level of Adoption: is related with the dissemination of the language as process modeling language. 24
2. P ROCESS M ODELING
2.5. Process Modeling Languages
(i) Scarce: used only in restrict communities, given the level of expertise required to master the language (e.g. researchers), or the fact of being attached to specific tools; (ii) Moderate: the diffusion spread out several communities with different interests regarding process modeling; (iii) Wide: massive adoption to the point that became a de facto standard. 3. Target Users: is related to the main beneficiaries of the language. The main users would be among the members of academia and industry. Ideally a language should be able to serve activities of design, documentation, validation and verification, regarding process modeling, on both communities. (i) Specific Community: the language has a great level of specialization and it only intends to serve a specific community (academics or practitioners); (ii) Some Users of Several Communities: albeit the language addresses both communities, only specific type of users in each community are targeted, given the specificity of their activities; (iii) All Users from Several Communities: besides addressing both communities, users with several technical backgrounds, in each community, benefit from the use of the language. For instance in the case of practitioners: process analysts (for process elicitation and design) and process implementers (for process verification and deployment in BPMS engines). 4. Depth in Verification: it concerns to the extent and deepness of verification process available directly from the language itself or via transformation to another language or tools (e.g. properties checking tools). (i) None: there is no concern about verification (ii) Semi–formal: the emphasis goes to the syntactical verification of process models; (iii) Formal: ensures a syntactical and semantic checking, as well as properties verification of process models. 5. Kind of Notation: is about the symbolic representation used by the language to represent process modeling constructs (i) Diagrammatic: the approach emphasizes the graphical notation; (ii) Mathematical: the approach is grounded by logical or algebraic foundations, targeting processes’ simulation, execution or formal verification; (iii) Diagrammatic & Mathematical: a composition of graphical and mathematical notations provides both usability and soundness to process modeling. 6. Tools Availability: it is related with the users’ accessibility to a diversified set of tools supporting the language for process modeling, as well as transformation to another format to benefit from models’ interchange among tools. A language being supported by a 25
2. P ROCESS M ODELING
2.5. Process Modeling Languages
vast range of tools, enables its widespread adoption and practice usage. Furthermore, the availability of a large number of tools, increases the competitiveness among tools makers for enhancing the tools’ functionalities, anchored in research and innovation, which ultimately benefits users. (i) Few: only a small number of tools and methods for that language, are available (up to 10); (ii) Some: a larger number of tools and methods (10 to 30 tools) with similar characteristics, ensures some choice options to users; (iii) Many: a competitive market (more than 30 tools) shortens the life cycle of tools’ versions. New available releases bring new functionalities and enhancements regarding the process modeling. Are available also, alternatives for models’ interchange.
2.5.2
Characterization of BPMLs
In the following sections are analyzed and ranked the set of above mentioned semiformal and formal/executable languages, according to the specified taxonomy. We are aware that these languages were developed with different audiences and objectives in mind, but all of them have been used to describe different facets of processes. The intent of the analysis is not to explore the construction rules for process models, using each BPML. Rather we intend to analyze the BPMLs, comparatively and critically, along each dimension of the taxonomy. Below we list all the analyzed BPMLs, as well as the section where the analysis is detailed. • Business Process Model and Notation (BPMN) (section 2.5.2.1) • Activity Diagram (AD) (section 2.5.2.2) • Event-Driven Process Chain (EPC) (section 2.5.2.3) • Petri Nets (P/N) (section 2.5.2.4) • Yet Another Workflow Language (YAWL) (section 2.5.2.5) • Subject-oriented Business Process Management (S-BPM) (section 2.5.2.6) • Business Process Execution Language (section 2.5.2.7) 2.5.2.1
Business Process Model and Notation (BPMN)
1. Extent of Concepts. BPMN was developed to enable business users to build readily understandable representations of business processes. BPMN is one of the most recent BPMLs, so it is grounded on the experience of earlier process modeling languages, which ontologically makes it one of the most complete BPMLs [RIRG05, RRIG09]. BPMN can be used within many methodologies and for many purposes, from high-level descriptive modeling to detailed modeling intended for process execution [Whi05]. The Object Management Group (OMG) made the BPMN 2.0 version more technical and more IT oriented, so besides the graphical notation (see Figure 3.4), BPMN encompasses a level of detail regarding modeling constructs, which enables BPEL code generation. So, by supporting 26
2. P ROCESS M ODELING
2.5. Process Modeling Languages
the details of graphical object’s properties, BPMN offers a standardized bridge for the gap between the business process design and process implementation [Whi05]. (Rating according the taxonomy: Broad.) 2. Level of Adoption. BPMN has emerged as an important open standard notation for depicting and modeling business processes [Gao06]. In a survey dated from 2011, including 559 practitioners [HW11], when asked which language they were using, the vast majority (72%) acknowledged the use of BPMN. Relying on the mentioned survey, one can conclude that, by far, the most relevant process modeling language nowadays for practitioners, is the OMG’s BPMN standard. (Rating: Wide.) 3. Target Users. The focus of BPMN is producing understandable documentation of business process models, to enable business analysts to develop understandable graphical representations of business processes that can be used by different kinds of user groups [BPM11]. So, target beneficiaries of BPMN range from the process developer, who has more focus on the technical aspects, up to the business analyst, who is focused into managing and optimizing of business processes. There are also plenty of research works in academia about BPMN, from ontological and usability, formalization to implementation [RIRG05, BO10, DDO07, REH11, Whi05]. (Rating: All.) 4. Depth in Verification. BPMN language is specified by means of a metamodel [BPM11] expressed with the UML, the notation which is the de facto standard for modeling software engineering artifacts [OMG07a, OMG07b]. BPMN metamodel enables the syntactical validation of business process models by tools. Furthermore, several transformations are also available, from BPMN to other languages, complementing the models’ syntactical validation with properties formal verification, using notations and specific model checking tools such as Petri nets [DDO07], Communicating Sequential Processes (CSP) [WG08], and Colored Petri Nets (CPN) [REH11]. (Rating: Semi–formal.) 5. Kind of Notation. BPMN has a semantical rich graphical notation (see Figures 3.2 an 3.3). Besides the regular constructs for activities’ control flow behavior, BPMN offers a visual representation for abnormal flows, such as fault handling, escalation handling, and compensation handling. BPMN also supports data flow and interaction behavior. BPMN is considered amenable for being used in processes’ elicitation within companies, as well as representation of processes’ interactions among organizations [Tsc10]. (Rating: Diagrammatic.) 6. Tools Availability. BPMN, with more than 80 diagrammatic tools10 , is nowadays the business process modeling language with more tool support available. BPMN tools generally allow for modeling artifacts being interchanged among tools from different vendors. Most of the interchanged models use a serial representation of business process model through dialects of XML11 : (1) XPDL defines a common interchange format; the BPMN and the XPDL specifications address the same modeling problem from different 10
See a list in http://www.bpmn.org/ [accessed in Feb. 10, 2013] and [HCKP09] XML is a World Wide Web Consortium (W3C) standard available in http://www.w3.org/XML/ [accessed in Feb. 10, 2013]. 11
27
2. P ROCESS M ODELING
2.5. Process Modeling Languages
perspectives (graphical notation vs. text notation); (2) XMI is a model driven XML interchange framework for definition, manipulation and integration of XML metadata and objects [OMG11]; XMI provides rules by which a schema can be generated for any valid XMI-transmissible MOF-based metamodel [Gao06]. (Rating: Many.) 2.5.2.2
Activity Diagram (AD)
1. Extent of Concepts. The UML is a graphical notation used in object-oriented software development for creating visual models. The Activity Diagram [OMG07b], one of UML behavioral diagrams, is particularly suitable for software systems processes’ representation (e.g. use cases’ description and workflow modeling, as well as methods’ specification). The UML specification provides an interrelated sets of packages specifying the features of Activity Diagrams (see main concepts depicted in Figure 2.3). The BasicActivities package provides the most fundamental features of the Activity diagram, which are those found in most BPMLs, such as simple activities and actions, flow from one activity or action to another, decisions, and input and output values for actions. The IntermediateActivities and CompleteActivities packages provide further refinements to this package. The StructuredActivities package and its subpackages provide modeling support of structured constructs found in traditional programming languages, such as loops and conditionals, as well as exception handling. Activity Diagrams, as an enhanced version of flowcharting, addresses the functional modeling of systems, and was considered for long suitable for purposes of business process modeling. However, AD’s technical nature revealed ultimately that it was mostly suited for business process automation and did not provide a comprehensive support for dedicated business process analysis [Lon04]. Being aware of these limitations, the OMG promoted the creation of the Business Process Definition Metamodel (BPDM)12 , to handle business processes specifically. BPDM provides abstract concepts as the basis for consistent interpretation of specialized concepts used by business process modelers [OMG08a]. (Rating: Intermediate) 2. Level of Adoption. In the above mentioned inquiry from 2011 [HW11], 18% of the respondents acknowledged the use of AD for business process modeling. This seems representing a moderate to low usage of the language. The main reason seems to be the availability of a suitable language for the purpose of business process modeling (BPMN). Therefore, AD seems to be set aside to activities more connected with software analysis and design. (Rating: Moderate) 3. Target Users. The Activity Diagram has been widely accepted as an analysis and design technique by object-oriented communities of both academics and practitioners. However, its use remained somehow confined to the area of software development, where UML is the accepted standard [All10]. A study [BO10] comparing AD with 12
http://www.omg.org/spec/BPDM/ [accessed in Feb. 10, 2013].
28
2. P ROCESS M ODELING
2.5. Process Modeling Languages
Figure 2.3: Activity Diagram metamodel [OMG07b] BPMN, reveled a similar usability, as well as learning curve, by business analysts. Possibly due to AD’s more process development focalization, it did not attain a generalized and spread acceptance by business process modeling practitioners. (Rating: Several) 4. Depth in Verification. Conversely to programming languages, AD lacks a universally agreed behavioral semantics. The steps from functional specification of a system using AD to its final implementation, faces the hindrance caused by different interpretation of the produced artifacts. A well-defined formal semantics of AD would allow that models could have a rigorous interpretation and reasoning support, as well as a being subject to formally grounded verification. To circumvent this limitation, there are approaches seeking for formalization of AD semantics and translation to languages such as: (1) Petri nets, through the specification of the behavioral semantics for the purpose of formal verification [Fah08], with the resulting Petri/Net model being amenable for verification of control-flow errors with current model checkers (e.g. LoLA13 ); (2) CSP gives a process’s semantics to the AD demonstrating the consistency of the object model. CSP also facilitates the access to other methods and tools [BD00]. (Rating: Semi–formal) 5. Kind of Notation. In AD business processes are graphically represented as a directed graph, i.e., a set of nodes and edges, with a kind of intuition inherited from Petri/Nets [EFLR98]. Some nodes denote executable action or structured activity, while others represent the execution’s flow control (e.g. decisions, merges, forks, and joins). So, AD notation represents business processes as a logic sequence of tasks governed by points of control. The semantics of a specific process model can be enforced by attaching Object Constraint Language (OCL) clauses to model elements, which contributes to bring more rigor to the AD specification, thus decreasing the subjectivity inherent to the AD graphical language. However, this is only possible at model instance level and not by 13
http://www.service-technology.org/uml2owfn/ [accessed in Feb. 10, 2013].
29
2. P ROCESS M ODELING
2.5. Process Modeling Languages
AD construction. As with other UML diagrams, AD notation lacks a formal static and behavioral semantics [EFLR98]. (Rating: Diagrammatic) 6. Tools Availability. As a popular and mature software modeling language, UML and particularly Activity Diagram, are widely supported by more than five dozens of tool vendors14 . Since the UML metamodel is expressed by the Meta-Object Facility (MOF), XMI can be used for exchanging activity diagrams information among tools, as well as for serialization of process models to be transformed to other languages. (Rating: Many) 2.5.2.3
Event-Driven Process Chain (EPC)
1. Extent of Concepts. Event-driven process chains [SN00] is a graphical business process language for modeling, analyzing, and redesigning business processes. EPC describes processes on the level of their business logic, and intends to be easily understood and used by business people [Kor08]. A claimed major strength of EPC notation is its simplicity and ease of understanding [Tsc10]. EPC process models are event-driven, i.e. state-based, which means that the main focus for a process model is the representation of processes’ states and their transition, rather than the interaction and communication among organizations. Processes modeled with EPC depict only the internals of an organization [Tsc10]. The EPC is based on the concepts of stochastic networks and Petri nets. The core EPC elements are formed by few constructs (function, event, OR-connector, XOR-connector, ANDconnector, and control flow depicted as shadowed elements in Figure 2.4), which are understood as enough for specification and documentation of process models. The basic version of EPC was supplemented by other constructs (organizational unit, position, data, system, process link, and relation, the non-shaded elements in Figure 2.4), resulting in the extended EPC, intended to supplement process models with organizational structure and data flow. However, EPC has less expressiveness than BPMN, and its constructs are considerable fewer and not so well specified as in BPMN [Tsc10]. Furthermore, EPC process models are not intended for being detailed in order to be executed. EPC is a notation to model the domain aspects of business processes. The focus of the notation is mainly on domain concepts and processes representation rather than the formal specification or technical realization [Wes07]. (Rating: Narrow.) 2. Level of Adoption. EPC existence and spread out usage as a process modeling language, was highly linked to the SAP ERP implementation. However, due to the fact of being a none-standardized proprietary notation, the industry’s interest vanished [Tsc10] and turned to BPMN. In the already mentioned survey [HW11], only 8% of respondents acknowledged the use of EPC as a business process modeling language. Among researchers we have seen some interest in EPC, mainly regarding empirical validation of EPC process models [Men07] and the supplementing of EPC structural limitations, through a more rigorous execution semantics and verification methods [vdA99, 14
http://case-tools.org/uml.html [accessed in Feb. 10, 2013].
30
2. P ROCESS M ODELING
2.5. Process Modeling Languages
Figure 2.4: Event-Driven Process Chain metamodel HOS06]. (Rating: Scarce.) 3. Target Users. EPC, due to its graphical notation and semiformal nature, allows business analysts benefit some degree of freedom when expressing business processes. Since event-driven process chains are primarily used to model business processes at higher level, and humans have non-local knowledge, it becomes more easy to interpret EPC constructs (e.g. the semantics of the or join). However, when it comes to business processes implementation, systems engineers can have to rework models in order to remove ambiguity and make explicit what was intended by the business analysts. (Rating: Specific.) 4. Depth in Verification. EPC provides an informal notation for representing business processes and their environment [Wes07]. Only the core set of EPC elements are formalized, and documented. The extended elements of EPC are neither formalized nor well documented [Tsc10]. One particular issue is EPC requirement of non-local semantics [Kin03]. For instance in the case of the control flow construct or join, due to the non-local semantics, the decision on when to use the join needs non-local knowledge [Wes07]. Several scientific articles (e.g. [vdA99, HOS06]) are devoted to providing well-defined execution semantics to EPCs. In [vdA99] EPC models are formalized by mapping to Petri/Nets. Workflow Nets15 [vdA96], an extension of Petri/Net, have been used for translating EPC and to facilitate the verification of model’s properties [VdA97] with respect to deadlocks and proper termination [Wes07]. (Rating: Semi–formal) 5. Kind of Notation. EPC has a diagrammatic notation that allows modeling from a business perspective. In a EPC model, entering into a business-relevant state is depicted through an event. Events (passive elements that do not provide decisions) trigger functions and vice–versa. Functions are fine-grained units of work. Functions, as active elements, transform inputs into output. Both inputs and outputs can be data or products/services. Functions can include decisions, through associated connector nodes, that 15
http://woped.ba-karlsruhe.de/index.php?id=7 [accessed in Feb. 10, 2013].
31
2. P ROCESS M ODELING
2.5. Process Modeling Languages
impact the behavior of the business process. Connectors model causal ordering relations, i.e. they represent the process logic through splits and/or joins. The bipartite structure of EPC models, in which events and functions alternate, can lead to complex process representations difficult to understand and cope with [Wes07]. (Rating: Diagrammatic) 6. Tools Availability. The EPC was mainly disseminated by the modeling tool ARIS (Architecture of Integrated Information System)16 , and as a notation used by the SAP R/3 reference model17 . EPC is supported by only a few modeling tools of other vendors18 [All10]. The EPC metamodel and process data can be transformed to equivalent XML like representations, such as the EPML (EPC Markup Language) [MN05]. (Rating: Few)
2.5.2.4
Petri Nets (P/N)
1. Extent of Concepts. The Place and Transition Nets or simply Petri Nets (P/N) [Pet62, DR98] is a special kind of graph technique, aimed at representing the behavior of dynamic systems [Mur89], and being used for business process modeling. The P/N comprises a small set of modeling elements (Figure 2.5): two kinds of nodes and one connector. The classical P/N, is a bipartite graph composed by a set of places linked via directed weighted arcs to a set of transitions. Connections between nodes of the same type are not allowed. The places that are upstream from a transition are called its input places. The places that are downstream are the transition’s output places. A transition is said to be enabled if each input place contains at least as many tokens as the weight of the arc linking it to the transition [MTJ+ 10]. In a P/N, the static structure of a dynamic system is represented by a graph. The dynamic behavior is captured by tokens moving between the graph nodes, constrained by firing rules. P/N is a state-based method, i.e., an instantiated P/N explicitly represents the state of a process model [Tsc10]. The dynamic behavior of a system is represented by the consecutive state changes [Wes07]. It have been argued P/N lakes expressiveness to deal with some control flow patterns [AH10] namely, the multiple instances pattern, or split, or join and the discriminator pattern [Wes07]. In the context of business process modeling, P/N have been used to perform models’ formal analysis and verification [VdA94, VdAVH96]. With P/N it is possible before the implementation phase, to simulate and analyze the properties of different alternatives for the design of a business process. However, the transformation from formal specifications into executable processes is not straightforward [VdAVH96]. (Rating: Narrow) 16
http://www.softwareag.com/corporate/products/new_releases/aris9/overview/ default.asp [accessed in Jun. 11, 2013] 17 http://goo.gl/xRfFqv [accessed in Jun. 11, 2013] 18 In http://en.wikipedia.org/wiki/Event-driven process chain [accessed in Feb. 10, 2013], less than 10 tools are mentioned
32
2. P ROCESS M ODELING
2.5. Process Modeling Languages
Figure 2.5: Classical Petri Nets metamodel 2. Level of Adoption. The classical Petri/Net technique has been used in many applications in several domains, as a formal verification tool (e.g. systems concerning production, logistic, manufacturing, administrative, workflow, computer systems, and realtime, as well as communication protocols) [VdA94, VdAVH96], given its suitability to represent reasonable complex behaviors. As business process modeling technique, P/N has not achieved a wide acceptance by business analysts and domain experts, due to its formalism and semantic gap between problem and solution domains. P/N is semantically less expressive when compared to other BPMLs. The adoption of BPMN, AD or EPC, overcame the P/N usage. (Rating: Scarce) 3. Target Users. As was previously mentioned, P/N main applications have been in describing and studying systems that are characterized as being concurrent, asynchronous distributed, parallel, nondeterministic, and/or stochastic. Therefore, P/N usage has been confined to people with formal methods background. P/N relevance is recognized when soundness evidence is required, either by IT specialists or computer science researchers. When describing real cases, P/N is not concise and flexible enough for modeling highlevel and complex business processes [LA94]. P/N usually generates large models, hard to understand and manage. Therefore, it was consensually agreed that P/N was not the most appropriate tool to be adopted by business engineers, more concerned with the problem domain [MTJ+ 10]. Using P/N for business process modeling leads to the lost of structural and semantical information [Tsc10], since the functional perspective is only conveyed abstractly [Wes07]. (Rating: Specific) 4. Depth in Verification. P/N allow for many analysis techniques. These techniques can also be used to analyze modeled business procedures. P/N theory, enables, for instance, the verification of business processes’ safety properties (e.g. reachability, boundedness, liveness, and reversibility and home state), correctness (e.g. absence of deadlocks and traps), and invariance properties (e.g. by proving that, for an external observer, two processes behave logically the same way, which allows to evaluate alternative designs), as well as business processes’ performance measures (e.g. response time, delay time, 33
2. P ROCESS M ODELING
2.5. Process Modeling Languages
occupation rate) [VdAVH96]. In spite of P/N constructs being semantically far from the abstractions that business process modeling users are familiarized, the P/N representation serves as a solver-independent medium between the problem domain and the analysis techniques [VdA94] for more well-known BPMLs such as BPMN [DDO07], AD [Fah08] or EPC [vdA99]. So, P/N formalism can be seen as a low-level language, almost as a kind of assembly language level modeling language, i.e. a formal supplement of other business process languages [MTJ+ 10]. (Rating: Formal) 5. Kind of Notation. P/N is a graphical representation of systems with mathematical foundation, aiming at assisting analysis of the structure and dynamic behavior of modeled systems, especially concurrent ones [Pet77]. As a graphical tool, P/N can be used, in certain contexts, as an instrument of communication for requirements gathering, modeling and analysis [Gia01]. Places can be used to model the flow of work, whereas transitions can be mapped into activities. A token can represent organizational resources or entities, such as documents, materials, services, equipments, or persons. In addition, tokens can be used in these nets to simulate the dynamic and concurrent activities of systems [Gia01]. The transitions linked together by places define a partial ordering of tasks. Transitions can also be added to the model to represent control flow elements (such as fork and join), which provide routing, parallelization, or synchronization of the work flow. Classical Petri/Nets describing actual systems, often distributed and temporal constrained, tend to be complex and extremely large. To solve this problem, the classical Petri/Net model gained extensions such as color, time, and hierarchy: ’colored’ tokens facilitate the modeling of objects’ attributes; the ’time’ construct allows to model the temporal behavior of a system; and the ’hierarchy’ construct enables the decomposition of complex systems. A number of extensions to the basic P/N formalism were proposed to overcome the P/N initial limitations, such as High-level Petri/Nets [VdA94], GSPN (Generalized Stochastic Petri/Nets) [Mar90, CMBC93], CPN (Colored Petri/Nets) [Jen94, Jen97, Jen98, KCJ98], OOPN (Object-Oriented Petri/Nets) [Lak95], and TPN (Time Petri/Nets) [LS00, dFS08]. A precise and unambiguous description of the business process behavior is the result of a modeling process using P/N. Such preciseness and the firm mathematical foundation of P/N have resulted in the affluence of analysis methods and tools [VdAVH96]. (Rating: Diagrammatic & Mathematical) 6. Tools Availability. The richness of P/N analysis techniques have made bloom the availability of tools19 . More than fifty options are available for analyzing classical P/N, and dozens for more advanced P/N, such as High-level P/N, P/N with Time, Hybrid P/N, Stochastic P/N, Object-oriented P/N, Modular high-level P/N, Colored PN, etc. (Rating: Many) 19
http://www.informatik.uni-hamburg.de/TGI/PetriNets/tools/quick.html [accessed in Feb. 10, 2013]
34
2. P ROCESS M ODELING
2.5.2.5
2.5. Process Modeling Languages
Yet Another Workflow Language (YAWL)
1. Extent of Concepts. Process modeling constructs in YAWL encompasses the conceptual and the execution level [Jur11]. The motivation for the development of YAWL [tHvdAAR09] was the ability to support directly all workflow (control flow) patterns20 [Wes07, AH10]. The basis for the semantical foundation of YAWL was the P/N and their various extensions, in particular Workflow Nets21 and reset nets [LS07]. Therefore, the semantics of YAWL has been defined in terms of a large Colored P/N. YAWL uses extended workflow nets as building blocks, enhancing them with notational convenience (e.g. direct arcs between transitions), explicit split and join behavior that can be attached to transitions, nonlocal behavior (on the firing of a transition, parts of the extended workflow net are cleansed of tokens), and the handling of multiple instances tasks. Conditions are represented by circles and tasks are depicted by rectangles (see in Figure 2.6 the main constructs of YAWL). The initial condition and the final condition of an extended workflow net are labeled with specific symbols. There are several notational extensions for tasks (composite tasks mapped to an extended workflow net, tasks with multiple instances, composite tasks with multiple instances). The graphical representation of the split and join behavior of a task is equivalent to that in workflow nets. For each task a cancellation region can be defined. Since P/N already supported most of the control-flow patterns, the YAWL’s designers took the P/N as a starting point to extended the P/N formalism with three main constructs, namely or-join, cancellation sets, and multi-instance activities. These three concepts aimed at supporting the patterns that were not directly supported in P/N, namely synchronizing merge, discriminator, M-out-of-N join, multiple instance with no a priori runtime knowledge and cancel case. In addition, YAWL added other syntactical elements to P/N in order that the language could capture other workflow patterns, namely simple choice (xor-split), simple merge (xor-join), and multiple choice (or-split). It was pointed out not completely satisfactory YAWL representation of some advanced control flow patterns [Wes07], including the discriminator and the M-out-of-N join. On the other hand, the graphical representation might become cumbersome if the tasks and conditions are spread across a large workflow specification and if multiple tasks remove tokens. (Rating: Broad) 2. Level of Adoption. YAWL is, until now, mainly a research project with scarce adoption by industry22 . A reason for which YAWL did not catch the attention of the process modeling community, could be its academic origin, as well as the strong competition of already existent BPMLs, such as BPMN, AD and EPC. According to Börger, YAWL fails to provide the practitioners with suitable concepts to 20
http://www.workflowpatterns.com/ http://woped.ba-karlsruhe.de/index.php?id=7 [accessed in Feb. 10, 2013] 22 In http://www.yaug.org/projects [accessed in Jun. 14, 2013] is only referred one YAWL implementation in a clinical environment. 21
35
2. P ROCESS M ODELING
2.5. Process Modeling Languages
Figure 2.6: Yet Another Workflow Language metamodel
guarantee that business processes are best described for the purposes of analysis and subsequent ¨ automation [B12]. Furthermore, workflow patterns, which is the basis for YAWL expressiveness, seems not being perceived, by process modelers in general, as the fundamental aspect for being the basis for the construction of a business process modeling language. The YAWL notation itself is a drawback since it is only familiar to people closely related to workflow nets and P/N notations. (Rating: Scarce) 3. Target Users. The graphical nature of YAWL allows for models used from the conceptual stage to the execution level, hence covering different levels of abstraction. Given the similarities between logistics and administrative processes, both aiming at a reduction of throughput times and resources, it is advocated the advantage of using YAWL as a modeling tool in both kind of industrial systems [VdA94]. The YAWL language targets both business analysts and process implementers, both in industry and academia. (Rating: All) 4. Depth in Verification. YAWL has formal semantics, thus leading to precise and unambiguous descriptions. The behavior of the modeled systems implemented in YAWL can be analyzed simillary to those expressed with P/N. The overall idea for expressing the execution semantics is that each task is represented by an individual state transition diagram. A state transition diagram of a task specifies its current state. The state of the process instance is then represented by the combined state of all tasks involved in the process instance, plus conditions that are currently met at the process level. During the design of the language, it was concluded that some of the extensions that were added to P/N could not be re-encode back into plain P/N. Hence, the original formal semantics of YAWL was defined as a labelled transition system and not in terms of P/N. The fact that YAWL is based on a formal semantics has enabled the implementation of several techniques for analyzing processes in the YAWL engine. (Rating: Formal) 36
2. P ROCESS M ODELING
2.5. Process Modeling Languages
5. Kind of Notation. The notational elements of YAWL borrows most constructs of workflow nets. Process models use extended workflow nets as building blocks, and multiple extended workflow nets involved in a process model specification can be connected to each other by composite tasks. As a high-level P/N, YAWL combines a rigorous mathematical notation with the graphical notation. There are differences with respect to handling tokens. Conversely to P/N, in extended workflow nets, tokens reside at transitions while the transition is being executed. This also means that the execution of a transition takes time, another difference to P/N and to workflow nets, in which the firing of transitions is not time consuming [Wes07]. (Rating: Diagrammatic & Mathematical) 6. Tools Availability. YAWL currently was only implemented by one tool23 , which allows the specification and execution of workflow models. In [DDDGB08] a tool is described that carries out the transformation between BPMN diagrams to YAWL nets. (Rating: Few) 2.5.2.6
Subject-oriented Business Process Management (S-BPM)
1. Extent of Concepts. S-BPM is a communication view based on subjects, which can compose a business process orchestration or a choreography. The S-BPM modeling paradigm comprises a small set of modeling elements (Figure 2.7). The constructs used to model any process allows direct transformation into executable form. Each business process consists of two or more subjects that exchange messages. Each subject has an internal behavior (control flow between different states), which are receive and send messages and do something. There are more elements used, but they are not necessary, and only exist for syntactical sugaring. In S-BPM the focus is put on the acting elements within a process: the subjects. They execute and synchronize their activities by exchanging messages. A message is based on the structure of sentences in natural languages (subject, predicate and object). The subject is the initiator of an activity, the activity is the predicate and the target of the activity the object of the sentence [Fle10]. The sequence in which subjects carry out their activities is described in the subject behavior. Each subject has an input pool in which the sending subject deposits the messages for this subject. The corresponding subject accepts messages by removing them from the input pool. By configuring the input pool of a subject we can specify which messages from which subject are received synchronously or asynchronously. Messages transport business objects which contain information that can be hierarchically structured. In a send state, a subject tries to send several messages alternatively. In a receive state a subject can accept several messages alternatively. Internal actions of subjects are defined on internal data like business objects. Internal actions can change business objects or check the values of elements in a business object, or both. 23
http://www.yawlfoundation.org/ [accessed in Feb. 10, 2013]
37
2. P ROCESS M ODELING
2.5. Process Modeling Languages
Processes are connected via the communication of subjects in the connected processes. Subjects in one process exchange messages with subjects in other processes they are connected to. Service processes are very similar to connected processes. In a service process there is a subject which is visible to all other processes. This subject is called the interface subject. This interface subject accepts messages from subjects in any other process. Multiprocesses are an extension of connected processes. If a multi-process receives a certain message from a connected process, a copy of the multi-process is generated. A process can be connected to another process. This connected process can in turn be connected with other processes and so forth. In this way, hierarchical networks of connected processes can be constructed. Each process can consist of subjects and other processes. There can be any number of internal subjects not visible to other processes. If it is not required that specific actions being executed in a certain order, a choice operator can be used to express the overlapping execution of action sequences. Normally, each subject has only one active state. An active state is the state representing the next action to be executed by the corresponding subject. Identical activity sequences are used in behavior specifications of a subject at several places in the behavior description or in several different subjects. These sequences can be defined once as a macro. Macros can be embedded in subject behaviors where the corresponding macro behavior is required. Since S-BPM is based on a process specification language, with a formal semantics, it allows that executable workflows can be generated automatically from a process model [Fle10]. The search for new methods such as S-BPM has been motivated by the demand to better support human collaboration and communication in business processes (e.g. ad-hoc processes, empowerment, human interaction workflows), which seems to be not well supported by current approaches. (Rating: Broad)
Figure 2.7: Subject-oriented Business Process Management metamodel 2. Level of Adoption. S-BPM is still a language in development. Its adoption (only a dozen of reported installations24 ) seems mostly to occur in research projects instead of 24
http://www.metasonic.de/en [accessed in Feb. 10, 2013]
38
2. P ROCESS M ODELING
2.5. Process Modeling Languages
full fledged BPMS. Originally launched as an academic project, S-BPM has slowly been acknowledged by the business process modeling community, as an alternative perspective for modeling business processes in organizations [FSS+ 12a]. (Rating: Scarce) 3. Target Users. Process modelers that participate in organizational developments use natural language constructs and e-mail-like communication patterns between them, when describing business processes. Hence, all stakeholders of an organization can contribute to the process specifications, and the delivered specifications processed without transformations. In subject-oriented modeling scheme actors are acknowledged as the entry point for modeling, leading to an approach that takes into account standard sentence semantics (subject, predicate, object). By using subjects, stakeholders intends to avoid that conveyed information be reduced either to content or functional business logic. (Rating: All) 4. Depth in Verification. The language of S-BPM is called Parallel Activity Specification Schema (PASS). It is based on the grammar of natural languages, Calculus of Communication Systems (CCS) theory [Mil99] and the concepts of object-oriented programming. These concepts are extended by additional pragmatic elements, which allow a specification of various recurring behavioral aspects in business processes. It were also added additional elements to support the structuring of highly complex and extremely large process systems [FSS+ 12b]. CCS is a process algebra [Mil99] used for algebraic modeling of parallel processes and consists of elementary actions and operators for joining actions. The main objective of CCS was to provide a mathematical framework to describe communicating systems in a formal way. Processes can interact with the neighbors or independently perform activities in parallel. The aim of CCS is to model the communication between processes, e.g., to investigate their equivalence. A process uses ports as enablers of communication with other processes, whereby each port has a name. The active element in CCS, the actor, is seen as essential, while predicate and object play a subordinate role. Thus, CCS can be considered a subject-oriented method. Subject orientation include actors into the structures of coarse-grained business processes providing directions to their decomposition for implementation at a detailed service level. Once the patterns regarding the interaction among actors (subjects) has been refined regarding the exchange of messages, the program code can be then automatically generated in a more suitable way. Executing process models provides immediate organizational user experience, since it abstracts from implementation details related to programming languages or software execution. (Rating: Formal) 5. Kind of Notation. The information in S-BPM is presented in diagrammatic form, by focusing on the interaction among subjects. The principles of decomposition and hierarchy-specific associations is also followed by S-BPM. The subject, predicate and object of concern have, in conceptual terms, the same importance for humans when reality is modeled. The use of identical formal representations drives to concise models in terms of flow control. S-BPM triggers the shift of process modeling paradigms from the focus 39
2. P ROCESS M ODELING
2.5. Process Modeling Languages
on functions or activities to the emphasis on business entities and role-specific entities (actors, subjects). As mentioned, the S-BPM methodology is anchored in the mathematical framework of CCS-Calculus. Milner states that every interesting concurrent system is built from independent agents which communicate in a synchronized way [Mil99]. So the objects whose behaviors are modeled are called agents. An agent can be seen as a term for a locus of activity, a process, or a computational unit. The agent’s behavior is defined by the action it can perform and is represented using algebraic expressions. The notion of agent is CCS is mapped to the notion of subject in S-BPM. (Rating: Diagrammatic & Mathematical) 6. Tools Availability. S-BPM currently was only implemented by one tool (Metasonic Suite25 ), which allows the specification and execution of workflow models. On the other hand, I2PM26 serves as a community platform to bundle research and development activities in the field of S-BPM. (Rating: Few) 2.5.2.7
Business Process Execution Language
1. Extent of Concepts. BPEL is a industry standard [OAS07] that defines a model and a grammar for business processes’ orchestration and collaboration. BPEL ensures the means for connecting web services, as well as specifying how web services can be jointly used to provide more complex functionality implementing business processes. BPEL intends to give high flexibility to business processes execution and can be regarded as a foundation of the technical architecture of workflow oriented web applications [ZJ08]. Figure 2.8 depicts the main constructs of BPEL. BPEL introduces mechanisms for dealing with business exceptions and process faults. Moreover, BPEL defines how activities within a unit of work are to be compensated in cases where exceptions occur or a participant requests the operation’s reversion [CT12]. Broadly speaking, one can considerer two categories of activities in BPEL: basic activities and structured activities. Basic activities are contained in structured activities, and include constructs such as Invoke, Receive, Reply, Assign, Throw, Wait, Empty, and Terminate. Invoke is used to invoke web service operations, Receive and Reply are used to provide web services operations. On the other hand, structured activities include, for instance, the constructs Sequence, Switch, While, Pick, Flow. Pick allows to block and wait for a suitable message to arrives or for a time-out alarm to go off. Flow allows to specify one or more activities to be performed concurrently. While a powerful language, BPEL is difficult to use. Its XML representation is very verbose and requires experienced users. It offers many constructs and typically things can be implemented in many ways (e.g. using links and the flow construct or using sequences and switches). As a result, only experienced users are able to select the right construct [vdABL08]. BPEL shows the trend towards process-oriented programming. One of the aims of BPEL 25 26
http://www.metasonic.de/en [accessed in Feb. 10, 2013] http://www.i2pm.net/open-s-bpm [accessed in Feb. 10, 2013]
40
2. P ROCESS M ODELING
2.5. Process Modeling Languages
is to function as a serialization format and execution language for BPMN diagrams [CT12]. Since BPEL, as a process language is not complete, it is often used in conjunction with other languages to fill in the existing gaps. In addition, BPEL is often tied to proprietary implementations of workflow or integration broker engines. It was also acknowledged BPEL failure in supporting human tasks. Those tasks are usually allocated to human actors and require from them that other actions be completed, possibly involving physical resources. Some engines already provide extensions to BPEL for human tasks. It is expected that those extensions could be standardized in future BPEL versions. Last version of BPEL supports several of the Workflow Patterns [RM06]. As previously mentioned, BPEL is dedicated to process execution, and is designed to meet the needs in the environment of web services. Hence, BPEL does not include constructs amenable to be used for modeling business processes at an higher level of abstraction. (Rating: Narrow)
41
Figure 2.8: Business Process Execution Language metamodel Source: http://www.ebpml.org/bpel4ws.htm
2. P ROCESS M ODELING 2.5. Process Modeling Languages
42
2. P ROCESS M ODELING
2.5. Process Modeling Languages
2. Level of Adoption. In the already mentioned survey [HW11], 6% of respondents acknowledged the use of BPEL as a business process language. This figure is well below the one got by BPMN (72%), but above any other process execution language (e.g. YAWL, P/N). BPEL has yet many limitations that must be considered when searching for the final choice for serialization of BPMN diagrams. The transformation between these two languages is not straightforward, and has generated some debate among researchers [Gao06, WDGW08]. Indeed, there is still no complete solution that would fully cover the translation of any kind of BPMN diagram to BPEL. Current techniques focus either on some subset of BPMN, most often the basic subset, or some specific BPMN elements. Current transformations also impose constraints on the structure of BPMN diagrams [Jur11]. Many BPMN graphical elements cannot be represented in BPEL and many attributes and properties of BPMN constructs, lack of a precise meaning and have no representation in BPEL [CT12]. BPEL has attracted the attention both from practitioners and the researchers. The latter have been working in defining mapping rules, and formal verification of BPEL [Jur11]. It is expected that the adoption of BPEL will increase with the diffusion of BPMS engines, as well as due to mitigation of limitations in the current version. (Rating: Moderate) 3. Target Users. BPEL is not used by business analysts in analysis and design phases, since it offers no standardized graphic notation. Hence, BPEL language is not suitable for business analysts’ tasks such as value chain analysis or processes’ optimization analysis [Lon04]. Standing on top of the web service specification stack, BPEL became the de facto standard of process execution [Lon04]. Therefore, BPEL is mostly used by process implementers. (Rating: Specific) 4. Depth in Verification. BPEL is essentially a service modeling language based on blocks. BPMN process modeling language was established to be the main upstream provider of specifications to BPEL. As aforementioned, there is a mismatch between BPMN (a process model language) and BPEL (a service model language) [Jur11]. The different languages’ paradigm, together with the incomplete BPMN standard definitions hinders the transformation between them, making sometimes even impossible the verification of process implementation based on process modeling. The threads on research aiming to fill the gap between BPMN and BPEL are mainly based upon formal approaches. They include for instance: recognizing patterns in BPMN for defining standardized mapping rules; formal verification of diagrams; conversion to Petri nets, with existent methods of verification, and their subsequent conversion to BPEL; and formal logic approach using functional logic programming languages. Researchers have already captured the formal semantics of subsets of BPEL using formalisms, such as petri nets, process algebra and finite state machine. This has contributed for the development of static analysis tools for BPEL. [Jur11]. (Rating: Formal) 5. Kind of Notation. BPEL is a notation for specifying business process behavior based 43
2. P ROCESS M ODELING
2.5. Process Modeling Languages
on web services, and is layered on top of Web Services Description Language (WSDL), XML Schema, and XPath. WSDL messages and XML Schema type definitions provide the data model used by BPEL processes. XPath provides support for data manipulation. The external resources and participants are represented as WSDL services. Graphical information for BPEL is optional and tool dependent. (Rating: Mathematical) 6. Tools Availability. Since BPEL is driven by a standardization committee with several IT industry players [Jur11], it is supported by a relevant number of tools27 (both proprietary and open-source). BPEL as a business process implementation language based on Web services is executed by BPMS engines. Some platforms besides supporting the execution of BPEL code, provide also the ability to graphically specify BPEL processes in a proprietary notation. However, these tools are mostly focused on BPEL as a process execution language and do not provide enough level of integration with earlier stages of process modeling, such as with BPMN [Jur11]. (Rating: Some)
2.5.3
Assessment of BPMLs
In Table 2.1, we summarize the BPMLs’ assessment based upon the previously defined taxonomy. YAWL and S-BPM, seems to be the most well grounded process modeling languages, however without the level of adoption and tools availability of other languages. In an overall appreciation BPMN seems to be nowadays the most well positioned BPML. The main weaknesses identified in BPMN regards models verification (supported by techniques and properties checkers in other languages) and the notation (based upon a metamodel that enables models’ syntactical verification but lacking the semantic formal definition). Table 2.1: Summary of BPMLs Assessment Extent of Concepts Level of Adoption Target Users Depth in Verification Kind of Notation Tools Availability
BPMN
AD
EPC
P/N
YAWL
S-BPM
BPEL
� � � � O �
� � � � O �
O O O � O O
O O O � � �
� O � � � O
� O � � � O
O � O � � �
Legend: assigned values in each dimension converted to symbols (i) O (ii) � (iii) � Based in the previous assessment, we have chosen BPMN in this dissertation, as the process modeling language, to address our research problem of quality in process modeling. In brief, the best characteristics of BPMN are: • BPMN is currently the business process notation most used among process modeling practitioners [HW11], with a preference rate above 70%; 27
http://en.wikipedia.org/wiki/Comparison_of_BPEL_engines
44
2. P ROCESS M ODELING
2.6. Conclusion
• BPMN is a process modeling standard backed up by OMG, so the language definition is based upon a metamodel [BPM11] built with UML, the notation which is the de facto standard for modeling software engineering artifacts [OMG07a, OMG07b]; • BPMN is one of the most recent BPMLs, so it is grounded on the experience of earlier BPMLs, which ontologically makes it one of the most complete BPMLs [RIRG05, RRIG09]; • BPMN has transformations to other available notations, such as CSP [WG08] and P/N [DDO07], which allows the use of available tools for formal verification; • BPMN is the language with more modeling tools available.
2.6
Conclusion
The chapter begins by giving a historical context for the emergence of the process paradigm (section 2.1), and by introducing the main concepts regarding business processes and process modeling (section 2.2). Is put some care, to differentiate processes’ usage in several domains (section 2.3). We clarified also the particular perspective, of the multidimensional concept of quality, relevant in the context of this dissertation (section 2.4). The assessment made to current process modeling languages allowed to choose the better one positioned nowadays (BPMN), for addressing quality upon process modeling (section 2.5).
45
[This page is intentionally blank]
3 Analysis of the BPMN
"The limits of my language means the limits of my world." – Ludwig Wittgenstein
Contents 3.1
Introduction . . . . . . . . . . . . . . . . . . . . . . . . . . . . . . . . . . .
48
3.2
Modeling with BPMN . . . . . . . . . . . . . . . . . . . . . . . . . . . . .
49
3.3
BPMN Metamodel . . . . . . . . . . . . . . . . . . . . . . . . . . . . . . .
54
3.4
Weaknesses of the BPMN standard . . . . . . . . . . . . . . . . . . . . .
60
3.5
Conclusion . . . . . . . . . . . . . . . . . . . . . . . . . . . . . . . . . . .
64
Context: Currently, the BPMN is the most used language among process modelers. Objective: Assess the suitability of the BPMN for being used to produce good quality process models. Method: A set of BPMN tools was surveyed, for assessing whether they assist in designing good quality process models. Results: The BPMN models produced by the surveyed BPMN tools revealed flaws and poor quality. The main reason is due to the informal prescription of the rules in the BPMN standard. Limitations: The survey on BPMN tools considered a small set of BPMN rules. Conclusion: The BPMN has limitations that must be overcome in order to be able to better address the quality of process models. 47
3. A NALYSIS
3.1
OF THE
BPMN
3.1. Introduction
Introduction
The purpose of BPMN [BPM11] is to provide a notation understandable by different kinds of process modelers and users: (1) process analysts that sketch the initial documentation of the processes; (2) process implementers which are responsible for actually implementing processes; (3) business users which are accountable for processes’ usage and monitoring. This intended broad coverage of process models resulted in the usage of BPMN in many applications, from process documentation and improvement scenarios to technical applications of process modeling, such as workflow engineering, simulation or web service composition [IMR09]. The need for accurate specification of process models has emerged as a primary requisite of conceptual modeling activities. This need is present in various activities in the organization, namely when producing processes’ specifications to meet various regulatory and legal requirements (e.g. SOX [Lan03], BASEL III [Sup10]), for the analysis and design and development of process-aware information systems [DVDATH05], serviceoriented architectures [Erl07], and web services alike systems [IMR09]. Although BPMN can be used for all these purposes, the business and technical models produced are quite different in nature. The main focus of BPMN business models for documentation purposes is on the comprehension of the basic process flow. Thus, usually only the happy path is depicted, avoiding excessive details [Sil09]. Exception handling and abnormal situations are quite often disregarded. On the other hand, execution capabilities of the BPMN language are of interest when producing technical models. The need of process developers is on translating BPMN models into some machine readable language either for models’ sharing across multiple domains and using many different technologies (e.g. XMI, XPDL), simulation, and execution in distributed environment (e.g. integrating BPEL and web services standards). BPMN as a process modeling language joins different business centric points of view, with different levels of abstraction. Those perspectives are related to the analysis and design effort, as well as the simulation and execution of processes. The BPMN standard thus provides the ability for accommodating different sorts of constructs either for static graphical representation of models, as well as properties that provide information for simulation and execution of processes. Currently there are already tools (e.g. Bizagi1 ) that directly execute BPMN structures without having to transform them into BPEL or another format first. To harness all the potential of the BPMN standard, efforts still have to be carried out to tighten the different levels of abstraction of the process life cycle. As we will see, by ensuring the compliance of models made in primary stages of process modeling with BPMN well-formedness rules, it would be enforced the correctness of those process models and therefore their reuse from modeling to enactment and monitoring. Nevertheless, BPMN fills the set of criteria established [Lon04] as a requirement for 1
http://www.bizagi.com/ [accessed in Feb. 10, 2013]
48
3. A NALYSIS
OF THE
BPMN
3.2. Modeling with BPMN
being a business process modeling standard, namely: (1) a notation widely adopted either by business and technical people, due to its tool independence [HW11]; (2) a metamodel which provides an abstract syntax, through a consistent vocabulary of concepts and relationships; (3) the ability through the notation and metamodel of focusing and analyzing particular details of the process model (e.g. control-flow, data, organization); and (4) provide an exchange format for process models (e.g. XMI, XPDL). The remain of this chapter is structured as follows: section 3.2 addresses the recent evolution of BPMN, until to become the most widely used process modeling language, as well as its main characteristics. Section 3.3 provides an overview of the BPMN metamodel and introduces the main constructs used in the process orchestration. Some attention is also given to flaws detected in the BPMN metamodel, as well as proposed concepts not covered by current BPMN standard. In section 3.4 we highlight the weaknesses of BPMN which impact upon quality of BPMN models. Finally, section 3.5 concludes by summarizing the chapter.
3.2
Modeling with BPMN
From BPMN 1.2 onwards (Figure 3.1), increased substantially the number of changes to the BPMN standard. The updates made included either the addition of new constructs or the change of the elements’ properties defined in the previous versions of the standard, in order to resolve known inconsistencies and ambiguities [CT12]. The BPMN 2.0 specification is a step forward extending the scope and capabilities of the business process modeling language. The syntax of the language is formalized through the definition of a meta-model representing the language’s constructs and their relationships. Since BPMN [BPM11] is one of the most recent process modeling languages, it is ontologically one of the most complete which is available [RIRG05, RRIG09]. While, for instance, a UML Activity Diagram can be built from around 20 different modeling constructs [OMG07b], an orchestration BPMN process model has almost 100 different modeling constructs (see Figure 3.2), including among others 5 types of subprocesses, 9 task types, 6 gateway types, 3 activity markers, 5 data types, 3 sequence flow types, and 51 event types (see Figure 3.3). This gave to language even more expressiveness for diagramming, as well as for execution purposes [CT12]. The strong argument for BPMN, as a process modeling language, came since its inception with BPMN 1.0. According to an assessment made by Stephen White [Whi04], the standard is suitable for representing almost all aspects of the control-flow of the Workflow Patterns [AH10]. Control-flow patterns are used as a general pattern to compare the expressiveness of process modeling languages, since they are independent of any specific process modeling languages [Wes07]. Control flow patterns are defined at the process model level (with execution semantics applied to process instances). Some examples of control flow patterns include sequence, and split, and and join, as well as exclusive or split and exclusive or join. 49
3. A NALYSIS
OF THE
BPMN
3.2. Modeling with BPMN
Figure 3.1: Standards Timeline - Releases ( Source: [SWB+ 12])
The semantics of many of the BPMN constructs came clearly from the field of executable process specifications. Among others, one can refer special constructs dealing with loops, exception handling, and transactions. Programmers and IT-specialists are more familiar with these sort of elements. Process analysts typical only use a restricted part of the whole notation (see [zMR08]) and normally omit items with more complex semantics. However, some BPMN experts [Sil09] consider that these technical constructs should also be used by process analysts, in order that BPMN models are able to show business-relevant exceptions and their handling. In favor to this argument they recall the familiar 80-20 rule, which says that 80% of the costs, delays, and errors come from 20% of the cases - the ones that are the exceptions to the happy path. So, process analysts, as domain experts, should be the ones accountable for modeling exceptions. The large current number of diagrammatic symbols of BPMN increased their perceived complexity [ZMRI07]. As acknowledged in [IMR09], the complexity of process modeling languages affects the ability of process modelers to model the domain using a process-centric approach. In [May89] it is claimed that the learning performance, depends on the person’s characteristics, as well as by learning materials and the way concepts are presented. Language complexity is thus a significant issue, because it can affect the learnability, the ease of use and overall diffusion of a language. Recent studies [RIRG06, MR08, ZMRI07] on process modeling languages indicated also that the perceived complexity affects negatively the usage of those languages. However, paradoxically, also showed that languages such as BPMN, with a larger vocabulary, are used more frequently than others with a more restricted vocabulary (e.g. P/N, AD). 50
3. A NALYSIS
OF THE
BPMN
3.2. Modeling with BPMN
Figure 3.2: Concrete syntax of BPMN
51
3. A NALYSIS
OF THE
BPMN
3.2. Modeling with BPMN
Figure 3.3: Event types in BPMN (Source [BPM11])
52
3. A NALYSIS
OF THE
BPMN
3.2. Modeling with BPMN
There are several approaches, from different fields, which have been used in studies (e.g. comparison and analysis) about modeling languages in general, and business process modeling languages in particular. Some of those fields are: semiotics [KLS95, KS00, Kro03, Sin06], ontology [DGMR03, RGI04, RIRG05, GRI05, RI07, RRK07, RIG07, RRGI09, RRIG09], measures [BBM96, BRvU00], empirical studies [SRD03, GL06, OHNAEE+ 07], meta-modeling [LS97, RM98, zM99, RG02, DGMR03, BV10], and theoretical founded studies [HR85, vdA98, LS07, BBKK04]. We highlight here the ontology perspective, given its broad usage. Ontology-based evaluations use as basis a model of real-world concepts (a representational ontology) and involve a mapping between the model and the constructs of the modeling language. The Bunge-Wand-Weber ontology (BWW) [WW90a, WW90b, STW03], has been widely used for assessing business process modeling languages2 . BWW allows the evaluation of the degree of coverage by language constructs of certain dimensions (e.g. structural, dynamics, components) regarding process models. BWW was used in a study to investigate the extent in which different subsets of BPMN vary in their complexity [RIRG06]. The findings show that BPMN exhibits a large amount of language complexity due to constructs and constraints that are not graphically rendered. This indicates that the underlying rules and constraints of the language are a significant source of complexity. Those findings lead also to two relevant conclusions: 1. users tend to reduce the complexity of the language by ignoring the language’s underlying rules, when making practical usage of it. In the particular case of BPMN models, this means that process modelers violate BPMN underlying grammatical rules, using constructs outside of their designated scope; 2. not all BPMN constructs are equally used for modeling purposes. The bulk of the hidden complexity comes from constructs that are seldom used in practice. Thus, most of the complexity of the language is invisible to process modelers since they do not use the constructs whose semantic is more difficult to apprehend; In spite of a design far from being elegant, BPMN has found widespread acceptance by industry and a wide-ranging tool support. This suggests the importance given to the requirement of BPMN expressiveness even at the expense of its increased complexity. Researchers have shown that BPMN suffers from a number of shortcomings, being complexity one of them, which impacts the clarity of the language although not affecting the language’s acceptance [IMR09]. The findings also indicate that BPMN users, consciously or not, take active steps to reduce language’s complexity. Anecdotal evidence suggests that a common way of such reduction is through development and enforcement of modeling conventions within organizations. Modeling conventions typically mitigate the complexity of BPMN through a selection of constructs with an overall lower complexity and defining the patterns for better usage of those constructs. Summing up, if BPMN modelers are given the freedom to combine the large plethora 2 Green and Rosemann counted more than 25 papers that applied the BWW ontology for the analysis of modeling grammars [GR05].
53
3. A NALYSIS
OF THE
BPMN
3.3. BPMN Metamodel
of modeling constructs available, in the absence of any verification / recommendation facility embedded in the used modeling tool, inconsistent and/or even invalid models can easily be produced. Incidentally this is not different from the problem that occurs with some other languages (e.g. EPC, Workflow Nets) [CMNR06]. The great flexibility of BPMN allows that non savvy modelers might combine BPMN elements in a faulty and unstructured process model. Moreover, it is not straightforward that examining a graphical description of a process could allow users to easily discover inconsistencies or well-formedness errors (e.g. split not matching a corresponding join). However, users can impose themselves restrictions in the usage of the BPMN language, thus deliberately lowering the level of the language’s complexity. The introduction of restrictive modeling conventions, i.e., modeling best-practices, makes the constructs easier to apply and the resulting models easier to communicate.
3.3
BPMN Metamodel
The BPMN 2.0 standard, was a step forward in the alignment of the originally Business Process Management Initiative3 (BPMI) process modeling notation with OMG’s initiative of Model-Driven Architecture (MDA) [OMG03b].
The BPMN language definition is
based upon a metamodel built with the UML [OMG07a, OMG07b], the standard de facto for software engineering modeling. The specification defines different types of conformance that BPMN tool implementers can adhere to, namely regarding: • process modeling – elements that are part of the orchestration in a single process, as well as elements that participate in the collaboration among processes. A collaboration is the synchronized interaction of two or more processes without a central control. Processes communicate by exchanging messages. Collaboration diagrams are used for documenting the co-operation among several organizations [All10]. • BPMN process execution – the interpretation of the Activity life-cycle; • BPEL process execution – mapping of a BPMN model to WS-BPEL; and • choreography modeling – a set of elements that puts modeling emphasis in the interaction among participants. This includes choreography and conversation diagrams. The metamodel also has got additional language constructs that cannot be represented in diagrams. Such constructs are required, for example, by process engines to capture the necessary additional information for process execution. BPMN 2.0 defines also an extensibility mechanism for both process model extensions and graphical extensions, refines event composition and correlation, and extends the definition of human interactions [SWB+ 12]. The BPMN standard specification [BPM11] can be referred, for the definition and meaning of each element, as well as for the rules about how they can be connected and for the connections meaning. However, it is a too complex technical document to be suitable 3
http://www.bpmi.org/ [accessed in Feb. 10, 2013]
54
3. A NALYSIS
OF THE
BPMN
3.3. BPMN Metamodel
to normal business modelers. Besides, the standard does not provide guidance on how the modeling notation should be used to attain a comprehensible and expressive BPMN model. Moreover, a great deal of definitions and rules are only informally presented in plain English. A metamodel (M2 level according to the MDA paradigm) describes the abstract syntax of a language by means of meta-classes, meta-associations and cardinality constraints. The BPMN metamodel includes elements from three diagrams, targeting the following different purposes: 1. for modeling processes’ orchestration and collaboration diagrams; 2. to simplify the perspective of collaboration diagrams through conversation diagrams; 3. for modeling participant’s interactions through the choreography perspective. In this dissertation, from the full metamodel that includes 151 meta-classes and 200 meta-associations, we only consider the subset of elements concerning the orchestration and collaboration diagrams (depicted in Figure 3.4 and explained in more detail in section 3.3.1). This is, by far, the most well-known and used by practitioners subset of BPMN, since it was already present in version 1. In the next section we will introduce the main concepts and connections of the orchestration perspective, as described in OMG’s BPMN metamodel. A symbol relates the elements of BPMN concrete syntax depicted in Figure 3.2, with the correspondent metaclass in the abstract syntax representation (Figures 3.4 and Figure 3.5), mapping by this way, the M2 and M1 layers of the MDA for BPMN.
3.3.1
Detail of BPMN Metamodel
In this section we depict the diagrams with the meta-classes and meta-associations used in BPMN for process orchestration. For the sake of understandability of the diagrams we labeled the meta-classes with a symbol. This allows to map the meta-classes conveying the abstract syntax, with the correspondent graphical element in the concrete syntax depicted in Figure 3.2. The metaclass Process (Figure 3.5) describes a sequence of instances of Activity carried out in an organization with some specific objectives. If a process interacts with other processes, it must participate in a Collaboration. The collaboration is a way of grouping several participants. Each Participant (aka Pool) must address only one process. Given the fact that a Participant is also an InteractionNode, it can send or receive several instances of MessageFlow. Figure 3.6 depicts the most instantiated meta-classes when is drawn a BPMN class diagram. A FlowElementsContainer (which can be either a Process or a SubProcess) is a container of instances of FlowElement. A flow element can be either a FlowNode, a SequenceFlow or a DataObject. Instances of SequenceFlow can link various kinds of FlowNode elements. A FlowNode can be one of the several different kinds of Activity, Event or Gateway (see Figure 3.7). 55
3. A NALYSIS
OF THE
BPMN
3.3. BPMN Metamodel
Figure 3.4: BPMN abstract syntax – a subset of the BPMN metamodel
Figure 3.5: Process metaclass’ connections
56
3. A NALYSIS
OF THE
BPMN
3.3. BPMN Metamodel
Figure 3.6: Main meta-classes in a process orchestration The ItemAwareElement is an abstract meta-class, from which derives several data related meta-classes representing transient (DataObject) or persistent (DataStore) data containers, as well as input or output data to/from Activity by means of meta-classes derived from DataAssociation.
Figure 3.7: Derived meta-classes from FlowNode
3.3.2
Flaws in the Metamodel
The analysis of the BPMN metamodel, revealed a couple of flaws in the standard specification that are described below. • The specification document allows the usage, by process modelers, of a visual shortcut that consists of the non-directional DataAssociation connected to a SequenceFlow ( [BPM11] page 225) (see Figure 3.8 top). However, the metamodel only allows links among instances of the meta-classes DataAssociation and Activity (see Figure 3.6). So, an instance of SequenceFlow cannot be directly linked to an instance of DataObject via an instance of DataAssociation. 57
3. A NALYSIS
OF THE
BPMN
3.3. BPMN Metamodel
Tools that implement this visual shortcut, should instantiate the same meta-classes as if there was not the visual shortcut, i.e., implementing the regular solution that consists of drawing an instance of DataOutputAssociation going out from an instance of Activity to an instance of DataObject. Conversely, an instance of DataInputAssociation coming from the same preceding instance of DataObject goes to other instance of Activity (see Figure 3.8 bottom). Furthermore, by permitting this kind of shortcut, the BPMN standard allows the occurrence of ambiguous and misleading situations such as the one depicted on the top of Figure 3.8, where DataObject1 is supposed to supply data to only one of the instances of Task that follow Gateway1, as correctly depicted on Figure 3.8 bottom; • The BPMN metamodel does not allow an instance of SubProcess to receive or send instances of MessageFlow. This constraint introduces a huge limitation in the modularization of BPMN processes’ through sub-processes, especially when there are interactions among participants. Process modelers tend to ignore this constraint [Sil09], hence violating the metamodel as in Figure 3.9 where there are two instances of MessageFlow connecting an instance of SubProcess to an external participant. For solving this issue in the BPMN metamodel, it would be enough that the is-a relationship between the metaclasses Task and InteractionNode (Figure 3.5), be replaced by a is-a relationship between the metaclasses Activity and InteractionNode. However, the implementation of this rule at metamodel level, must be followed by another one implemented by tool makers in order to ensure consistency among modeling elements at different levels of detail. Therefore, it must be ensured that the instances of MessageFlow participating in interactions with the sub-process’s instance (Figure 3.9 top) level are the same that the one depicted interacting when the sub-process is detailed (see Figure 3.9 bottom).
Figure 3.8: A non-directional DataAssociation connected to a SequenceFlow 58
3. A NALYSIS
OF THE
BPMN
3.3. BPMN Metamodel
Figure 3.9: An instance of SubProcess receiving/sending instances of MessageFlow
3.3.3
Concepts not Covered & Proposed Extensions to BPMN
BPMN intends to model processes. However, BPMN constructs emphasize mainly the support of the control-flow and data perspective when expressing process orchestrations. As other process modeling languages, BPMN constructs have a shallow coverage of resource or organizational aspects of process modeling. Moreover, BPMN focuses entirely on the behavioral aspect of the process model [Hol09] which is not considered wide enough for defining and monitoring business objective and policy goal related to business processes. The BPMN execution semantics for process models intends to allow the definition of executable processes, in order to give no room of interpretation on how to execute it by a process engine. An annex to the BPMN 2.0 specification has rules for transforming BPMN models into an executable BPEL format. However, since the internal structure of BPEL is rather different from that of BPMN, such a transformation is still not easy and there are also many problems in practice [Gao06, WDGW08]. Nevertheless, it is already possible, through BPMN tools (e.g. Bizagi), to directly execute detailed BPMN models for the purpose of simulation and monitoring [CT12]. Several initiatives have been triggered aiming to supplement known limitations of BPMN and enhancing its capabilities. Some interesting proposals are: (1) Time-BPMN [GT09], an extension to BPMN that deals with the temporal perspective of processes; (2) BPMN-Q [Awa07] a language for querying the structure of processes, allowing to perform searches in processes, collecting information, finding specific elements, as well as analyzing the behavior of a process; (3) xBPMN [Gro07], a revised formal control flow semantics specified and validated against the requirements. 59
3. A NALYSIS
3.4
OF THE
BPMN
3.4. Weaknesses of the BPMN standard
Weaknesses of the BPMN standard
Aware of the BPMN standard’s limitations revealed in the assessment on the section 2.5.3, we wanted to confirm whether those limitations, were relevant enough to affect the quality of process models produced using actual BPMN tools. This was done by checking whether current BPMN tools implementing the BPMN standard could rigorously verify process models, and ultimately produce good quality artifacts. If the lack of precise semantics of BPMN [BPM11] is in fact a major issue, this would naturally be reflected in the outcomes of BPMN tools. The produced process models would reveal quality shortage, due to failures in BPMN tools interpreting and implementing BPMN well-formedness4 rules. Therefore the rules checking made by BPMN tools would be unable of completely verify regular BPMN models. In order to evaluate the extent in which currently available BPMN modeling tools are supporting the generation of good quality process models, a survey was carried out. With this survey we intended to assess whether semantic rules regarding BPMN process modeling, mostly specified in natural language in the standard documentation [BPM11], were effectively addressed and implemented by tool makers. We tested the BPMN tools (represented by a sample of 11 current tools) to ensure an effective verification of BPMN semantic rules (represented by a sample of 10 basic rules, either informally described in the BPMN standard documentation or by practitioners as best-practices). The chosen rules are part of common process model diagrams, and must be used even by BPMN’s novices. So, it was naturally expected that all violations to the rules could be captured by the sample of BPMN tools. The set of chosen rules is summarized in section 3.4.1 and detailed in Appendix B. For testing the sample of BPMN tools, a model-snippet, depicted in Figure 3.10, was built containing violations to the mentioned rules. The results regarding the effectiveness of the sample of current BPMN tools for verifying process models correctness are presented in Table 3.1.
3.4.1
A Set of Rules for Assessing BPMN Tools
Among the 102 well-formedness rules we collected on more than five hundred pages of the BPMN standard document [BPM11], we chose a sample of 7 (7%) of them (see rules 1-7 below) of the most used by every BPMN modeler in regular BPMN process modeling. We chose also a sample of 3 (10%) best-practices rules (see rules 8-10 below) advocated by BPMN practitioners and experienced users [WM08, Sil09] from a total of 31. So, the number of the sample rules to be verified was a sample of 10 (8%) semantic rules, from a total of 133. 4
The term well-formedness is used here in the sense of static semantics [Aab96]. The static semantics defines restrictions on the structure of valid texts that are hard or impossible to express in standard syntactic formalisms, i.e., exclusively through the elements and relationships of the metamodel. For compiled languages, static semantics essentially includes those semantic rules that can be checked at compile time.
60
3. A NALYSIS
OF THE
BPMN
3.4. Weaknesses of the BPMN standard
1. A top-level Process can only be instantiated by a restricted set of Start Event types (see Figure B.1). Any container (Process or SubProcess) that does not have a parent container is considered a top-level Process [BPM11, page 238] . Top-level processes can have one of seven types of start events (see Figure 3.3, first column): none, message, timer, conditional, signal, multiple, and parallel [BPM11, page 112] . 2. Outgoing Sequence Flow not allowed in an End Event (see Figure B.2). An end event indicates where a process will end. In terms of sequence flows, the end event ends the flow of the process, and thus, must not have any outgoing sequence flow [BPM11, page 249]. 3. Outgoing Message Flow not allowed in a Catch Event (see Figure B.3). A start event or a catching intermediate event cannot have outgoing message flows [BPM11, page 251]. 4. A Catch Event with incoming Message Flow must have Message or Multiple type (see Figure B.4). A start event or a catching intermediate event with an incoming message flow must be of type Message or Multiple [BPM11, pages 44 and 271]. 5. Explicit Start Event or End Event do not allow Activity or Gateway without incoming/outgoing Sequence Flow (see Figure B.5). Start Event and End Event are optional [BPM11, page 238]. However, if there is at least one explicit start or end event in a container (Process or SubProcess), there must not be other flow nodes such as Activity and Gateway, without incoming/outgoing sequence flow [BPM11, pages 153, 289 and 430]. There are some exceptions: Compensation Activity and Event SubProcess do not have incoming and outgoing Sequence Flow. 6. A conditional Sequence Flow cannot be used if there is only one Sequence Flow out of the element (see Figure B.6). If a conditional Sequence Flow is used from a source Activity, then there must be at least one other outgoing Sequence Flow from that Activity. [BPM11, page 97]. 7. A Boundary Event must have exactly one outgoing Sequence Flow, unless it has the Compensation type (see Figure B.7). A Boundary Event is attached to an Activity and an outgoing exception flow comes out from it, through a Sequence Flow. Exactly one Sequence Flow is allowed from a Boundary Event except in the case that it is of type Compensation. In this particular case an Association can replace or not the Sequence Flow [BPM11, pages 259, 440 and 441]. 61
3. A NALYSIS
OF THE
BPMN
3.4. Weaknesses of the BPMN standard
8. Use a Timer intermediate event with an Event Gateway (see Figure B.8). One way for a modeler to ensure that a Process does not get stuck at an Event Based Gateway is to use a Catch Event of type Timer as one of the options to be reached through a Sequence Flow leaving the gateway [WM08]. 9. Use a Default Condition at an Exclusive Gateway (see Figure B.9). One way for the modeler to ensure that the Process does not get stuck at an Exclusive Gateway is to use a default condition for one of the outgoing Sequence Flow. This creates a Default Sequence Flow. The latter is chosen if all the other Sequence Flow conditions turn out to be false [WM08]. 10. Two activities in the same Process should not have the same name (see Figure B.10). It is highly recommended that an activity name is unique. If it is required an activity to be reused in the process, a Global Activity should be used instead of duplicating the activity [Sil09]. For a visual perception and understanding of possible violations to the above rules, see Appendix B.
3.4.2
A Model-snippet for BPMN Tools’ Evaluation
Based upon the rules previously described (section 3.4.1), the business process model in Figure 3.10 was drew up inserting a violation of each one of the rules. A numbered label was put near the element(s) where the violation occurs. The next step was to replicate the faulty business process model through the sample of chosen eleven BPMN tools (see Appendix C), and collect data regarding caught violations by each tool as summarized in next section (Table 3.1).
3.4.3
Results of Tools’ Assessment
Process modelers interest has been shifting from merely design tools to real process modeling tools with verification capabilities, as well as repositories for models storage [HW11]. Since, in this dissertation, we were concerned mainly with the quality aspects of process modeling, we wanted to ascertain the effectiveness of current BPMN tools to ensure the quality of the generated models. The set of tools from which the sample was chosen for assessment, came from several origins, although mainly from the OMG site5 . From an initial list of 68 tools, a set of 11 units (16%) was chosen. In the selection process, we considered only process modeling tools. So we discarded graphic design tools, as well as 5
http://www.bpmn.org/ [accessed in Feb. 10, 2013]
62
3. A NALYSIS
OF THE
BPMN
3.4. Weaknesses of the BPMN standard
Figure 3.10: Model-snippet for assessment of the effectiveness of BPMN tools verification those with a main focus in processes’ execution at runtime (BPMS). We selected a convenience sample of BPMN tools, in order to have a mix of proprietary and open source tools, acknowledged by the market according the criteria of popularity and maturity. Table 3.1: Rules’ violations detected on a model-snippet, by a sample of BPMN modeling tools Rule Id. 1 2 3 4 5 6 7 8 9 10 Std. Std. BP BP Total BPMN Tool # % # % % Adonis CE Aris Bizagi eClarus EA iGrafx MagicDraw Modelio Signavio TIBCO Visio+Modeler
x
x
x
x x
x
x
x
x
x
x x x x
x x x x x
x
x
x x x x
x x x
x x x
x x x
x
x
x
5 1 2 1 4 1 4 5 5 5
71% 14% 29% 14% 0% 57% 14% 57% 71% 71% 71%
1
1 2
33% 0% 0% 0% 0% 0% 0% 33% 0% 66% 0%
60% 10% 20% 10% 0% 40% 10% 50% 50% 70% 50%
Through the analysis of Table 3.1 and for the simple model-snippet checked, one can conclude that none of the tools from the sample, fully detected the rules violations. The best score was attained by a unique tool that detected 70% (column Total %) of the violations inserted in the model-snippet. Regarding the rules prescribed by the BPMN standard the best score was given by tools that have detected 5 violations (71%) of the 63
3. A NALYSIS
OF THE
BPMN
3.5. Conclusion
standard’s rule violations. Concerning the violation of best-practices rules, the best score was given by a tool that detected 2 violations (66%) of the total of best-practices rules in the model-snippet. The achieved results seems to corroborate the idea that the limitations in the BPMN standard, i.e. rules informally specified in natural language, contribute for poor quality of process models, given the weakness of BPMN tools in terms of models’ verification.
3.5
Conclusion
We addressed the main characteristics of BPMN in section 3.2. The BPMN metamodel was detailed (section 3.3.1) providing information regarding the main constructs used for business process orchestration. We also highlighted flaws found in the BPMN metamodel (section 3.3.2), as well as proposed extensions to supplement BPMN (section 3.3.3). A previous analysis of the BPMN (section 2.5.3) revealed some weaknesses amenable of harming the quality of produced process models. This evidence was corroborated through a survey on BPMN tools (section 3.4) that confirmed limitations on using the BPMN to produce good quality models, due to the informal specification of rules in the BPMN standard. The relevance of the survey is given by the fact that the rules chosen to be checked by the convenience sample of BPMN tools were some of the most basic ones that a novice BPMN modeler would use.
64
4 State-of-the-Art on Quality in Process Modeling
"Do not go where the path may lead, go instead where there is no path and leave a trail." – Ralph Waldo Emerson
Contents 4.1
Introduction . . . . . . . . . . . . . . . . . . . . . . . . . . . . . . . . . . .
66
4.2
Quality on Process Modeling . . . . . . . . . . . . . . . . . . . . . . . . .
67
4.3
Verification of BPMN Models . . . . . . . . . . . . . . . . . . . . . . . .
69
4.4
Measurement of BPMN Models . . . . . . . . . . . . . . . . . . . . . . .
78
4.5
Conclusion . . . . . . . . . . . . . . . . . . . . . . . . . . . . . . . . . . .
79
Context: Quality of process modeling can be addressed, when following a productoriented approach, by assessing the quality of outcomes of process modeling activity, i.e., evaluating the internal and external qualities of process models. Objective: To survey existing approaches on assessing the quality of BPMN models, through the verification of correctness and measurement of quality characteristics. Method: A systematic review and a literature review were the main instruments used to collect information and assess it using predefined dimensions. Results: A set of limitations of current research work were identified regarding BPMN models’ quality verification and measurement. Those issues were the base for formulating the contributions of this dissertation. Limitations: Efforts were made to cover previous relevant research work related with the domain of the present dissertation, by using namely a systematic review protocol. 65
4. S TATE - OF - THE -A RT
ON
Q UALITY
IN
P ROCESS M ODELING
4.1. Introduction
Shallow coverage of some topics is supplemented by literature references. Conclusion: This chapter paved the way for the main contributions of the dissertation, by highlighting the main limitations of current approaches in addressing quality aspects related with BPMN models.
4.1
Introduction
To support our own contributions, we will now survey previous research made regarding the quality of BPMN process models. As referred in section 2.4, we follow a productoriented approach [MCN92] regarding the analysis of quality on BPMN models. Therefore, we focused on two quality perspectives: (1) the verification of BPMN models correctness; and (2) the measurement of quality characteristics of BPMN models. Regarding the first perspective, quality verification, we were concerned in surveying the methods and tools used for formal verification of process models in general and BPMN models in particular. The aim was to review the specific approach used by those methods to check the quality characteristic of BPMN process models’ correctness. In order to address the second perspective, the measurement of quality characteristics, it was taken into account that, as mentioned in section 2.4.2, quality is a multi-dimensional concept, i.e., the quality model of a product or service should address different levels of quality characteristics. So, regarding process models, the quality model should document the inter-relationships between quality characteristics and their measures1 , as well as the links between internal and external quality attributes of process models. Therefore, the results of directly measuring process models attributes (e.g. size, complexity) should be linked to the perceived quality of those models, such as correctness. For addressing this quality perspective, the literature was surveyed in search of existent approaches dealing with measurement of quality characteristics of process models in general and BPMN in particular. The structure of this chapter is the following: we surveyed in section 4.2 the general approaches to quality in process modeling from the verification (section 4.2.1) and measurement (section 4.2.2) perspectives. The approaches regarding quality of BPMN models were specifically addressed in sections 4.3 and 4.4. It was carried out a systematic review (section 4.3) to find and select studies concerning BPMN models’ quality. Those studies were classified according to a proposed taxonomy (section 4.3.2). Were also surveyed formal verification methods for checking BPMN process models’ properties and semantics (section 4.3.3), as well as approaches for measurement of BPMN models quality characteristics (section 4.4). Section 4.5 presents the main conclusions extracted from the state-of-the-art study. 1 As said before the term measure is used instead of the term metric because more recent standards (e.g. ISO/IEC 25000 and ISO/IEC 15939 series) disregarded the use of the term metric.
66
4. S TATE - OF - THE -A RT
4.2
ON
Q UALITY
IN
P ROCESS M ODELING
4.2. Quality on Process Modeling
Quality on Process Modeling
There is no general standard established for evaluating conceptual modeling [Moo05], and particularly the quality of process modeling and its outcome: process models (set of diagrams). However, due to the several process modeling languages available, there are some dispersed research works about modeling guidelines [BRvU00, MRC07, VRM+ 08, MRvdA10] as well as the measurement of process diagrams characteristics [CMNR06, Car07, VCM+ 07]. Practitioners have also given some contributions, namely by promoting process diagrams’ modeling best-practices [WM08, Sil09, All10]. Meanwhile, a range of quality frameworks for conceptual modeling have been proposed in the literature, although none of them has reached a wide acceptance, thus becoming a de facto standard. For instance, the SEQUAL framework [LSS94] provides a sound theoretical basis for understanding quality in the conceptual modeling. SEQUAL takes the semiotic theory [Mor71] point of view, and has five components: the model, language, domain, audience participation, and perceived knowledge. Model quality is defined by relationships between the model and the other four framework’s components in terms of the following models’ qualities: syntactic (model conformance to the language), semantic (model conformance to the domain) and pragmatic (model conformance to the audience interpretation) [Rec07]. The quality framework was empirically validated regarding process modeling [MSBS03]. The collected results raised questions about reliability of the framework to be applied in practice in its current form. Based upon the initial approach was proposed an enhancement regarding process modeling [KSJ06]. Although the framework addresses quality in a systematic and comprehensive way, the drawback pointed out is too abstract to be used by practitioners [SD97].
4.2.1
Quality Verification
Model checking concerning process diagrams correctness has been a matter of intense research. Some of the work has been done on the verification using modeling languages with formal semantics (e.g. P/N). Due to the mathematical ground of those languages, they allow several formal verification methods, such as the verification of different classes of workflow definitions [vDA00]. However, for process modeling languages, which do not have a formal semantics and allow only processes’ informal representation, was required a different approach to verification. Since process diagrams have to be translated into a specification to be executed by a machine, a general consensus was that process diagrams had also to be formalized. Therefore, approaches for checking process diagrams for semantic errors came to light, aiming process diagrams mapping to languages with formal semantics, such as the checking of EPC diagrams, using transformations to P/N, proposed in [LSW98, vdA99, DVDA04, vDvdAV05, Men07]. A modeling tool is provided by [KKGL10] and it applies graph-based rules for identifying problems in EPC process diagrams. 67
4. S TATE - OF - THE -A RT
ON
Q UALITY
IN
P ROCESS M ODELING
4.2. Quality on Process Modeling
The main characteristics of these approaches, excepting [KKGL10], is that the verification methods rules are only applicable after process diagrams are at a valid state, i.e. in a syntactically valid state, to be mapped from the specific process modeling language into the language and environment of the model checker.
4.2.2
Quality Measurement
There is no universally accepted measure for process diagrams quality but rather should be considered a combination of measures [CMNR06]. This assumption has already been reached by the software engineering community [NBZ06] regarding software product qualities [ISO11]. Therefore, efforts have been made in the process modeling field by proposing measures, as well as making empirical studies to call upon a set of measures that could measure and evaluate process diagrams characteristics, to provide information to improve their quality attributes (section 6.2). However, it has been recognized that the research about process modeling, and particularly process diagrams quality attributes, is yet scarce [VCM+ 07]. Some of the most commons measures found for process diagrams were adopted from the software engineering area, given the closest resemblance between processes and computer programs namely in terms of the usage of algebraic techniques such as graph theory for analysis and representation [LK01]. In some sense, a process can be seen as a coarse grained view of a program, which is underpinned by specific constructs of process modeling (e.g. control-flow/selection, task/procedure) [CMNR06, GL07]. Recent surveys (e.g. [MGSA10]) summarized the most well-known proposals for process diagrams measures. These include the works of [LK01] (e.g. coefficient of network complexity, complexity index, and restrictiveness estimator), [CMNR06] (number of activities, control-flow complexity, Halstead-based process complexity, and interface complexity), [MNvdA07] (size, separability, sequentiality, structuredness, cyclicity, and parallelism), [GL06] (number of activities, maximum/mean nesting depth, cognitive weights, information flow, knot-count, and anti-pattern counting) and [LvdA09] (extended Cardoso metric, extended cyclomatic metric, and structuredness metric). Some work has also been made in recent years, collecting empirical evidence that could support hypotheses regarding process diagrams measures. Particular interest has the work of Mendling, who focused in the EPCs process modeling language [MNvdA07]. His aim was to establish a correlation among errors found in process diagrams and a set of proposed measures that disclose structural and behavioral characteristics of process diagrams. Predictors were built to forecast errors in process diagrams based on measures’ values. The results were supported by samples collected from process diagrams repositories. We consider as main characteristics of the aforementioned research done so far about process modeling measurement: 1. There is no standard definition of process modeling measures, resulting in different 68
4. S TATE - OF - THE -A RT
ON
Q UALITY
IN
P ROCESS M ODELING
4.3. Verification of BPMN Models
algorithms for their computation; 2. Some of the measures are defined in abstract terms, so the translation to a particular process modeling language syntax can be done differently by distinct implementors; 3. Measures are mostly used to support a posteriori analysis, i.e. historical analysis of process diagrams, rather than an analysis that could give real-time feedback, over the process diagram design phase. Hence, the measures are post-modeling measures instead of providing guidelines and preventing quality non-conformance during the modeling process; 4. There are no thresholds measures generally accepted, that could guide modelers along process diagrams design, helping them to attain desirable levels of process diagrams characteristics (e.g. complexity, modularity, size); 5. Distinct languages are used for process modeling and measures collection.
4.3
Verification of BPMN Models
In this and next section we will concentrate in the related work on quality of process modeling in BPMN, which is the context of this dissertation. In this section we will conduct a systematic review [Kit04] on BPMN process models verification. This systematic review aims to collect information regarding the approaches used for verification of BPMN models.
4.3.1
Systematic Review
The systematic literature review, as a scientific methodology, has been used on several scientific domains (e.g. Software Engineering [BMNT05]) for integrating empirical research. By using the systematic review we want to identify, evaluate and interpret the relevant research upon BPMN models verification. We started the systematic review by adopting a predefined review protocol to avoid the possibility of bias (selection of individual studies not driven by our own expectations). Therefore, we followed the methods specified in the protocol, including the identification of the research question, the selection of studies, the quality assessment study, data extraction and monitoring, together with data synthesis. The protocol underpinning our systematic review, is organized according to the following activities: 1. Define a research question – Since this is qualitative research design we use inductive reasoning to propose the research statement (see section 4.3.2.1). 2. Locate and select relevant research studies – Without yet attempting an evaluation, we tried to find papers and reports in journals and papers with peer review. In section 4.3.2.2 is detailed the research forums where was made the search, as well as the used search criteria. 69
4. S TATE - OF - THE -A RT
ON
Q UALITY
IN
P ROCESS M ODELING
4.3. Verification of BPMN Models
3. Critically evaluate the studies– We assessed each research work against a set of criteria regarding quality of BPMN process models (see section 4.3.2.4). 4. Combine the results –The findings were compiled and aggregate in Table 4.1 for comparison purposes. 5. Publish the results – Besides being published in this section of the dissertation, the results are intended to be published, in a near future, in a research paper for peer validation purposes.
4.3.2 4.3.2.1
Protocol Instantiation Research Question
The goal of the systematic review is to identify studies that provide an approach for the well-formedness (semantic) rules verification of BPMN process models. This drives to the research question of the current systematic review: How BPMN process models are verified, regarding their quality? 4.3.2.2
Studies Selection
This step was intended to specify the search strategy aiming to detect as much as possible relevant literature on BPMN models’ verification. We were concerned in documenting the whole search strategy so that other researchers can replicate the same review with identical results. To comply with the protocol, we had to search for documents using a predefined query string. We were interested in research works regarding exclusively to BPMN. Because the year of BPMN’s first version was 2004 [BPM04], we have restricted the search period from 2004 until the present moment. We also have chosen a set of terms related with the compliance with the well-formedness of process models. The query string set up for querying the repositories was adapted to the specific syntax of each search engine, based on the following terms and boolean operators: BPMN AND (verification OR checking OR formal OR semantic OR errors OR properties) After the definition of the query string, the next step was to submit the query to different sources of information. Those sources were: Google Scholar2 , Microsoft Academic Research3 , ACM Digital Library4 , IEEE Xplore5 , and Science Direct Digital Library6 . 2
http://scholar.google.pt/ http://academic.research.microsoft.com/ 4 http://dl.acm.org/ 5 http://ieeexplore.ieee.org/Xplore/home.jsp 6 http://www.sciencedirect.com/ 3
70
4. S TATE - OF - THE -A RT
ON
Q UALITY
IN
P ROCESS M ODELING
4.3. Verification of BPMN Models
From each source we collected the 100 first items returned by the engine, ordered by its own relevance criteria. The 500 entries from all engines were stored in a database built for this purpose using EndNote7 . Next, the database was queried to find duplicate records (articles found in more than one source). The result of this search was elected as the first set of articles. The set was composed of 55 studies found in more than one source. Our assumption for the first cut-off of research works to be reviewed was defined as follows: if a paper was referenced by more than one search engine, it meant that it was more relevant than the others referenced by only one search engine. After selecting the first set of studies, we performed a new selection by assessing the studies’ content. The idea was tuning the set of initial research works by applying a second selection criteria: containing information about any kind of approach concerning the verification of process models, i.e., the article should refer the detection of non conformances due to semantic errors or properties’ faults (e.g. deadlock). This second selection was done by the reading of the paper and the search, for the verification approach, in the abstract, introduction and conclusions of the paper. As a result of applying a more narrow criteria in the second selection, the final set was composed only by 13 articles (Table 4.1). 4.3.2.3
Synopsis of Selected Research Works
To discover the proposal made in each of the research works, we analyzed how was carried out the verification of BPMN models. We summarize below each of the approaches mentioned in Table 4.1: 1. The article "A pattern-based approach for the verification of business process descriptions" [PS13] presents an approach for verifying business process descriptions presented in any style (e.g. as text, tables or graphical artifacts), created with process modeling languages such as BPMN. Because of its generality and the availability of tools, model checking is used to verify business process descriptions, particularly the SPIN model checker. The proposed composition-based approach permits the semi-automatic implementation of business process description in the SPIN tool and the verification of numerous correctness properties, which refer to workflow control flow patterns, safety and liveness. For the basic patterns and fragments, PROMELA in-line constructs are provided, and is suggested the set of applicable correctness properties. The correctness properties are specified as templates in linear temporal logic. Implementing a business process description consists of assembling the in-line constructs and associating business semantics with the symbols in the logical formulas of the correctness properties. For verification are used the SPIN algorithms. By using the presented approach, business process descriptions can be checked for correctness. 7
http://endnote.com/
71
4. S TATE - OF - THE -A RT
ON
Q UALITY
IN
P ROCESS M ODELING
Table 4.1: Research Works Selected Authors
#
Title
1
A pattern-based approach for the verification of business process descriptions [PS13] A visual token-based formalization of BPMN 2.0 based on in-place transformations [GD13] Adding Preciseness to BPMN Models [CBeA12] An eclipse plug-in for formal verification of BPMN processes [FABD10] Analysis on demand: Instantaneous soundness checking of industrial business process models [FFK+ 11] Developer-friendly verification of processbased systems [PFS10] Direct verification of BPMN processes through an optimized unfolding technique [FPPR12] Formal analysis of BPMN models using EventB [BW10] Formalisations and Applications of BPMN [WG11a] On the refactoring of activity labels in business process models [LSM12] Property specifications for workflow modelling [WG11b] Semantics and analysis of business process models in BPMN [DDO08] Visually specifying compliance rules and explaining their violations for business processes [AWW11]
2 3 4 5
6 7 8 9 10 11 12 13
4.3. Verification of BPMN Models
S. Patig, M. Stolz P. Gorp, R. Dijkman A. Correia, F. Abreu C. Flavio, et al. D. Fahland, et al.
E. Pulvermueller, et al. D. Falcioni, et al. J. Bryans, W. Wei J. Gibbons, P. Wong H. Leopold, et al. P. Wong, J. Gibbons R. Dijkman, et al. A. Awad, et al.
2. The paper "A visual token-based formalization of BPMN 2.0 based on in-place transformations" [GD13] provides a BPMN semantics formalization that consists of in-place graph transformation rules that are documented visually using BPMN syntax. In-place transformations update models directly and do not require mappings to other languages. A tool and test-suite was used to develop a reference implementation of all rules. The formalization intends to complement the standard, in particular because the rules have been extensively verified and because is facilitated the conceptual validation (the informal semantics also describes in-place updates). 3. In our article "Adding Preciseness to BPMN Models" [CBeA12], OCL invariants [OMG06] were formalized and added to OMG’s BPMN metamodel specification. Those invariants were related to well-formedness rules informally described in BPMN specification, as well as rules regarding models’ properties. In this paper it 72
4. S TATE - OF - THE -A RT
ON
Q UALITY
IN
P ROCESS M ODELING
4.3. Verification of BPMN Models
was briefly described how the approach was operationalized, namely by developing several transformations to allow checking rules conformance of process models produced with a BPMN modeling tool. A metamodel-based checking facility was also developed as a JUnit test-suite. Each test case checked the validity of a model snippet implementing a specific BPMN rule. Using the same metamodel-based approach, it was also formalized a set of best practices for BPMN modelers, based on published recommendations produced by BPMN practitioners. 4. The article "An eclipse plug-in for formal verification of BPMN processes" [FABD10] proposes a novel approach enriching the design with a formal semantic and a systematic integration of formal verification. The approach has been implemented as a tool that allows verifying business processes. The tool (BP4PA)is an Eclise plug-in that uses BPMN notation for business process specification, implements a mapping from the BPMN to the CSP formal language and supports CSP verification via model checking. 5. In "Analysis on demand: Instantaneous soundness checking of industrial business process models" [FFK+ 11] models are investigated for soundness (absence of deadlock and lack of synchronization) using three different approaches: the business process verification tool Woflan, the Petri net model checker LoLA, and a technique based on SESE decomposition. The various techniques used by these approaches are evaluated in terms of their ability of accelerating the check. Soundness is used for example as a precondition to map a process modeled in a graph-based language such as BPMN, into BPEL in a way that preserves the execution semantics and the structure of the process. 6. In the article "Developer-friendly verification of process based systems" [PFS10] a checking system is presented that integrates a graphical notation for a user-friendly specification and an extended specification language together with a corresponding verifier which supports the checking of many different types of elements. The integration is realized by an XML-based transformation system which links the graphical editor of a process modeling such as BPMN, P/N or EPC, to the checking tool. 7. The work "Direct verification of BPMN processes through an optimized unfolding technique" [FPPR12] is a Java based verification approach for BPMN. In particular, a precise Java mapping is defined for the main elements of the BPMN notation. The relations among the different elements of a BPMN specification are supported by the inclusion of specific attributes and methods in the created Java objects. The behavior of a set of BPMN interrelated objects can be explored using an algorithm defined for that purpose. Such an algorithm permits to avoid the state explosion phenomenon using an ad-hoc unfolding technique. It has been developed a plug-in for the Eclipse IDE platform. It permits to have an integrated environment in which is designed a business process, to verify it, and to check the result of the verification in order to improve the business process itself. This iterative approach can continue until all the issues highlighted by the verifier are solved. 73
4. S TATE - OF - THE -A RT
ON
Q UALITY
IN
P ROCESS M ODELING
4.3. Verification of BPMN Models
8. "Formal analysis of BPMN models using Event-B" [BW10] demonstrates how formal verification may add value to the specification, design and development of business process models in an industrial setting. The analysis of models is achieved via an algorithmic translation from the BPMN to Event-B, a formal language supported by the Rodin platform which offers a range of simulation and verification technologies. 9. The article "Formalisations and Applications of BPMN" [WG11a] provides a framework for precise specifications and formal verifications of workflow processes modeled as BPMN diagrams. Two behavioral semantics are provided for BPMN in the process algebra CSP. Existing CSP refinement orderings are applied to both the refinement of business process diagrams and the verification of behavioral compatibility of business process collaborations. The first semantic model is an untimed model, focused on the control flow and communication of business processes. The second semantic model extends the first one to capture the timing aspect of behavior. It is also considered the applications of the semantic models. The secondary objective of the approach was to apply BPMN and the semantic models to reason about long running empirical studies (e.g. laboratory experiments, clinical trials). 10. "On the refactoring of activity labels in business process models" [LSM12] address the problem of activity label quality in business process models. The technique was designed for the recognition of labeling styles, and the automatic refactoring of labels with quality issues. It was developed a parsing algorithm that is able to deal with the shortness of activity labels, which integrates natural language tools like WordNet and the Stanford Parser. Using three business process model collections, one of them in BPMN, from practice with differing labeling style distributions, it was demonstrated the technique’s applicability. The technique shifts the boundary of process model quality issues that can be checked automatically from syntactic to semantic aspects. 11. The paper "Property specifications for workflow modelling" [WG11b] considers a pattern-based approach to expressing behavioral properties, supplementing the difficulties of BPMN to construct behavioral properties against to which models may be verified. A property specification language is described (PL) for capturing a generalization Property Specification Patterns, and presented a translation from PL into a bounded, positive fragment of linear temporal logic, which can then be automatically translated into CSP for simple refinement checking. These results lead to a compositional approach for ensuring deadlock freedom of interacting business processes. This work follows a previous one of the authors, providing formal behavioral semantics for the BPMN in the process algebra CSP. 12. "Semantics and analysis of business process models in BPMN" article [DDO08] proposes a mapping from BPMN to a formal language (Petri nets) for which efficient analysis techniques are available. The proposed mapping has been implemented as a tool that, in conjunction with existing Petri net-based tools, enables the static 74
4. S TATE - OF - THE -A RT
ON
Q UALITY
IN
P ROCESS M ODELING
4.3. Verification of BPMN Models
analysis of BPMN models. 13. The article "Visually specifying compliance rules and explaining their violations for business processes" [AWW11] utilizes a visual language, BPMN-Q, to express compliance requirements visually in a way similar to that used by business experts when building process models. Still, using a pattern based approach, each BPMNQ graph has a formal temporal logic expression in Computational Tree Logic (CTL). Moreover, the user is able to express constraints, i.e., compliance rules, regarding control flow and data flow aspects. In order to provide valuable feedback to a user in case of violations, the approach depend on temporal logic querying approaches as well as BPMN-Q to visually highlight paths in a process model whose execution causes violations. 4.3.2.4
Analysis and Findings
After the set of selected research works that have been revised, this section presents the findings. The studies were classified according to a number of dimensions, that we deem relevant for being satisfied by a comprehensive approach, claiming to be able to check BPMN process models. Those dimensions are: • Well-formedness (Semantic) Checking – is concerned whether the approach encompasses the checking of well-formedness rules prescribed on the BPMN standard document [BPM11] (Appendix E); • Properties Verification – is related to the suitability of the approach for checking domain-independent properties (e.g. deadlock, liveness); • Measurement – whether the approach provides measures regarding to the internal and external attributes of the models, contributing for the improvement of process models’ quality; • Modeling Guidance – is related to the capability of the approach to provide direct guidance to the process modeler, in design time, even in the presence of incomplete process models; • Empirical Validation – is related to the effectiveness of the approach evidenced through statistically grounded empirical studies. A score was assigned to each study in each dimension, based on an ordinal scale depicted as a symbol: None/Basic – O ; Partial/Moderate – �; Full/Plenty – �. Table 4.2 provides the synthesis of the systematic review results.
75
4. S TATE - OF - THE -A RT
# 1 2 3 4 5 6 7 8 9 10 11 12 13
ON
Q UALITY
IN
P ROCESS M ODELING
4.3. Verification of BPMN Models
Table 4.2: Classification of the selected studies Well-formedness Properties MeasuResearch Work Checking Verification rement A pattern-based ... A visual token-b... Adding Precisene... An eclipse plug-... Analysis on dema... Developer-friend... Direct verificat... Formal analysis ... Formalisations a... On the refactori... Property specifi... Semantics and an... Visually specify...
O � � O O O O O O � O O O
� O � � � � � � � O � � �
O O O O O O O O O O O O O
Modeling Guidance
Empirical Validation
O O � O O O � O O O O O O
O � O � O O O O � O O O O
As can be seen in the previous table, most of the works address essentially the properties verification dimension. Our approach (the third in Table 4.2) published in [CBeA12] seems to be the one that encompasses more dimensions. In this dissertation we will delve into the "Semantic Checking" and "Modeling Guidance" dimensions (chapter 5). We will also tackle the "Measurement" dimension in chapter 6, as well as "Empirical Validation" dimension in chapters 8 and 9. By doing that we will be able to cover all the four dimensions in detail. The full coverage of the dimension "Properties Verification" is left for tools and techniques already existent, since they are ensuring already a good coverage of it.
4.3.3
BPMN Formal Verification Methods
In the previous systematic review we overviewed some of the relevant works surveyed regarding verification on BPMN process models. Next we summarize some of the most well-known formal verification methods that are used on checking of BPMN models, through the specific formalisms detailed in Appendix A (section A.2). • Communicating Sequential Processes (section A.2.1) – Wong and Gibbons [WG08, WG11a] use the CSP language and the behavioral semantics as the denotational model for augmenting the semantic model of BPMN, introducing relative timing information, and then allowing the specification of timing constraints on concurrent activities. The processes’ behavioral properties of BPMN diagrams are analyzed using the FDR model checker. • Petri Nets (section A.2.2) – Dijkman et al. [DDO07] provide a formal semantics for a subset of BPMN constructs in Petri nets. In particular, they provide a semantics that maps BPMN pools into Workflow nets. A Workflow net is a P/N such that there is 76
4. S TATE - OF - THE -A RT
ON
Q UALITY
IN
P ROCESS M ODELING
4.3. Verification of BPMN Models
a unique source place i (•i = ∅), a unique sink place o (o• = ∅), and every other place and transition is on a directed path from the unique source place to the unique sink place. The semantics only encompasses a subset of BPMN, and does not properly model multiple instances, exception handling and message flows. • Web Ontology Language (section A.2.3) – A common property of ontologies and the OWL semantics is the so-called open-world assumption [HPSVH03], a form of partial description or under-specification as a means of abstraction, i.e., from the absence of statements, a deductive reasoner must not infer that the statement is false. In [Nat11] it is defined an ontology that formally represents the BPMN specification (BPMN 2.0 Ontology), and can be used as a knowledge base. The description of an element is combined within the corresponding class and further explanations are provided in annotations. This is claimed to allow a much faster understanding of BPMN. In addition, the ontology is used as a syntax checker to validate concrete BPMN process models. • Abstract State Machines (section A.2.4) – The approach regarding BPMN semantics in [BS11], uses ASM [BT08], as a form of rigorous pseudo-code that follows the inheritance steps in the process modeling language class hierarchy. The abstract model of the dynamic semantics8 of the BPMN language is attained, by inserting rules as behavioral elements at appropriate places in the class hierarchy, defining therefore, the language’s execution semantics. The enhanced process modeling language model can be used to check the conformance of process diagrams.
4.3.4
Conclusions on Verification of BPMN Models
We highlight the following main limitations of above proposals regarding BPMN model verification: 1. Most of the verification methods rules are only applicable, after process diagrams are at valid state to be mapped from a specific process modeling language into the language and environment of the model checker. 2. The approaches presented, are technically demanding w.r.t. the formalisms, even for advanced process modelers, from whom one can hardly expected to be acquainted with the above mentioned formalisms. Moreover, it must be made available a blended environment integrating a process modeling language tool and a model checker tool. 3. The ontological approach proposed uses the open-world assumption [HPSVH03], a different assumption used by the MDA approach (see chapter 7), which advocates that what is not currently known to be true, is false, and therefore assumes that the 8 The dynamic semantics (aka execution semantics) of a language defines how and when the various constructs of a language should produce a program behavior.
77
4. S TATE - OF - THE -A RT
ON
Q UALITY
IN
P ROCESS M ODELING
4.4. Measurement of BPMN Models
model has complete information to restrict arbitrary extensions of the system that could lead to inconsistencies (closed-world assumption). The proposed approach to get over the mentioned limitations is to supplement the standard process modeling language with rules that could enhance BPMN models’ construction. Being an integral part of the BPMN metamodel, BPMN semantic rules implemented as OCL invariants, could be enforced by the same tools that already support the BPMN modeling language. Therefore, during the BPMN process model design, in addition to syntax error verification, which is available to a certain degree from current tools, the modelers would have also, real-time checking about semantic violations in models (e.g. a throw event without a corresponding catch event; a mismatch between flows from a split parallel gateway and the incomings on the corresponding joint element, a possible cause of a deadlock situation). Similarly, BPMN modeling best-practices of an organization, could also be established and enforced. This kind of rules (standard or from best-practices) could greatly enhance the quality of BPMN diagrams resulting from the design phase of process’s life cycle.
4.4
Measurement of BPMN Models
In this section we survey the literature in search for contributions on proposed measures for evaluate internal and external qualities of process diagrams using BPMN. Few research works have been published addressing the measurement of BPMN models’ quality characteristics. Rolón et al. performed an empirical study in which observations of a complexity measure were correlated with process diagrams qualities of understandability and modifiability [RCG+ 09]. In other approaches9 , BPMN elements’ simple counting measures were defined and implemented using OCL [RRG+ 09]; and several measures, proposed in the literature for process diagrams, were also implemented through OCL [BeAPFC10]. Both approaches were formalized using the MetaModel-Driven Measurement (M2DM) approach [BeA01]. The two last works mentioned have some resemblance with the approach proposed in this dissertation. However the mentioned proposals, do not theoretically validate (see chapter 6) the previously proposed measures. Moreover, the measures were computed without considering the syntactical and well-formedness verification of BPMN diagrams.
9 These approaches were based upon ad-hoc metamodels of BPMN v1 , since there were not an official metamodel version released.
78
4. S TATE - OF - THE -A RT
ON
Q UALITY
IN
P ROCESS M ODELING
4.5. Conclusion
To overcome the above mentioned limitations, we propose a set of BPMN measures, upon the current BPMN v2 standard. So, the idea is to extend the OMG’s BPMN metamodel with rigorously defined measures, in a declarative way using OCL. The measures as an integral part of the BPMN, will be implemented by tools supporting the BPMN modeling language. Therefore, modelers will have real-time measures about process diagrams characteristics. These measures could be compared with general or organizational thresholds, and will serve as guidance for attaining qualitatively better process diagrams. Furthermore, it will facilitate the data collection within the modeling process for statistical analysis and quality assurance.
4.5
Conclusion
This chapter intends to summarize the research work done in the domain in which the dissertation is expected to give some contributions, which are presented in chapters 5 and 6 and validated in chapters 8 and 9. The chapter addresses, following a product-oriented approach, the quality of process models in two perspectives: (1) concerned with the verification of process models’ correctness; and (2) with the measurement of quality characteristics of process models. Both perspectives of quality are taken for process models in general (section 4.2) and BPMN models in particular (sections 4.3 and 4.4). It was conducted a systematic review regarding BPMN process models verification. It was concluded that most of the research works surveyed addressed essentially the Properties Verification aspects, i.e., the papers were related with checking of domain-independent properties (e.g. deadlock, liveness). Other aspects considered relevant for this dissertation were insufficiently covered, namely the Well-formedness Checking and Modeling Guidance aspects (to be considered in this dissertation in chapter 5), as well as the Measurement dimension (to be covered in chapter 6), and Empirical Validation dimension (chapters 8 and 9). It was also done a literature review, to summarize some of the most well-known formal verification methods that have been used on checking BPMN models (CSP, P/N, OWL, ASM). The limitations, from our point of view, of the methods were highlighted and was made a proposal to overcome those limitations: supplementing the standard process modeling language with rules, implemented as OCL invariants, that could enhance BPMN models’ verification in design time. Lastly, it was made another literature review regarding the research work done about measurement of BPMN Models quality characteristics. The limitations pointed out to the surveyed work are: (1) not validating theoretically, the proposed measures; as well as (2) the computation of measures without considering the syntactical and well-formedness verification of BPMN diagrams. To overcome these limitations, it was proposed the elicitation of a set of BPMN measures, to be aligned with the current BPMN standard. 79
[This page is intentionally blank]
5 Verification of BPMN Models
"The man of science has learned to believe in justification, not by faith, but by verification" – Thomas Huxley
Contents 5.1
Introduction . . . . . . . . . . . . . . . . . . . . . . . . . . . . . . . . . . .
82
5.2
BPMN Rules Formalization . . . . . . . . . . . . . . . . . . . . . . . . . .
83
5.3
Conclusion . . . . . . . . . . . . . . . . . . . . . . . . . . . . . . . . . . .
91
Context: The BPMN specification has rules regarding the correct usage of the language’s constructs, which are informally defined yielding dubious interpretation. There are also rules that came from disseminated best-practices both from academics and practitioners. Not infrequently process modelers violate BPMN underlying grammatical rules, using constructs outside of their designated scope. Objective: To help BPMN process modelers to tackle the complexity of the BPMN language and produce well-formed models, we propose to formalize both the standard and best-practices rules. Method: The rules formalization is implemented with the OCL invariants upon the BPMN metamodel. Results: A set of verification rules enforcing the compliance of BPMN models with both the BPMN specification and BPMN modeling best-practices. Limitations: Since properties verification (e.g. deadlock, liveness) is a topic already covered by several other approaches, it is not targeted in the present work. 81
5. V ERIFICATION
OF
BPMN M ODELS
5.1. Introduction
Conclusion: The extended BPMN metamodel has embedded the well-formedness rules, besides the abstract syntax of the process modeling language, which allows the verification of BPMN models correctness.
5.1
Introduction
The popularity of BPMN stems primarily from the rich expressiveness of its graphical representation. Activities in a process and their execution constraints expressed graphically eases the communication about processes among the different involved stakeholders. However, there are other aspects important for a process modeling language, not available in BPMN metamodel: the rigorous definition of rules that BPMN models must conform with. The BPMN metamodel [BPM11] gives an abstract syntax for the constructs of BPMN (section 3.3). This is described at the meta-level using a class diagram. The BPMN metamodel can serve as a precise description of the notation and is therefore useful in implementing modeling tools, since it can be used as a basis to define the language syntax. However, it cannot serve as a precise description of the meaning and usage of BPMN constructs. Despite the strengths of the BPMN standard, its use on process modeling projects was not reached yet its potential. BPMN well-formedness rules are given in plain text so they are subjected to different interpretation by process modelers and tool makers. The lack of a rigorous language semantics for the underlying modeling notation is a significant source of problems. A consequence of this, given the expressiveness of the language, is that it is not difficult for process modelers to generate faulty models (see Chapter 8). The lack of precise semantics for BPMN makes difficult to produce well-formed models. It has been also difficult to develop effective tools for verification procedures (as surveyed in section 3.4). The level of formality of a model is not absolutely determined by its form of representation. Particularly, graphical notations can be seen as formal if they possess a precise semantics associated to their constructs. In [FELR98] three general approaches are identified to formalize modeling concepts. In this dissertation we follow the so called supplemental approach which uses formal statements to replace parts of an informal model that is expressed in natural language. A formal semantics for the BPMN standard can be obtained by defining a mapping from syntactic structures in the informal modeling domain to artifacts in the formally defined semantic domain [FELR98]. This mapping, often called a meaning function, is used to build interpretations of the informal models. Rather than generate formal specifications from informal BPMN models and requiring that developers manipulate these formal representations, our approach is to provide formal semantics for graphical modeling notation and then provide a tool that allow modelers to directly check the BPMN models they have created. Defining meaning functions allow exploring the appropriate 82
5. V ERIFICATION
OF
BPMN M ODELS
5.2. BPMN Rules Formalization
formal semantics for graphical modeling constructs. BPMN tools (and not the process modelers) should use these mappings to verify the correctness of the BPMN models. A central part of this dissertation is to develop a formal version of BPMN rules that could be used to build precise and analyzable models. Using the OCL textual notation, a BPMN model can be analyzed to determine the truth or falsity of some property being asserted about the process model. Each analysis involves applying a sequence of invariants to the process model to derive the required conclusion. After the specification of the invariants, and since BPMN metamodel alone is not expressive enough to define all properties, we must implement the invariants, to supplement the metamodel. Previous formalization of modeling notations [EFLR98] indicate that a precise and useful semantics must be complete (i.e., meanings must be associated with each wellformed syntactic structure), the intended level of abstraction must be preserved (i.e., the elements in the semantic domain must be at the same level of abstraction as their corresponding modeling concepts), and the final result must be understandable by developers. Based on these guidelines, we formalized for BPMN a set of static semantic rules1 [Aab96]. With OCL we were able to improve the static semantics of BPMN within the UML metalanguage context. Together with the BPMN graphical notation, to assist the development of process models, the static semantic (well-formedness) rules contribute to the preciseness of specification and to assist developers in moving towards correct implementation of process models. The formal semantics also allows automated tool to better support the notation. The informal usage of BPMN as a modeling technique, is amenable to produce models hard to read and interpret, due to the difficulty to understand used BPMN constructs by process modelers. This problem highlights the utility of formal techniques for conveying rigorous interpretation of the constructs. In the end it will be expected that BPMN models could be amenable to a more rigorous checking and analysis, through a simultaneous syntactical and well-formedness validation using a tools such as USE (UML based Specification Environment) [GBR07]. In section 5.2 is presented a formalization of BPMN well-formedness rules, as well as its implementation using OCL. These well-formedness and best-practices rules attached to the BPMN metamodel will serve as constraints for the verification of BPMN models. Section 5.3 summarizes the chapter.
5.2
BPMN Rules Formalization
The BPMN specification [BPM11] contains the rules regarding the correct usage of the language’s constructs, scattered by a document of five hundred of pages. Those rules 1
The static semantics defines restrictions on the structure of valid texts that are hard or impossible to express in standard syntactic formalisms, i.e., exclusively through the elements and relationships of the metamodel.
83
5. V ERIFICATION
OF
BPMN M ODELS
5.2. BPMN Rules Formalization
are expressed in natural language, yielding sometimes dubious interpretation. On the other hand, there are also rules that came from disseminated best-practices both from academics and practitioners [WM08, Sil09, All10]. In order to help BPMN process modelers to tackle the complexity of the process modeling language, we will formalize both the well-formedness and best-practices rules. Those rules are to be included in the BPMN metamodel to support the process diagram’s verification, enforcing well-formedness rules coming either from the BPMN specification or from the current BPMN modeling bestpractices. For implementing the rules we will use the OCL [OMG06]. OCL is a declarative and predicate logic like language that supplements the UML, and is used to implement the rules by means of invariants. A formal language, such as the OCL, can contribute for rigorously expressing well-formedness rules, which are hard to convey by graphical notations. With OCL we are able to improve the static semantics of BPMN, framed by the BPMN metamodel (section 3.3). Supplementing BPMN metamodel, with formal rules will help modelers to attaining well-formed BPMN process models.
5.2.1
Well formedness Rules
In Appendix E is listed the set of well-formedness rules withdrawn from the process modeling language specification [BPM11], through a rule mining process. They were scattered by the text and tables of the document standard in natural language. To give an idea how the specification of well-formedness rules are buried in the standard’s document we reproduce an excerpt, concerned with rule of section 5.2.1.1. The rule is in Table 10.88 - End Event Types on [BPM11, page 248], and is concerned with the Escalation Intermediate Event. This type of End indicates that an Escalation should be triggered. Other active threads are not affected by this and continue to be executed. The Escalation will be caught by a Catch Escalation Intermediate Event with the same escalationCode or no escalationCode which is on the boundary of the nearest enclosing parent Activity (hierarchically). The behavior of the Process is unspecified if no Activity in the hierarchy has such an Escalation Intermediate Event.
All the rules are implemented in OCL2 . In sections 5.2.1.1 – 5.2.1.3 we present a sample of 3 well-formedness rules. Besides the rationale of the rule, it is also presented a depiction of the correct and incorrect usage of the well-formedness rule, as well as its implementation as OCL invariant. 2
See http://sdrv.ms/16EvDjG
84
5. V ERIFICATION
5.2.1.1
OF
BPMN M ODELS
5.2. BPMN Rules Formalization
A Throwing Escalation Intermediate Event matches a non-Interrupting Escalation Catch Event
If an intermediate escalation event does not abort its current activity, the attached boundary event of the activity must be either a non-interrupting event with the same name of the intermediate escalation event, or unnamed. In this case, the throwing escalation event in the sub-process needs to be an intermediate event. So, an Escalation intermediate Event needs a non-interrupting Catch Escalation Event to capture it [All10, BPM11, page 248].
Figure 5.1: A Throwing Escalation Intermediate Event matches a non-Interrupting Escalation Catch Event Correct: A Throw Escalation Intermediate Event Escalation2 (top) is caught by an nonInterrupting Escalation Event Escalation2 (middle). Wrong: A Throw Escalation Intermediate Event Escalation2 is caught by an Interrupting Escalation Event Escalation2 (bottom).
A well-formedness rule can be enforced by attaching the following invariant to the ThrowEvent element of the BPMN metamodel. 85
5. V ERIFICATION
OF
BPMN M ODELS
5.2. BPMN Rules Formalization
Listing 5.1: A Throwing Escalation Intermediate Event matches a non-Interrupting Escalation Catch Event. 1 2 3 4 5 6 7 8 9 10 11 12 13
context ThrowEvent (self.isEscalationEvent() and self.oclIsTypeOf(IntermediateThrowEvent)) implies self.ownProcess().bpmnAllElements(self.ownProcess())->flatten ->select(oclIsKindOf(BoundaryEvent)) ->exists(t |(((t.oclAsType(BoundaryEvent).name.isDefined() and t.oclAsType(BoundaryEvent).name.size()>0) and self.name = t.oclAsType(CatchEvent).name) or t.oclAsType(BoundaryEvent).name.isUndefined() or t.oclAsType(BoundaryEvent).name.size()=0) and t.oclAsType(BoundaryEvent).isEscalationEvent() and t.oclAsType(BoundaryEvent).isNonInterruptingEvent())
5.2.1.2
A flow from an Interrupting Catch Event must merge the normal flow through an Exclusive Gateway
An attached interrupting event simply creates a token if it occurs during the execution of the corresponding activity. If both sequence flows (normal and interrupting) should be merged by a gateway, an exclusive gateway would be required. When an activity is carried out, an exception path originated from the Interrupting Catch Event can be taken due to early abortion of the activity. If later the exception path joins the normal sequence flow of the Process, it requires an Exclusive Gateway [All10, BPM11, pages 258, 259]. A well-formedness rule can be enforced by attaching the following invariant to the BoundaryEvent element of the BPMN metamodel. Listing 5.2: A flow from an Interrupting Catch Event must merge the normal flow through an Exclusive Gateway. 1 2 3 4 5 6 7 8 9 10 11 12 13 14 15
context BoundaryEvent inv interruptingEventPathMergedByAnExclusiveGateway: ((self.attachedToRef.container.getFlowNodesInPathFrom(self.attachedToRef) -> flatten()->asSet() ->intersection(self.attachedToRef.container.getFlowNodesInPathFrom(self) -> flatten())->size() > 0) and self.isInterruptingEvent()) implies (self.attachedToRef.container.getFlowNodesInPathFrom(self.attachedToRef) -> flatten()->asSet() ->intersection(self.attachedToRef.container.getFlowNodesInPathFrom(self) -> flatten())->select((oclIsTypeOf(ExclusiveGateway) or oclIsKindOf(Activity) or oclIsTypeOf(EndEvent)) and oclAsType(FlowNode).isJoin())->size()>0)
86
5. V ERIFICATION
OF
BPMN M ODELS
5.2. BPMN Rules Formalization
Figure 5.2: A flow from an Interrupting Catch Event must merge the normal flow through an Exclusive Gateway Correct: If the event TimeOut occurs, Activity1 will be aborted, and the downwards outgoing exception flow will be taken. Later it will join the normal flow of the process via an Exclusive Gateway (top). Wrong: The exception flow joins the normal flow through an Inclusive Gateway (bottom).
5.2.1.3
An Event SubProcess must not have any incoming or outgoing Sequence Flow
An Event SubProcess must not have incoming or outgoing Sequence Flow, since it is the Start Event that triggers the sub-process execution [BPM11, page 176]. The well-formedness rule regarding incoming or outgoing sequence flows can be enforced by attaching the following invariant to the SubProcess element of the BPMN metamodel. Listing 5.3: An Event SubProcess must not have any incoming or outgoing Sequence Flows. 1 2 3 4 5 6
context SubProcess inv noIncomingAndOutgoingSequenceFlow: self.isEventSubProcess() implies (self.inputSequenceFlows()->isEmpty() and self.outputSequenceFlows()->isEmpty())
87
5. V ERIFICATION
OF
BPMN M ODELS
5.2. BPMN Rules Formalization
Figure 5.3: An Event SubProcess must not have any incoming or outgoing Sequence Flows Correct: An event sub-process without incoming or outgoing Sequence Flows (top). Wrong: An event sub-process must not have any incoming or outgoing Sequence Flows (bottom).
5.2.2
Best-practices Rules
In this section we included some rules that we mined from works of academics and practitioners3 [WM08, Sil09, All10], aiming to ensure that common patterns and good practices are followed when process models are built using BPMN. These rules are not mandatory and are heavily dependent upon process modeling and methodological procedures implemented in each organization. All the rules are implemented in OCL4 . In the sections 5.2.2.1 – 5.2.2.3 we present a sample of 3 best-practices rules. In order to distinguish the invariants implementing bestpractices rules, from the ones prescribed by BPMN well-formedness rules, we prefixed the former invariants’ names with ’bp ’. The following sections present the rationale of the rule, a depiction of the correct and incorrect usage of the rule, as well as its implementation as OCL invariant. 5.2.2.1
Use explicitly Start Events and End Events
Process modeling best practices recommendations advise the explicit use of start and end events [WM08]. 3
There are some sites with lists of rules claimed by practitioners as essential to be followed in the BPMN process modeling. One of the most known examples is the Bruce Siver site at http://www.brsilver.com/2010/09/28/the-rules-of-bpmn/ [accessed in April, 16th 2012] 4 See http://sdrv.ms/16EvDjG
88
5. V ERIFICATION
OF
BPMN M ODELS
5.2. BPMN Rules Formalization
Figure 5.4: Use explicitly Start Events and End Events Use: Explicit usage of Start and End Event (top). Avoid: Use of instances of FlowNode as implicit Start and End Event (bottom).
The best-practice rule regarding Start and End Event can be enforced by attaching the following invariant to the FlowElementsContainer element of the BPMN meta-model. Listing 5.4: Use explicitly Start Events and End Events. 1 2 3 4 5 6 7 8
context FlowElementsContainer inv bp_useExplicitStartAndEndEvents: (bpmnElements()->reject(oclIsTypeOf(BoundaryEvent) or oclIsTypeOf(MessageFlow) or oclIsTypeOf(SequenceFlow))->size() > 0) implies ((self.totalNumberContainerEndEvents() > 0) and (self.totalNumberContainerStartEvents() > 0))
5.2.2.2
Simultaneous merging and splitting gateway should be avoided
A gateway with several inputs and several outputs at the same time may cause misunderstandings and should be avoided [All10]. The best-practice rule regarding gateway can be enforced by attaching the following invariant to the FlowElementsContainer element of the BPMN metamodel. Listing 5.5: Simultaneous merging and splitting gateway should be avoided. 1 2 3 4 5
context FlowElementsContainer inv bp_gatewayWithSeveralInputsAndSeveralOutputs: not (self.totalContainerGateways()-> exists(numberInputSequenceFlows() > 1 and numberOutputSequenceFlows() > 1 ))
89
5. V ERIFICATION
OF
BPMN M ODELS
5.2. BPMN Rules Formalization
Figure 5.5: Simultaneous merging and splitting gateway should be avoided Use: Gateway2 and Gateway2a with distinct merging and splitting roles (top). Avoid: Gateway2 with two simultaneous merging and splitting roles (bottom).
5.2.2.3
An event should have at most one outgoing Sequence Flow
A Gateway or Activity should be used if a split is needed after an event (not EndEvent), in order that only one outgoing sequence flow comes out of that event [All10]. The best-practice rule regarding events can be enforced by attaching the following invariant to the Event element of the BPMN metamodel. Listing 5.6: An event should have at most one outgoing Sequence Flow. 1 2 3 4 5 6 7 8 9 10 11
context Event inv bp_splitingEventShouldNotOccurAndOneTargetIsNeeded: (not self.oclIsTypeOf(BoundaryEvent) and -- it is not target to a SubProcess (self.outgoing_a.targetRef-> select(oclIsKindOf(FlowElementsContainer))->size()=0)) implies ((self.outputSequenceFlows()->size() select(oclIsKindOf(FlowNode))-> size() , υ(P2 ). A measure for an internal attribute can be defined as: Definition 6.5. BPMN Model Measure A measure υ conveys the valuation of an attribute A in a BPMN model P, denoted by PA , such that υ:PA →Q yields a formal entity υ(PA ) ∈ Q, which after instantiation becomes a measure observation. This leads to the following definition of a measurement scale: Definition 6.6. Measurement Scale Let I = (P, E, R1 , · · · , Rn ) be an intuitive measurement system, F = (Q, S1 , · · · , Sn ) a formal measurement system and υ a measure. The triple (P, Q, υ) is a scale of measurement if and only if for all i, j and for all a1 , · · · , ak , b, c ∈ P the following holds Ri (a1 , · · · , ak ) ↔ Si (υ(a1 ),· · · ,υ(ak )) and υ(b R0 c) = υ(b) S0 υ(c). If Q = R, with R as the set of real numbers, the triple (P, Q, υ) is a ratio scale. The properties for the measures of process models’ attributes, besides being logically consistent, should also hold for the admissible transformations of measures’ measurement scales. The choice of the scale of measurement must be based on the precision of the measurement goals and results usage. The measures we want to define are intended to measure standard attributes of process models, such as size, autonomy, or entanglement. We must ensure that what the measure conveys is actually what we look forward. For instance, we must check whether a measure we defined to measure the size of a process model is really a size measure. This can be done by using a set of properties which characterize the measures of a specified attribute. Sets of properties, are designed to facilitate such a verification procedure. These properties must be related with the attributes’ intuition. Instances of such properties can also be collected from the literature (e.g. [Wey88, BMB96]). Since those properties are grounded in measurement theory, they allow an initial formal perspective and definition based on the mathematical properties of measures, before is conducted a experimental validation. Measurement theory is a useful formal tool for building and validating measures and hence ensuring, through theoretical validation, whether the measure actually quantifies a concept intended to assess. This means that 106
6. M EASUREMENT
OF
BPMN M ODELS
6.3. A Framework for Measurement of BPMN Models
a measure υ of an attribute must be consistent with the intuitive understanding of this attribute. Theoretical validation supports modeling the intuitive understanding of the attribute to be measured. For instance, if υ is supposed to measure the understandability of process models, being P1 and P2 two process models, it is required that one can ensure that υ(P1 ) > υ(P2 ), before empirical studies could substantiate that process model P1 is more easy to understand than process model P2 . The abstraction chosen for capturing relationships among process models’ elements was the BPMN metamodel. BPMN constructs are the components which can be used to instantiate an actual BPMN process model. Such an instance is expressed graphically as a directed graph, consisting of nodes (e.g instances of FlowNode) and links (e.g. instances of SequenceFlow) [Fra03]. This abstraction helps expressing the intuition regarding the internal attributes’ properties and substantiate the base measures definition. 6.3.2.3
Definition of Indirect Measures for External Attributes
The definition of measures for the external attributes mirrors the steps shown in section 6.3.2.2 regarding internal attributes. To describe the characteristics of indirect measures for a given external attribute, are used statistical properties, which ensure the measure’s theoretical validity based on Statistical Theory. 6.3.2.3.1
Formalize External Attributes
External attributes are more tangible than internal attributes. For instance, a BPMN model’s external attribute such as understandability is much more easy to understand, on an intuitive level, than the complexity BPMN model’s internal attribute. Researchers and practitioners are more acquainted with external attributes, therefore the need for formalizing the properties of their corresponding measures is seen as less important than that for formalizing the properties of measures for internal attributes. There are external attributes of process models that can be interpreted using the probability properties. An axiomatic was given to the concept of probability in the Theory of Probability, a domain widely used, for example, to draw in formal terms inferences about the expected frequency of events. Since this knowledge on probability is already available, one can apply it to the current BPMN measurement context. In the theory of probability the representation of probabilistic concepts is given in terms that can be considered separately from their meaning. These terms are manipulated by the rules of mathematics and logic, and any results can be interpreted and translated back into the problem domain. From the theoretical attempts to formalize probability, we use the Kolmogorov formulation. In Kolmogorov’s perspective, sets are interpreted as events and the probability itself as a measure on a class of sets [DS02]. Kolmogorov introduced the notion of probability space, a mathematical construct with a specific kind of situation or experiment in mind, which models a real-world process consisting of states that occur randomly [AL06]. The probability space consists of three parts: 107
6. M EASUREMENT
OF
BPMN M ODELS
6.4. Measures Derivation for BPMN Process Models
• A sample space, Ω, the set of all possible outcomes. • A set of events F, where each event is a set containing zero or more outcomes. • The function P from events to probabilities, i.e., the assignment of probabilities to the events. This notion of probability space, together with other axioms of probability introduced by Kolmogorov, are the foundation for the indirect measures derivation in this work. 6.3.2.3.2
Define Indirect Measures
The validation of base measures was shown consisting mainly in checking the measures’ compliance with a set of properties. This may not always be the case for indirect measures since they usually cannot be precisely characterized [BMB96]. However, when using statistical tools, it is still possible to use theoretical techniques for validating indirect measures’ properties. For instance, it can be mathematically demonstrated that statistical tools that are intended to be used, such as correlation [Was04] and Binary Logistic Regression (BLR) [CC97], satisfy the probability properties [RPD98, MR03].
6.4
Measures Derivation for BPMN Process Models
Since a BPMN model is made up by the composition of many different elements (activities, data repositories, control-flows), which can be analyzed from different perspectives, there is no unique concept, which measurement could act as a universally accepted measure for BPMN models’ characteristics. Hence, we need to call upon a set of measures for evaluating the different internal attributes of process models. We want those measures to be associated with BPMN models’ quality characteristics (e.g. correctness) and provide guidelines and hints for attaining better process modeling artifacts. It is expected that in the future, as happened with modeling and development tools in Software Engineering, BPMN modeling tools would be able to provide process modeling measures to aid process analysts and designers to build process models, beyond the mere counting of elements found as indicators in current tools. There are already some proposals regarding BPMN measures, however with the limitations pointed out in section 4.4. To ensure the soundness of our measures’ proposals they were validated according to the framework detailed in section 6.3. As already mentioned, from the overall validation process (see Figure 6.2), in this section we are concerned, with theoretical validation leaving empirical validation for chapter 9.
6.4.1 6.4.1.1
BPMN Measurement Inception Define Measurement Goals
BPMN models’ quality is the focus of this dissertation. Therefore, the highest level, concerning goals, was assigned to the aim of attaining correct BPMN models. This objective 108
6. M EASUREMENT
OF
BPMN M ODELS
6.4. Measures Derivation for BPMN Process Models
is the most important one because faults in BPMN models can have impact in all business process’s life cycle. Since this is a very broad goal, we have to decompose it in intermediate goals. There are several BPMN model attributes (e.g. size, modularity) that are worth studying in our dissertation, since we believe that each one has some sort of influence in BPMN models’ correctness and therefore BPMN models’ quality. Studying the BPMN models’ attributes is feasible with the available resources and constraints. Studying other aspects (e.g. process modelers’ experience) that we presume are also influential for BPMN models’ quality would require other resources and case studies that are difficult to obtain, so that will not be undertaken in this dissertation. To fill the GQM goals’ template, we have to define relevant abstractions for BPMN models’ attributes. We have also to collect enough data about the quality focus to allow for a statistically significant validation of the relationships between the attributes’ measures of BPMN models and the quality characteristic we are focused. The aim is that measures can be used for defining prediction systems. Furthermore, correctness is the quality focus (external attribute) and it will be assessed by checking the conformance of BPMN models with BPMN well-formedness rules derived in section 5.2. We are concerned with violations of those rules in BPMN models specified in the BPMN standard [BPM11]. Those faults are relevant from the viewpoint of either process analysts and implementers. The non conformance of BPMN best-practices rules by process modelers are not our concern in this section. The source for our data collection is a set of open repositories of BPMN model snippets. Taking the GQM template, we formulated the top-level goal GB in the following terms: Analyze BPMN models for the purpose of prediction with respect to assessment of quality characteristic of correctness, from the point of view of process modelers, in the context of BPMN models collected from open repositories constrained by the requirements of regression studies. This top-level goal, stated to drive the measures’ theoretical validation through this section is in line with the research question RQB , formulated in general terms on chapter 1. The top-level goal GB is refined next with intermediate goals GB1 and GB2 . We decomposed also GB1 into the sub-goals, GB1a –GB1e , formulating these sub-goals in terms of the differences regarding the GB1 statement, as well as the goal related question. • GB1 – analyze BPMN models for the purpose of measurement models’ internal attributes with respect to assessment of quality characteristic of correctness, from the point of view of process modelers, in the context of samples of models collected from open repositories constrained by the requirements of correlational studies. Question: How to assess the internal attributes of BPMN models? ∗
GB1a – . . . for the purpose of assessing models’ entanglement . . . Question: How to measure the tangle of BPMN models? 109
6. M EASUREMENT
∗
OF
BPMN M ODELS
6.4. Measures Derivation for BPMN Process Models
GB1b – . . . for the purpose of measurement models’ autonomy . . . Question: How to measure the autonomy of BPMN models?
∗
GB1c – . . . for the purpose of measurement models’ complexity . . . Question: How to measure the complexity of BPMN models?
∗
GB1d – . . . for the purpose of measurement models’ modularity . . . Question: How to measure the modularity of BPMN models?
∗
GB1e – . . . for the purpose of measurement models’ size . . . Question: How to measure the size of BPMN models?
• GB2 – analyze BPMN models for the purpose of evaluating a prediction model with respect to assessment of quality characteristic of correctness, from the point of view of process modelers, in the context of samples of models collected from open repositories, constrained by the requirements of regression studies. Question: How to evaluate a prediction model of BPMN models’ quality characteristic of correctness?
6.4.1.2
Define Intuitive Hypotheses
Here we state hypotheses on aspects of the BPMN models that are relevant to the measurable goals. An intuitive hypothesis is a statement believed to be true about the relationship between one or more attributes of the BPMN models (object of study) and the external attribute correctness (quality focus). The hypotheses formulated below intend to reveal our intuitive understanding of the phenomena in study. As mentioned before, the intuitive hypotheses are candidate hypotheses to the statistical tests of hypotheses to be conducted later in the empirical studies (chapter 9). The latter should be more precisely formulated when additional information becomes available about measures for the internal and external attributes. The process models’ measures that we propose are next summarized and their definition adapted to BPMN process modeling, in order to be implemented through the BPMN metamodel: 1. IHB1a (Tangle and Correctness): High entanglement among instances of FlowNode will result in a high interrelated model, which is undesirable since changes in one part of the model could have collateral effects in the interlinked instances. On the other hand, a model with highly interconnected FlowNode instances would have a greater difficult to be understandable or more prone to modeling errors. An increase in entanglement should imply an increase in error proneness of the overall BPMN model. 2. IHB1b (Autonomy and Correctness): The better the process modeler is able to encapsulate related modeling features together, the more reliable and maintainable will be the designed business process. A more cohesive and autonomous instance of Activity should encapsulate aspects regarding the responsibility it is supposed to ensure. An increase in the autonomy should imply a decrease in error probability 110
6. M EASUREMENT
OF
BPMN M ODELS
6.4. Measures Derivation for BPMN Process Models
of the overall process model. So, high autonomy values are related to lower errorproneness, due to the fact that the changes required by a change in a sub-model are confined in a well-encapsulated part of the overall model. 3. IHB1c (Complexity and Correctness): Simpler models are preferable to complicated ones, since those are more difficult to verify and more prone to reduce the understandability quality attribute. An increase in the complexity should imply an increase in error proneness of the overall BPMN model. 4. IHB1d (Modularity and Correctness): A low value of modularity means a high level of flatness, and therefore the model was built in extension and not using instances of SubProcess, which could affect the BPMN model quality. An increase in the modularity should imply a decrease in error proneness of the overall BPMN model. 5. IHB1e (Size and Correctness): the size of the BPMN model, is measured by the weighted number of instances of Activity, Event and ItemAwareElement included in the BPMN model. An increase in the size should imply an increase in error proneness of the overall BPMN model. 6. IHB2 (Prediction Model for Correctness): the internal attributes of the BPMN model, determine its structural characteristics. A prediction model can establish the correlation among the internal attributes of the BPMN model and its error proneness.
6.4.2 6.4.2.1
Definition of Base Measures for Internal Attributes Formalize Internal Attributes
The properties we define here for BPMN models internal attributes are a generalization of the properties that authors have already provided in the literature (e.g. [Wey88, BMB96]) for Software Engineering. Although there might be some consensus on some of the properties, the acceptance of a set of properties for an internal attribute is ultimately a subjective matter, as well as for any formalization of an informal concept. We do not claim to address all types of possible properties for each internal attribute. On the other hand, the fact that similar sets of properties are associated with different internal attributes is not contradictory, since each property is interpreted differently in the context of each attribute. The properties of each of the BPMN models’ internal attributes are presented next: Tangle – The internal attribute of tangle captures the amount of relationships (instances of SequenceFlow) between FlowNode elements in a BPMN model. Given a FlowNode instance, two kinds of entanglement exists. The inbound entanglement captures the amount of relationships from elements outside the FlowNode instance to the instance itself; the outbound entanglement captures the amount of relationships from the FlowNode instance to elements outside the processing element. Definition 6.7. Tangle – The entanglement of a process model P or a sub-model is a function Tangle(P) that is characterized by the following properties: 111
6. M EASUREMENT
OF
BPMN M ODELS
6.4. Measures Derivation for BPMN Process Models
Property 6.7.1. Tangle Nonnegativity – The entanglement of a process model P = [E, L] is non-negative Tangle(P) ≥ 0 Property 6.7.2. Tangle Null Value – The entanglement of a process model P = [E, L] is null if, for all processing elements (Ea ), the inbound relationships (Lai ) and outbound relationships (Lao ) are empty sets ∀ Ea (Lai = ∅ ∧ Lao = ∅) ⇒ (Tangle(P) = 0) Property 6.7.3. Tangle Monotonicity – Given a process model P1 = [E1 , L1 ] and another process model P2 = [E2 , L2 ], obtained from P1 by adding a set of inbound (L2i ) and/or outbound (L2o ) relationships linking to/from processing elements E1a from P1 , with L2i ⊆ L2 ∧ L2o ⊆ L2 , then the entanglement do not decreases Tangle(P2 ) ≥ Tangle(P1 ) Property 6.7.4. Tangle Abstracting Sub-Models – Given a process model P1 = [E1 , L1 ] and another process model P2 = [E2 , L2 ], obtained from P1 by removing the sub-model m1 = [Em1 , Lm1 ], then the entanglement increases Tangle(P2 ) ≥ Tangle(P1 ) Autonomy – The concept of autonomy assesses the tightness with which related processing element (instance of Activity) features are grouped together in a process model or sub-model. It is assumed that the better a processing element is able to encapsulate related business process features together, the more reliable and maintainable the process model will be. Definition 6.8. Autonomy – The autonomy of a process model P or a sub-model is a function Autonomy(P) that is characterized by the following properties: Property 6.8.1. Autonomy Nonnegativity – The autonomy of a process model P = [E, L] is non-negative Autonomy(P) ≥ 0 Property 6.8.2. Autonomy Null Value – The autonomy of a process model P = [E, L] is null if processing elements (Ea ) or the relationships (L) between the former are empty sets (Ea = ∅) ∨ (L = ∅) ⇒ (Autonomy(P) = 0) Property 6.8.3. Autonomy Non-Monotonicity – Given a process model P1 = [E1 , L1 ] and another process model P2 = [E2 , L2 ] with the same set of processing elements E1 = E2 , adding relationships between processing elements to the process model P2 , such that L1 ⊆ L2 , do not decrease the autonomy of P2 , i.e., 112
6. M EASUREMENT
OF
BPMN M ODELS
6.4. Measures Derivation for BPMN Process Models
Autonomy(P1 ) ≥ Autonomy(P2 ) Property 6.8.4. Sub-Models Autonomy – Given a process model P1 = [E1 , L1 ] and another process model P2 = [E2 , L2 ], obtained from P1 by converting interrelated processing elements E1i from P1 in a sub-model m2 = [Em2 , Lm2 ], such that {E1i } ⊆ Em2 ∧ Lm2 ⊆ L2 , then the autonomy do not decrease Autonomy(P2 ) ≥ Autonomy(P1 ) Complexity – The more control-flow edges Lc exists between the elements of a process model, the more complex is the process model. Intuitively, one could expect that the complexity of a process model was not lesser than the sum of complexities of the submodels considered per se. Definition 6.9. Complexity – The complexity of a process model P is a function Complexity(P) that is characterized by the following properties: Property 6.9.1. Complexity Nonnegativity – The complexity of a process model P = [E, L] is non-negative Complexity(P) ≥ 0 Property 6.9.2. Complexity Null Value – The complexity of a process model P = [E, L] is null if Lc is an empty set (Lc = ∅) ⇒ (Complexity(P) = 0) Property 6.9.3. Complexity Monotonicity – The complexity of a process model P = [E, L] is not lesser than the sum of the complexities of any set of its sub-models m1 = [Em1 , Lm1 ] and m2 = [Em2 , Lm2 ]. None two sub-models share control-flow edges, so any control-flow edge in the process model P (Lc ) belongs to one of the sub-models m1 (Lm1c ) or m2 (Lm2c ) or the process model, and the sub-models do not share control-flow edges. (m1 ⊆ P ∧ m2 ⊆ P ∧ Lc ⊇ Lm1c ∪ Lm2c ) ∧ Lm1c ∩ Lm2c = ∅ ⇒ Complexity(P) ≥ Complexity(m1 ) + Complexity(m2 ) Property 6.9.4. Control-Flow Relationship Monotonicity – Adding control-flow edges between elements of a process model P1 , such that L1c ⊆ L2c , do not decrease the complexity of P1 Given P1 = [E1 , L1 ] ∧ P2 = [E2 , L2 ] ∧ L1c ⊆ L2c ⇒ Complexity(P2 ) ≥ Complexity(P1 ) Modularity – The concept of modularity is related to the decomposition of the main process model in sub-models. Intuitively, one could expected that an high level of modularization in models with less number of graphical elements could enhance the overall model. 113
6. M EASUREMENT
OF
BPMN M ODELS
6.4. Measures Derivation for BPMN Process Models
Definition 6.10. Modularity – A measure of the graphical elements that are part of submodels in a process model, P = [E, L], is a function Modularity(P) that holds the following properties: Property 6.10.1. Modularity Nonnegativity – Modularity cannot be negative Modularity(P) ≥ 0 Property 6.10.2. Modularity Null Value – Modularity is null when a process model contains a unique sub-model m = [Em , Lm ] that depicts the overall business process, without considering the components’ graphical details. (|m| = 1) ⇒ (Modularity(P) = 0) Property 6.10.3. Modularity Monotonicity – Adding a sub-model mi to a process model, for the same number of processing entities (Ea ), cannot decrease the modularity (P1 = [E1 , L1 ] ∧ P2 = [E2 , L2 ] ∧ E2 ⊆ E1 ∪ {mi }) ⇒ (Modularity(P2 ) ≥ Modularity(P1 )) Property 6.10.4. Modularity Decreasing by Merging Sub-Models – Given a process model P1 = [E1 , L1 ], merging the sub-models of P1 , m1 = [Em1 , Lm1 ] and m2 = [Em2 , Lm2 ] originating the process model P2 = [E2 , L2 ] does not increase the modularity of the latter (m1 ⊆ P1 ∧ m2 ⊆ P1 ∧ E2 ⊇ Em1 ∪ Em2 ) ⇒ Modularity(P2 ) ≤ Modularity(P1 ) Size – The concept size is informally related to the number of graphical elements that fill a process model. Definition 6.11. Size – A measure of the graphical elements that are part of a process model, P = [E, L], is a function Size(P) that holds the following properties: Property 6.11.1. Size Nonnegativity – Size cannot be negative Size(P) ≥ 0 Property 6.11.2. Size Null Value – Size is null when a process model does not contain any elements (E = ∅) ⇒ (Size(P) = 0) Property 6.11.3. Size Monotonicity – Adding elements to a process model cannot decrease its size (P1 = [E1 , L1 ] ∧ P2 = [E2 , L2 ] ∧ E1 ⊆ E2 ) ⇒ (Size(P2 ) ≥ Size(P1 )) Corollary 6.11.1. Size Decreasing by Merging Sub-Models – Merging sub-models m1 = [Em1 , Lm1 ] and m2 = [Em2 , Lm2 ] can decrease the size of the process model P (m1 ⊆ P ∧ m2 ⊆ P ∧ E ⊆ Em1 ∪ Em2 ) ⇒ Size(P) ≤ Size(m1 ) + Size(m2 ) 114
6. M EASUREMENT
6.4.2.2
OF
BPMN M ODELS
6.4. Measures Derivation for BPMN Process Models
Define Base Measures
For each one of the attributes of BPMN models, base measures are defined by using abstractions of elements and relationships. The measures are normalized in order to allow meaningful comparisons between different BPMN models. After is defined each base measure, it is checked whether the measure is compliant with previously defined properties of internal attributes they intend to measure. Definition 6.12. Measure Tangle – We define the measure tangle (tg) of a BPMN model as the ratio between the total number of edges e (SequenceFlow) over the total number of nodes n (FlowNode) of a BPMN model. tg =
|e| |n|
(6.1)
• Property Tangle Nonnegativity – The property holds if a BPMN model has more than one FlowNode. • Property Tangle Null Value – The tangle of a BPMN model is null if for all FlowNode there are no inbound or outbound SequenceFlow. • Property Tangle Monotonicity – Given a BPMN model adding a set of inbound and/or outbound SequenceFlow will increase the entanglement of the model. • Property Tangle Abstracting Sub-Models – Given a BPMN model and another BPMN model derived from the first by replacing a SubProcess by its elements, the entanglement will increase. Definition 6.13. Measure Autonomy – We define autonomy (aut) of a BPMN model as the total number of processing nodes a (Activity) over the total number of edges e (SequenceFlow). aut =
|a| |e|
(6.2)
• Property Autonomy Nonnegativity – The property holds if there is at least a SequenceFlow instance. • Property Autonomy Null Value – The autonomy of a BPMN model is null if there are no Activity nodes or SequenceFlow edges. • Property Autonomy Non-Monotonicity – Given a BPMN model and another BPMN model derived from the first one by adding SequenceFlow edges among Activity nodes, the autonomy will not decrease. • Property Sub-Models Autonomy – Given a BPMN model and another BPMN model derived from the first one by converting interrelated Activity nodes into a SubProcess. The autonomy of the second BPMN model will not decrease. Definition 6.14. Measure Complexity – We define complexity (cx) of a BPMN model (slightly based on CFC [CMNR06]) as the possible number of mental states [Mil56], which are given by the weighted sum of control-flow nodes (gi ) (Gateway), where i refers 115
6. M EASUREMENT
OF
BPMN M ODELS
6.4. Measures Derivation for BPMN Process Models
the OR-splits nodes (o ), which receive a weight of 2 for being more difficult to mentally follow; parallel-splits (p ) that receive the weight 0.5 for being more easily processed; finally the XOR-splits nodes (x ) receive a neutral weight of 1. The logarithmic scale was used to reduce the data range variation. cx = log2 (1 + (2 × |go |) + |gx | + (0.5 × gp ))
(6.3)
• Property Complexity Nonnegativity – The property holds independently of the number of Gateway nodes. • Property Complexity Null Value – The complexity of a BPMN model is null if there are no Gateway nodes resulting from OR-splits, parallel-splits and XOR-splits nodes. • Property Complexity Monotonicity – Given a BPMN model composed by at least two SubProcess. The complexity of the BPMN model will not decrease regarding the sum of the complexities of the two SubProcess. • Property Control-Flow Relationship Monotonicity – Given a BPMN model and another BPMN model derived from the first one by adding Gateway nodes resulting from OR-splits, parallel-splits or XOR-splits nodes. The complexity of the second BPMN model will not decrease. Definition 6.15. Measure Modularity – A low value of modularity mean a high level of flatness (the Activitiy nodes denoted by a are mainly Task), and therefore the BPMN model was built in extension and not by modules (Subprocess or CallActivity denoted by sp). md =
|sp| |a|
(6.4)
• Property Modularity Nonnegativity – The property holds if there is at least an Activity node. • Property Modularity Null Value – The modularity of a BPMN model is null if there are no SubProcess nodes or only Task nodes. • Property Modularity Monotonicity – Adding a SubProcess to a BPMN model, for the same number of Activity nodes, cannot decrease the modularity of the BPMN model. • Property Modularity Decreasing by Merging Sub-Models – Given a BPMN model. Merging several SubProcess nodes into one SubProcess does not increase the modularity of the BPMN model. Definition 6.16. Measure Size – The elements that compose size (sz) are weighted due their relative importance in the process model from 2, for activities (a), to 0.5 for data elements (d). Events (v) are given the weight of 1. Gateways are not considered in the size measure since they were already considered as part of the complexity measure. The logarithmic scale was used to reduce the data range variation. sz = log2 (1 + 2 × |a| + |v| + 0.5 × |d|) 116
(6.5)
6. M EASUREMENT
OF
BPMN M ODELS
6.4. Measures Derivation for BPMN Process Models
• Property Size Nonnegativity – The property holds if there is at least an Activity, Event, or ItemAwareElement nodes. • Property Size Null Value – The size of a BPMN model is null if there are no Activity, Event or ItemAwareElement nodes. • Property Size Monotonicity – Adding Activity, Event or ItemAwareElement nodes to a BPMN model cannot decrease its size. • Corollary Size Decreasing by Merging Sub-Models – Merging SubProcess nodes can decrease the size of the BPMN model. We have been using the BPMN metamodel for representing BPMN diagrams, which is a kind of directed graphs where the nodes are instances of type FlowNode and the edges – linking a source FlowNode to a target FlowNode – are instances of type SequenceFlow. As already done regarding BPMN validation (section 5.2), we use here OCL for instantiation of the BPMN measures previously defined and theoretically validated. In Listing 6.1 is shown the example of the implementation, as a OCL operation, of the BPMN measure tangle. This approach improves the BPMN metamodel with functionalities regarding assessment of internal attributes of BPMN models. An advantage of our approach is to contribute for overcoming a common shortcoming of informal definition of measures, which often drives to a different and inconsistent implementation by tool makers. As will be referred in chapter 7 our BPMN measures were implemented in a UML environment with OCL evaluation support (USE [GBR07]), which allowed the testing and collection of data of BPMN measures for empirical validation (chapter 9). Our approach regarding measures definition, follows other ones undertaken in the realm of Software Engineering, such as the ones using the Z notation [MM97b, MM97a] and M2DM approach [BeA01]. Listing 6.1: Implementation of tangle measure in OCL 1 2 3 4 5 6
abstract class FlowElementsContainer < BaseElement ... operations ... -- returns the measure observation for entanglement tangle(): Real = self.edges() / self.nodes()
7 8 9 10
-- returns the number of SequenceFlow in the container and sub-containers edges(): Integer = self.bpmnAllElements(self)->flatten-> select(oclIsKindOf(SequenceFlow))->size()
11 12 13 14
-- returns the number of FlowNode in the container and sub-containers nodes(): Integer = self.bpmnAllElements(self)->flatten-> select(oclIsKindOf(FlowNode))->size()
15 16 17 18 19
-- returns all BPMN elements from a container and its subcontainers bpmnAllElements(container : FlowElementsContainer): Set(Set(OclAny)) = visitContainerContentAll(container, oclEmpty(Set(Set(OclAny)))->
117
6. M EASUREMENT
OF
BPMN M ODELS
6.4. Measures Derivation for BPMN Process Models
including(container.bpmnElements()->asSet()))
20 21 22 23 24 25 26 27 28 29 30 31 32 33 34
-- auxiliar function of bpmnAllElements() visitContainerContentAll ( e : FlowElementsContainer, allElementsContainers: Set(Set(OclAny))) : Set(Set(OclAny)) = let containers: Set(FlowElementsContainer) = e.bpmnContainers()->asSet() in if containers->isEmpty() then allElementsContainers else containers->iterate(elem: FlowElementsContainer; acc: Set(Set(OclAny)) = allElementsContainers | visitContainerContentAll(elem, acc->including(elem.bpmnElements()->asSet()))) endif
35 36 37 38 39
-- returns all containers in current container bpmnContainers() : Set(FlowElementsContainer) = self.flowElements-> select(oclIsKindOf(SubProcess))-> collect(oclAsType(SubProcess)) -> asSet()
40 41 42 43 44 45 46 47 48 49
-- returns all elements from current container bpmnElements() : Set(BaseElement) = self.bpmnFlowElements() ->union(self.bpmnMessageFlows()) ->union(self.bpmnAssociations()) ->union(self.bpmnDataAssociations()) ->union(self.bpmnArtifactElements()) ->union(self.bpmnDataElements()) -> asSet() ... end
6.4.3 6.4.3.1
Definition of Indirect Measures for External Attributes Formalize External Attributes
In the context of the present dissertation we focused on the BPMN models’ external attribute of correctness. The quality characteristic of correctness can be interpreted using the probability concept. Probability is a well understood attribute and exists a wide consensus about its meaning. To formally introduce the properties regarding probability, we rely on the notion of probability formalized through the Kolmogorov approach (section 6.3.2.3.1). Having in mind however that it is outside of the scope of this work to delve into the probability theory since here, the probability concept is used only as a auxiliary tool. A more indepth perspective on probabilities can be found in any basic work, such as [DS02]. The definition of probability P and some of its basic properties are summarized below: Definition 6.17. Probability – A probability P is a real valued set function defined on a sample space that satisfies the following properties. 118
6. M EASUREMENT
OF
BPMN M ODELS
6.4. Measures Derivation for BPMN Process Models
Property 6.17.1. Empty Set – Given an empty subset A of the sample space S P(A) = 0 Property 6.17.2. Monotonicity – Given the subsets A and B of the sample space S, if A ⊆ B then P(A) ≤ P(B) Property 6.17.3. Bound – Given any subset A of the sample space S 0 ≤ P(A) ≤ 1 Property 6.17.4. Maximum – The maximum of the probability measure of the whole sample space S is P(S) = 1 Property 6.17.5. Additivity – The probability measure of the union of a finite or infinite collection of disjoint events A1 , A2 , . . . is the sum of the probabilities of the individual events P(A1 ∪ A2 ∪ . . . ) =
∞ X P(Ai ) i=1
The link of the probability concept to the BPMN models’ external attribute correctness is done by assuming correctness as the probability of no occurrence of well-formedness rule violation in a BPMN model. So, we need to verify the BPMN models concerning the well-formedness rules’ violations that they may have. Hence, our sample space will be all the BPMN models checked regarding well-formedness rules’ conformance. The outcome of a random experiment will be the occurrence of at least one well-formedness rule violation in a BPMN model or the absence of violations. The rules to be checked are part of the BPMN standard and were previously defined and implemented in OCL (section 5.2). Multiple violations of the same rule are counted as a unique violation. 6.4.3.2
Define Indirect Measures
The probability of an event, in our case the violation of well-formedness rules in a BPMN model of the population, cannot be measured directly, but it can be estimated. The actual measure of a probability requires a indirect measure and must be provided a formula for it. Depending on the measurement goal, different statistical tools can be used for providing the estimation. In statistics, correlation refers to a statistical relationship involving association between variables. The association relationship, formally refers to generic situations in which two sets of data do not satisfy a mathematical condition of probabilistic independence [MR03]. However, we must bear in mind that correlation do not mean causation. 119
6. M EASUREMENT
OF
BPMN M ODELS
6.4. Measures Derivation for BPMN Process Models
Correlation, technically refers a specialized type of relationship between mean values. There are several correlation coefficients, measuring the degree of correlation between random variables. The commonest of these, in parametric tests, is the Pearson correlation coefficient, denoted by ρ, which is sensitive only to linear relationships [Was04]. For non-parametric tests, are used the Spearman’s rank correlation coefficient and Kendall rank coefficient [Was06]. Other correlation coefficients exists more sensitive to nonlinear relationships [MR03]. The Pearson and Spearman correlation values can be: • +1 in the case of a perfect positive linear relationship • −1 in the case of a perfect negative linear relationship (anti-correlation) • some value between −1 and +1 in all other cases, indicating the degree of linear dependence between the variables. As it approaches zero there is less of a relationship (closer to uncorrelated). The closer the coefficient is to either −1 or +1, the stronger the correlation between the variables. If the variables are independent, the correlation coefficient is 0. The reverse is not true because the correlation coefficient detects only linear relationship between two variables. In the special case when X and Y are jointly normal, uncorrelated means independence. Correlation coefficient between two random variables X and Y is defined as
Cov(X, Y) ρ(X, Y) = p . Var(X)Var(Y) The sample correlation coefficient r between two samples xi and yj is defined as r = Sxy /
p Sxx Syy
The example of correlated phenomena in this work includes the one between the BPMN models’ base measures regarding internal attributes (e.g. complexity, size) and BPMN models’ external attribute correctness. Such kind of correlations are useful because they can be exploited in practice by process modelers, for predictive purposes. We also use in this work, the Binary Logistic Regression statistical tool [CC97], which is flexible enough for modeling a number of different relationships. The BLR is a classification technique for estimating the probability of a BPMN model has to belong to a specific class, based on the values of the independent variables that quantify the BPMN models’ base measures. For calibration of the BLR model, must be collected and recorded data on the violations of well-formedness rules. For the case of the dependent variable Y (correctness of BPMN models in our case), which can take only two values, 0 and 1, and any number of independent variables Xi (measures of BPMN models’ internal attributes), the multivariate binary logistic regression model is defined by the equation: π(X1 , X2 , . . . , Xn ) =
e(β0 +β1 ·X1 +...+βn ·Xn ) 1 + e(β0 +β1 ·X1 +...+βn ·Xn ) 120
(6.6)
6. M EASUREMENT
OF
BPMN M ODELS
6.5. Conclusion
Coefficients βi are estimated through maximum likelihood estimation. The following two statistics are used to describe our experimental results: • ρ – The level of significance of the binary logistic regression coefficient βi provides the probability that βi is different from zero by chance, i.e., Xi has an impact on π. • R2 – The goodness of fit range between 0 and 1. The higher R2 , the higher the effect of the model’s independent variables, the more accurate the model. A high value for R2 is rare for logistic regression. R2 may be described as a measure of the proportion of total uncertainty that is attributed to the model fit.
6.5
Conclusion
Usually process models’ measures are derived focusing almost exclusively on their theoretical or empirical validation. This may lead to results difficult to interpret or generalize. In this dissertation we cover the two approaches for a set of proposed BPMN measures. In this chapter, we began theoretical validation by setting up the BPMN measurement terminology (section 6.2), grounded on concepts and definitions anchored upon the metrology vocabulary and the industry’s set of standards on quality, on measurement concepts from the discipline of Software Engineering, as well as on an the SMO ontology. We also proposed the adaption of a framework for BPMN measurement, based upon the measure definition process GQM/MEDEA, a systematic approach from software measurement. The proposed BPMN measurement framework allowed the customized setting up of guidelines for design and definition of sound BPMN measures (section 6.3). The BPMN measurement framework is instantiated in section 6.4. Based on the knowledge of the BPMN language, were explicitly defined specific measurement goals. Also a set of intuitive hypotheses were formulated in order to be validated. Next, internal attributes of interest were identified and base measures were validated against a set of theoretically properties. The base measures are intend to quantify various BPMN models’ internal attributes (e.g. size, complexity, etc.) and are the independent variables of a prediction model for BPMN measurement. Finally, was derived an indirect measure, quantifying the dependent variable, and related to an external attribute (correctness). The main contribution of this chapter is the correlation relationship and the prediction model built for explaining the relationship between BPMN models’ base measures and the external quality measure. The results attained in this chapter will be subject of empirical validation in chapter 9.
121
[This page is intentionally blank]
7 Model Driven Approach for BPMN Verification and Measurement
"Knowing reality means constructing systems of transformations that correspond, more or less adequately, to reality." – Jean Piaget
Contents 7.1
Introduction . . . . . . . . . . . . . . . . . . . . . . . . . . . . . . . . . . . 124
7.2
Process Modeling in Model Driven Engineering . . . . . . . . . . . . . 125
7.3
Instantiation for BPMN Verification and Measurement . . . . . . . . . 134
7.4
Conclusion . . . . . . . . . . . . . . . . . . . . . . . . . . . . . . . . . . . 143
Context: The MDE paradigm advocates that relevant concepts of a domain, as well as any changes made in the domain, can be depicted as a model. Objective: Highlight the relationship that can be established between MDE and BPMN, which underpins the expected contributions of the present research work. Method: The MDE approach was instantiated for BPMN through MDA/Ecore approaches. Results: BPMN well-formedness rules were implemented in the BPMN metamodel, and was collected the data needed for empirical validation. Limitations: Albeit the approach brings the BPMN to the context of MDE, using different kinds of tools and languages, we are aware that the potential of this relationship was only slightly scratched. 123
7. M ODEL D RIVEN A PPROACH
FOR
BPMN V ERIFICATION
AND
M EASUREMENT
7.1. Introduction
Conclusion: This chapter clarifies how the results attained by the two previous ones, will be operationalized for the empirical validation to be made in the two next chapters.
7.1
Introduction
Model Driven Engineering (MDE) is an approach aiming to effectively express concepts of particular domains, as well as tackling the growth of complexity of systems development [Sch06]. According to the MDE paradigm, the relevant concepts of the domain, as well as any changes made in a system, are amenable of being depicted in models. So, in the MDE, every concept must be modeled. Any change in a process must be shown in the model that represents that process. Process models can be used either to specify a process to be implemented, or to describe an existing process. Explained in a simple way new processes are produced from process model’s specification, while descriptive process models are designed from existing processes. So, in the context of process modeling, model engineering is about: (1) producing process model’s specification; and (2) generating a valid process from a process model. Process models developed at a higher level of abstraction, represent business requirements, and they must be correct. The transformation of these processes models to a less abstract level, for the development and implementation on a BPMS, should be made after being ensured that models are correct. Therefore, before transforming models between layers of abstraction we must check the correctness and consistency of our models, i.e., ensure that BPMN models are syntactically correct and well-formed. Process models can have their internal and external attributes quantified through measures. The measures can be instantiated and quantified by applying a measurement method or function (section 6.3) to the constructs of the process modeling language such as BPMN. This allows that measurement of BPMN models attributes could be achieved independently of platform’s deployment of processes. Platform independence is another principle on which MDE is based. Another important concept in MDE is model transformation. By transforming models, the evolution of the processes is facilitated. A process model could be transformed to another process model or to a XML dialect (e.g. XMI, XPDL) as well as to the source code (e.g. BPEL) that implements the process model functionality. We addressed in previous chapters some contributions of this dissertation, namely the formalization of BPMN well-formedness rules (chapter 5) and the measurement of quality attributes of BPMN models (chapter 6). The goal of this chapter is to go further regarding the linkage between MDE and process modeling. We begin by introducing the main concepts regarding MDE, as well as the close relationship between MDE and BPMN (section 7.2). In section 7.3, we instantiate the MDE approach by implementing BPMN well-formedness rules, and collect the data needed for the empirical validation that will be performed in chapters 8 and 9. 124
7. M ODEL D RIVEN A PPROACH
FOR
BPMN V ERIFICATION
AND
M EASUREMENT
7.2. Process Modeling in Model Driven Engineering
7.2
Process Modeling in Model Driven Engineering
Model Driven Engineering (MDE) is a global approach that became popular, both in the research and industrial communities, which aims to integrate existing results and bodies of knowledge regarding Software Engineering. However, the MDE approach is not restricted to the development and evolution of software systems. The same concepts underpinning MDE have been adopted in other fields of Computer Science, albeit with different perspectives and using specific terminology. Besides the already mentioned focus on designing and building software through Modelware / UML, one can find examples of the same open and integrative approach of MDE in several other research communities/technologies, such as Grammarware / BNF, Documentware / XML, Dataware / SQL [FN05]. Likewise, one could see process modeling as part of what we can call the Processware community with, for instance, BPMN as its technology. The definition of essential concepts of MDE (e.g. models, metamodels and transformations), and the relations between them, has been conveyed through the concept of megamodel [Fav05]. A megamodel intends to define the set of entities and relations that are necessary to model different aspects about MDE. Megamodels should have technologically independent representations and its concepts should be able of being validated through the use of a wide range of artifacts. Among the different ways of expressing megamodels Favre uses UML with OCL constraints [FN05]. Concepts such as decomposition, representation, conformance, and transformation fit in the megamodel depicted in Figure 7.1. For each research community, the concepts that are part of the megamodel definition are operationalized in a different way. For instance what is called a metamodel in Modelware corresponds to a schema for Documentware and Dataware communities, a grammar in Grammarware, a viewpoint in the software architecture community [FN05], or even a directed graph in Processware. Since BPMN is also underpinned by a metamodel, we could also address process modeling from the perspective of Modelware. While adapting the megamodel in [FN05] to the realm of process modeling, we put at the center of the model the process (Figure 7.1). The process can be seen in several different perspectives, such as As-Is or To-Be, manual or automated, etc. The four unary relationships convey the typical MDE associations that can be established among models in the same or different levels of abstractions. The RepresentationOf relationship has on one side the role of model regarding a specific process, while the other side refers to the role of the process under study (PUS). It is not expected that a model could convey everything about a PUS. It is only expected that it could convey the information required for the purpose it was built. Conversely, a process model is an abstraction of a business process. The notion of model is relative, and is not an intrinsic property of a business process [FN05]. The ConformantTo association relates models, i.e., it links a model to its metamodel. To 125
7. M ODEL D RIVEN A PPROACH
FOR
BPMN V ERIFICATION
AND
M EASUREMENT
7.2. Process Modeling in Model
Driven Engineering
Figure 7.1: Processware Megamodel (adapted from [FN05])
understand a model one must know in what language the model is represented. Thus, is required a model of the language for checking whether the model is conform to the grammar. A model of a language is just a representation that provides answers about the language under study. In our particular case, the model of the BPMN language is the BPMN specification document or the BPMN metamodel. On the other hand, a BPMN tool being a concrete software system embodies a metamodel when it is used to check whether a given BPMN diagram is conform or not to BPMN syntactical rules. This behavior is similar to a Java parser which also embodies a metamodel (herein called a Grammar) and is used by programmers to check whether a certain Java program is conform or not with Java syntax. The grammar of the language is not the same as the language itself. The language is the infinite set of all valid statements of the language. The grammar is the finite set of all grammatical rules of the language. On the other hand a modeling language is a set whose elements are models. Applying these notions to the realm of BPMN one can say: the BPMN grammar is the finite set of all grammatical rules of the BPMN language. The BPMN language is the infinite set of all valid BPMN diagrams. Since the statements of BPMN are models, BPMN is naturally a modeling language. Introducing the concept of modeling language makes it possible to give a precise definition of a metamodel from the MDE perspective. A metamodel is a model of a modeling language. The BPMN specification document plays the role of metamodel because it models the BPMN modeling language. Also in the ConformantTo association emphasis must be put on the fact that the notion of model and metamodel are roles, not intrinsic properties of processes [FN05]. To model the large diversity of systems, MDE proposes the use of Domain Specific Languages (DSL) [BAGaB11]. By means of DSLs, can be adopted suitable notations for different system’s purposes. Another of the key ideas of the MDE approach is that most of the transformations between models can be described, and (partially) automated, thanks to transformation languages. The concept of transformation as a cornerstone of the MDE is depicted by the unary association IsTransformedIn in Figure 7.1. In the context of this work, source 126
7. M ODEL D RIVEN A PPROACH
FOR
BPMN V ERIFICATION
AND
M EASUREMENT
7.2. Process Modeling in Model Driven Engineering
process models can be transformed into target models, either graphical or textual (e.g. XML dialect serialization) that implement another perspective or functionality [PRP08] of a business process. The unary association DecomposedIn embodies the ability of a process to be composed of elements with less complexity, or be the composition of elementary constructs. Some of the most widely-known MDE instantiations are the OMG’s Model Driven Architecture (MDA)1 initiative and the Eclipse2 set of modeling and programming languages.
7.2.1
BPMN in the context of MDA
The MDA standard was seminal in the realization of MDE. MDA is based on the use of abstract representations called models. Raising the level of abstraction from code production to models is a core idea of MDA. The notion of platform played also an important role in MDA through the building of models independent from platforms. Another important characteristic of MDA is the use of metamodels and metamodeling techniques as a mean both to describe languages and to structure artifacts. The MDA faced challenges common to the industrial standards adopted by large communities. The incremental definition, reflecting the consensus achieved among contributors, affected MDA overall quality when compared with well grounded techniques such as formal specifications [Fav04]. One of the issues pointed out to MDA standard is that there is no clear separation between essential concepts and the technologies that implement these concepts [Fav05]. Explicit metamodels are a prerequisite in MDA, given its emphasis on automation. The model concept has a more restrictive definition in the realm of MDA, than the one given in MDE. Here, the concept of model is strongly connected to the notion of metamodel. In MDA a metamodel is a model that defines the language for expressing other models [OMG03b]. According to the MDA standard all metamodels must be written in the Meta Object Facility (MOF) language to be MDA compliant. Therefore, MOF is a key instrument for MDA. MOF ensures that all compliant metamodels share a common set of core assumptions and definitions. MDA models are related since they all are mapped upon the constructs of the MOF abstract meta-metamodel. Every model or metamodel used in MDA, is directly or indirectly defined in terms of MOF constructs, being therefore considered as MOF compliant (see Figure 7.3). This ensures that the concepts of all models used in MDA are able to be transformed in their equivalents in every other MOF-compliant model. MOF borrows a tiny subset of UML’s large set of constructs for the purpose of modeling a language. The OMG has produced MOF models for a number of languages. Examples of MOF-compliant metamodels, are the 1 2
http://www.omg.org/mda/ http://www.eclipse.org/
127
7. M ODEL D RIVEN A PPROACH
FOR
BPMN V ERIFICATION
AND
M EASUREMENT
7.2. Process Modeling in Model
Driven Engineering
OMG’s Common Warehouse Common Warehouse Metamodel (CWM) [OMG03a], Semantics of Business Vocabulary and business Rules (SBVR) [OMG12a], Ontology Definition Metamodel (ODM) [OMG09], and also BPMN [OMG11]. Another MOF-compliant concept is the UML Profile. Profiles are extensions supported by UML, used to describe various functional uses of UML. Being extensions of UML, profiles are also considered as MOF metamodels. Since, the BPMN metamodel is defined in the MOF language, BPMN language is MDA compliant. Similarly, all the diagrams included in BPMN (e.g. conversation, choreography or orchestration diagrams) are amenable to be transformed in other MOF-compliant languages. Even languages that are not based on UML can still be MDA languages if they satisfy the MDA requirement, which is to have a MOF model of the language itself. MOF allows managing models in an integrated manner, even when the models are expressed in a disparate language. Therefore, MOF presents an approach to metadata integration more effective than the efforts based on only one modeling language [Fra03]. MDA’s perspective regarding processes is based on two principles: (1) the emphasis on models; and (2) the transformation of process models with metamodels’ mappings. By following these principles what is attained are processes’ representations where the domain logic specification is separated from the platform specific details in which processes are implemented. The emphasis on models is achieved by layering models processes’ developed according to three levels of abstraction: the Computation Independent Model (CIM), the Platform Independent Model (PIM), and the Platform Specific Model (PSM) (see Figure 7.2). Mappings among models are necessary to move between levels of abstraction and within the same level of abstraction. This can be operationalized through upward or downward navigations between metamodels. For instance, if we want to transform a PSM model into another PSM model, we can move using mappings from the source PSM model to a common metamodel and then to the target PSM model. MDA primary focus is on the development and maintenance of software artifacts. MDA also describes how models are used in the software development process, from the highest level development model in CIM to the platform oriented PSM [Har04]. CIM models (e.g. Use Cases) are used to describe the problem. PSM models (e.g. Class or Sequence Diagram incorporating specifications of implementation environments such as J2EE or .NET) describe the solution. We can draw a parallel between the life cycles of software development and business processes to figure out how the latter can be driven by MDA. Business managers and process analysts demand more business oriented artifacts than the ones used by software developers. Therefore, this perspective should be provided through a more business familiar view of process models, built using a process modeling language such as the BPMN. With BPMN the actual business processes realized in the organization, can be elicited through diagrams with details according to the different levels of abstraction. In 128
7. M ODEL D RIVEN A PPROACH
FOR
BPMN V ERIFICATION
AND
M EASUREMENT
7.2. Process Modeling in Model Driven Engineering
Figure 7.2: BPMN diagrams in MDA levels of abstraction
fact, BPMN has some advantages for business processes modeling elicitation according to the MDA, when compared to the UML, namely the usage of the same notation for CIM, PIM, or PSM modeling. The difference among the BPMN models at the different levels of abstraction, resides on the level of detail adjusted to the intended usage. CIM models are BPMN diagrams developed by domain analysts mainly for documentation purposes and to provide a broad knowledge of the business processes’ domain. CIM just describes concepts related to the particular domain, with no reference to the particular problem to be solved in that domain. BPMN public processes are used at CIM level since they are usually modeled to show only the relevant flow elements of the collaboration made with external entities. Therefore, since the internal details of processes are omitted from the model they are used essentially for documentation purposes [BPM11, page 147]. On the other hand, through PIM models, architects and designers incorporate details of business processes beyond the happy path, such as exceptions flows, events, and compensations, but in a technology independent manner. PIM models are more precise and can be used as specification of a business process. What they say about the business process is expected to be true, although they describe only some aspects of it. The definition of PIMs is made once and does not need to be made for all technologies, which allows designs portability and interoperability of processes to be defined at model level. Conversely to CIM, where process models were merely a process design artifact, intended to help human process managers design and understand processes, at PIM level the process models must be sufficiently formal and detailed for being used as a runtime artifact that could fuel up applications such as simulators and process tuners. 129
7. M ODEL D RIVEN A PPROACH
FOR
BPMN V ERIFICATION
AND
M EASUREMENT
7.2. Process Modeling in Model
Driven Engineering
Finally, PSM models embody the details required by each particular deployment platform and are specific of each BPMS. Thus, PSM models must be rigorously formalized and must contain enough information to be directly interpreted by BPMS engines or allow the derivation of executable processes in a language such as BPEL or web services. Mappings between specific PSM models and other programming languages depend on the availability of profiles that rigorously specify how a given process model should be transformed [OMG13, MB02]. Various types of mappings between the different levels of abstraction are possible (see Figure 7.2), namely via XMI or MOF. In the context of collaborative business process management, MDA standards play the role of integration and allow different organizations to cooperate from a business process point of view [PRP08]. MDA is also relevant for business processes considering the deployment platform. Business processes are deployed and automated through BPMS, on top of software components providing process model compilers, interpreters, debuggers, and so forth. Changes in business processes have impacts on software components. So, business processes’ effectiveness and efficiency heavily rely on the software system’s suitability to keep in sync with domain requirements, which is, ultimately, the aim of MDA. Tracing models from CIM to PSM process models became more simple than using UML disparate sorts of diagrams. MDA allows transformation, via MOF, of BPMN diagrams to their equivalent diagrams in other languages or notations. However, though understandable and intuitive, the notions of platform, PIM and PSM are not clearly defined in the MDA standard, and therefore they are subject to some controversy. Albeit there is a continuum between PIMs and PSMs, the distinction between these models is not clear-cut [Fav05]. As it happens in the case of Software Engineering, process modeling in the context of MDA also requires mathematically-sound methods that enable stepwise refinement from process models to executable processes. Moreover, the validity of the transformation should be demonstrated at each step. The transformation among models, written for instance in a MOF-compliant language (e.g. Query/View/Transformation (QVT)), is also intrinsic to the MDA paradigm. Model’s transformations are performed based on metamodels’ mapping and the generic transformation architecture depicted in Figure 7.3. For instance, suppose is required a transformation from an UML activity diagram (source model) to a BPMN process diagram (target model). Starting first from the UML activity diagram, a match between equivalent concepts should be found at MOF compliant metamodels, between UML (source metamodel) and BPMN (target metamodel). Lastly, after the identification of the mappings among equivalent constructs in both metamodels, i.e. for the initial concepts of UML activity diagram matching the related BPMN graphical constructs, one should be able to set up the transformation. The BPMN standard has a metamodel that contains the syntactical definition of the language’s constructs, as well as the logical relationships among these constructs (Figure 3.4). The graphical notation (Figures 3.2 and 3.3), supported by BPMN tools, defines the 130
7. M ODEL D RIVEN A PPROACH
FOR
BPMN V ERIFICATION
AND
M EASUREMENT
7.2. Process Modeling in Model Driven Engineering
Figure 7.3: MDA transformation architecture
visual representation of process models, making them more suitable for human reading and understanding [Fra03]. The output of modeling can be serializable and saved in XML like format (XMI/XPDL). The exchanging of process models and their diagrams can be done through the standardized exchange formats, which enables the transference of models created in specific BPMN tools to other BPMN tools or software languages [Lon04]. Since XPDL is based on BPMN, its metamodel is close to the BPMN’s meta-model. Some elements are added in XPDL to facilitate implementation [Gao06]. In XPDL a package corresponds to the BPMN Business Process Diagram, and consists of a set of processes’ definitions. A process definition has several activities. Activities are related to each other through transition information. The participant declaration provides the resources to perform activities, while the application declaration describes IT applications invoked in the system. The relevant data field defines the data that is created and used within each process instance during process execution. The graphical notation, as well as the serial representation, are tightly related to the BPMN metamodel, and must conform with it. The BPMN standard as a process modeling language is the key for attaining business process modeling’s goals, as well as achieving process models’ platform independence. Platform independence is exactly one of the principles advocated by the MDA framework [PRP08]. The BPMN standard follows the MDA approach, since it is based on a MOF compliant metamodel which allows transformations’ definition for process models defined in the language’s notation. The quality of process models developed at each layer of the MDA pyramid, must conform to the requirements of the adjacent layer. Therefore, the transformation of process models from PIM to the PSM or from PSM to specific BPMS, should ensure the process models’ compliance with predefined internal and external attributes. The tools we presented in chapters 5 and 6 intended to contribute for attaining these objectives. 131
7. M ODEL D RIVEN A PPROACH
FOR
BPMN V ERIFICATION
AND
M EASUREMENT
7.2. Process Modeling in Model
Driven Engineering
7.2.2
Model-based Testing of BPMN Models
In chapter 5 we formalized BPMN well-formedness rules, to ensure the soundness of our proposal. The previous section allows us to position BPMN process modeling artifacts in MDA. In this section we still follow a model-driven approach by characterizing a modelbased testing for BPMN. Here, we intend to define the principles to set up the tests that will be conducted in section 7.3. This is the basis to empirically validate the effectiveness of our proposal in chapters 8 and 9. Before presenting the BPMN model-based testing framework for verifying the BPMN well-formedness rules (see Figure 7.4), we introduce some terminology concerning testing in the context of BPMN process modeling, as well as some aspects regarding data collection of faults in samples of BPMN models. Most of the concepts used were adapted from the realm of software testing [BDG+ 08]. One of the purposes of process modeling testing in the context of this dissertation is to detect BPMN models’ failures so that data collected can be statistically processed. Testing is seen here as a mean for comparing the compliance of a BPMN model with specific wellformedness rules prescribed by an oracle – the BPMN specification standard [BPM11]. Process models’ faults occur, for instance, when a process modeler, using BPMN constructs, violate well-formedness rules. This results in a defect in the process model representation. If the process model’s defect is present when an actual business process is executed by a BPMS, wrong results could be generated, causing failures or inconsistencies in the business process. In the context of BPMN process modeling, a test suite is a collection of test cases that are intended to be used to test process models and show whether they comply with a specified set of well-formedness rules. The test suite defines goals for the collection of test cases and embodies information regarding the testing environment configuration to be used during tests. The testing environment is a setup of software applications on which the process tester is going to perform the testing of process models. In this work BPMN models are submitted to what can be called as static testing. Static testing is a kind of testing, by which process models do not actually run business processes. In static testing process models are analyzed by an interpreter that asserts the process models’ correctness. Static testing can be made before the process model is in use or even before the model is fully designed, in order to verify particular parts of the model (e.g. subprocesses). Bugs that are eventually discovered at this preliminary stage of business process design are less expensive to fix than the ones discovered at later stages (e.g. deployment). The tests conducted on BPMN models, since they are model-based testing, can also be considered black-box testing. The process modelers (process analysts or process implementers) test process models by examining their compliance with BPMN specification and disregarding any knowledge about how well-formedness rules were actually implemented. This testing method can be applied to different levels of detail of process models: 132
7. M ODEL D RIVEN A PPROACH
FOR
BPMN V ERIFICATION
AND
M EASUREMENT
7.2. Process Modeling in Model Driven Engineering
subprocesses, the overall business process, or collaboration among processes. The BPMN model-based testing framework presented in Figure 7.4 can be seen as another incarnation of model-driven engineering [UL06]. This testing approach will be instantiated in the next section through the design and execution of a set of test cases against an enhanced version of the BPMN metamodel – the System Under Test (SUT).
Figure 7.4: A framework for BPMN model-based testing Model-based testing is used here for comparing the SUT with specifications. The BPMN standard document [BPM11] is the specification of the SUT. The standard document provides information to build the necessary test cases for detection of faults in the implementation of BPMN well-formedness rules. There is traceability between each test case and the correspondent rule specification. In BPMN model-based testing framework, we distinguish between abstract test suites, which are collections of test cases derived from the BPMN metamodel – the system under test – and executable test suites, which are derived from abstract test suites by providing lower-level details needed for a test case to be executed by an interpreter of BPMN models’ instances. The abstract test suite cannot be directly used because it remains at a high level of abstraction and lacks details about the execution environment. The abstract test suite, which is composed by BPMN models describing the SUT requirements, depicts only a portion of the SUT’s desired behavior. Each abstract test case behaves as a functional test on the same level of abstraction of a regular BPMN model. Since the abstract test suite is also at a different abstraction level of the SUT, the executable test suite needs to be derived from the abstract test suite. The transformation from the abstract test cases to concrete test cases provides the essential information for the execution of the latter in the testing environment. The executable test suite can then run against a representation of the system under test for checking whether well-formedness rules stated in the specification are well implemented. 133
7. M ODEL D RIVEN A PPROACH
FOR
BPMN V ERIFICATION
AND
M EASUREMENT
7.3. Instantiation for BPMN
Verification and Measurement
Setting up the framework for testing the SUT establishes also the foundations for the testbed environment to be used on the verification soundness of hypotheses regarding BPMN models’ quality characteristics made in chapter 6. This will be done through the empirical validation of the hypotheses using a sample of BPMN models as test scenario. By creating the mentioned model-based testing framework, we intended to avoid an informal testing approach based on ad hoc tests. Instead, our aim was to automate tests as much as possible, however without giving up the human intervention to monitor and analyze produced errors. Regression tests through the process were also essential to be considered. The aim was to ensure that previous well-formedness rules implemented did not suffer collateral effects from the updates in the metamodel due to new ones implemented and tested.
7.3
Instantiation for BPMN Verification and Measurement
In the present section, we use BPMN at different levels of abstraction of MDE, from the metamodel layer (M2) to the instance layer (M0). We address BPMN models’ specification at each abstraction level, as well as the transformation between layers. The work described in this section contributes to the verification of well-formedness rules of BPMN language formulated in chapter 5, as well as for collecting data for empirical validation of BPMN models conformance with those rules to be used in chapter 8. This section also contributes for the validation of BPMN measures proposed in chapter 6 and empirically validated in chapter 9. The overall process, which will be detailed in the following sections, consists in several steps. The BPMN metamodel was firstly imported and converted from a XMI representation to a script in the concrete syntax of a tool checker. The BPMN models produced by BPMN design tool were transformed also into the concrete syntax of the tool checker. While the script was interpreted by the tool, instances of BPMN models were validated. Hence, the approach transforms BPMN models to the concrete syntax of a BPMN model checker for BPMN well-formedness rules verification and BPMN models measurement. These steps occur at early stages of the design process with BPMN models expressed at PIM level. A BPMN model that positively passes the checking process means that it is accurately expressed in the BPMN language. Since the models are at a high level of abstraction, this approach contributes also for bridging the gap within the BPMN community between domain analysts, who work with processes at a domain level (CIM), and process implementers, who analyze the same process at a technical and implementation level (PIM). 134
7. M ODEL D RIVEN A PPROACH
FOR
BPMN V ERIFICATION
AND
M EASUREMENT
7.3. Instantiation for BPMN Verification and Measurement
7.3.1
BPMN Models’ Verification and Measurement
The OMG BPMN metamodel describes the abstract syntax of the BPMN language by means of meta-classes, meta-associations and cardinality constraints. We started by checking BPMN model syntax by instantiating the BPMN metamodel in the USE validation environment [GBR07]. This tool allows checking whether a set of objects and their links match the corresponding model structural constraints, namely regarding cardinality and type conformance, as well as OCL invariants concerning BPMN well-formedness rules. To operationalize the aforementioned objective, we developed the M2/M1 transformations depicted in the process model of Figure 7.7: • from the BPMN metamodel (available in XMI format in the OMG site) to the USE abstract syntax. This transformation consists in importing the XMI file into a CASE tool (Enterprise Architect) repository and then, using the Java API of the CASE tool, generating a file with the BPMN metamodel in the human-readable textual format of USE abstract syntax. The same Java API of the CASE tool was used for building the EA2USE transformation (M1/M0) (Figure 7.5). The EA2USE is aimed to convert to USE concrete syntax: (1) BPMN models snippets for testing well-formedness rules, as well as (2) the BPMN models produced by surrogates of process modelers for the quasiexperiment described in section 8.5. The USE concrete syntax is a set of commands to instantiate a process model in the USE environment, ensuring its conformance to a previously loaded metamodel. • converting the XMI file into an Ecore BPMN metamodel, for creating an Ecore USE metamodel, and Ecore XPDL metamodel. The Ecore metamodels were expressed using the semantics of the Ecore metametamodel. Using the two Ecore metamodels was built an ATL [Ecl11] transformation (XPDL2USE in Figure 7.6). The XPDL2USE transformation (M1/M0) aimed to convert BPMN process models collected from open repositories, conform the XPDL metamodel, into the equivalent USE concrete syntax . The details of those process models, serialized in XPDL files and transformed for the USE environment are described in section 8.4. These transformations had to match USE language conventions, thus requiring some minor changes in meta-association names such as appending as suffix an underscore plus the alphabetic character a to identifiers which are reserved keywords in USE (e.g., operations, from), or an underscore plus an alphabetic character (a, b, or c) to the target/source to the role identifiers of associations between the same meta-classes. After having been accomplished the BPMN metamodel transformation to the USE abstract syntax, the file with the transformed metamodel could be loaded by the USE environment. Figure 7.9 shows the USE tool loaded with the 151 meta-classes and 200 meta-associations (see the Log window) of BPMN. The Class diagram window shows a cluttered snapshot of the corresponding class diagram.
135
7. M ODEL D RIVEN A PPROACH
FOR
BPMN V ERIFICATION
AND
M EASUREMENT
Verification and Measurement
Figure 7.5: The EA2USE transformation tool
Figure 7.6: The XPDL2USE transformation
136
7.3. Instantiation for BPMN
FOR
Figure 7.7: Building BPMN syntax validator through: Lane 1 – the transformation of the BPMN metamodel into the USE abstract syntax and the construction of EA2USE transformation; and Lane 2 – the construction of XPDL2USE transformation
7. M ODEL D RIVEN A PPROACH BPMN V ERIFICATION AND
137
M EASUREMENT 7.3. Instantiation for BPMN
Verification and Measurement
7. M ODEL D RIVEN A PPROACH
FOR
BPMN V ERIFICATION
AND
M EASUREMENT
7.3. Instantiation for BPMN
Figure 7.8: Building and verifying BPMN models snippets for BPMN well-formedness rules derivation
Verification and Measurement
138
7. M ODEL D RIVEN A PPROACH
FOR
BPMN V ERIFICATION
AND
M EASUREMENT
7.3. Instantiation for BPMN Verification and Measurement
Figure 7.9: The USE environment loaded with BPMN metamodel and the BPMN diagram presented in Figure 7.10
Figure 7.10: A BPMN simple diagram of a transactional sub-process Subsequently, BPMN models snippets were built with the mentioned CASE tool. The depicted elements’ definitions were exported through EA2USE transformation used to get the BPMN models instances definitions equivalent in the USE concrete syntax (see lanes of participants Enterprise Architect and EA2USE in Figure 7.8). We were then able to instantiate the BPMN metamodel with BPMN models instances, as it can be ascertained in the Object diagram window in Figure 7.9 where one can see a cluttered snapshot of the meta-object diagram corresponding to the BPMN model extract in Figure 7.10. The Command list window shows the commands issued to create the instances of meta-classes and meta-associations, as well as to set their state. Object count and Link count windows display the number of instances of meta-objects and meta-links 139
7. M ODEL D RIVEN A PPROACH
FOR
BPMN V ERIFICATION
AND
M EASUREMENT
7.3. Instantiation for BPMN
Verification and Measurement
created, by type. By this time, were caught syntactical errors by the USE tool. Examples of such type of errors include among others, typeless instances and connections among elements not allowed in the metamodel, such as a DataInputAssociation linking two instances of Task, an instance of MessageFlow linking an instance of Gateway to an instance of Task. The next step was to instantiate the framework for BPMN model-based testing (see Figure 7.4 in section 7.2.2). Building this environment allow us to validate BPMN process models through a BPMN metamodel enriched by the addition of well-formedness rules as OCL invariants, corresponding to the informally conveyed rules throughout the OMG specification, complemented with best practices from the field. In Figure 7.8 we depicted the overall process model with the activities taking place to enhance the BPMN with the mentioned rules. The JUSE-JUnit lane refers the role of a Java facade3 for the USE tool used for rules testing and debugging. After each rule was codified, added to the BPMN metamodel and syntactically validated (lanes Researcher and USE), a BPMN model snippet (test case) was build (lanes Enterprise Architect and EA2USE) for checking the correctness of the rule. We elicited 133 invariants (Appendix E) and implemented 610 operations, resulting in a total of 743 OCL expressions classified as follows: • Flow Control Well-formedness Rules: rules related with the interaction among modeling elements; • Data Flow Well-formedness Rules: rules related with sharing of data by activities; • Best-Practices Recommendations: optional rules related with advised usage of BPMN elements in diagrams. The Class invariants window in Figure 7.9 shows the results of the model check performed upon the BPMN model of Figure 7.10. One can also see that was broken at least one well-formedness rule (denoted by the boolean value false). By querying the broken rule we can understand its semantics: a throwing compensate event is not allowed in a transitional sub-process.
7.3.2
Data Collection for Empirical Validation
An empirical study was conducted to determine the BPMN models’ external attribute of correctness (conformance of BPMN models with the BPMN specification), as well as the measurement of BPMN models’ internal attributes (depicted in Figure 6.2). The sample used (see details in section 8.4), was based upon available BPMN models stored in public repositories managed by two BPMN tool providers: • BizAgi4,5 - a Business Process Management solution provider, positioned in the 2010 Gartner’s BPMS Magic Quadrant [HCKP09], which made available on-line 19 customizable templates of business process models; 3
http://code.google.com/p/j-use/ http://www.bizagi.com/ 5 BizAgi is one of the copyright holders of the BPMN 2.0 standard. 4
140
7. M ODEL D RIVEN A PPROACH
FOR
BPMN V ERIFICATION
AND
M EASUREMENT
7.3. Instantiation for BPMN Verification and Measurement
• Trisotech6 - a provider of consulting services and BPM solutions, which runs an on-line resource repository, the Business Process Incubator, with almost 50 BPMN business process models collected from several sources. Figure 7.11 depicts the activities of data collection that took place for the empirical study analysis. Those activities are briefly described below: • Each of the business process models was downloaded from the respective site: (1) BizAgi models were in a proprietary format used by the tool (BizAgi Process Modeler v.2.3) of the repository owner; (2) business process models from Business Process Incubator were in Visio format. These models were converted to BizAgi format since BizAgi Process Modeler can import Visio files and save them in BizAgi own format; • After having all the files in BizAgi format, it was possible to convert them, using a functionality available in the BizAgi tool, to XPDL 2.2 format7 , a standard from WfMC, which allows the serialization of business process models and the exchange of process definitions; • Having business process models samples serialized into XPDL format, in order to make their verification for possible standard or best-practices violations, we converted the XPDL concrete syntax to USE concrete syntax, using the transformation tool XPDL2USE (Figure 7.6). • The business process models now expressed in the USE concrete syntax are verified against syntactic and well-formedness rules present in the BPMN metamodel read into the USE tool. Any syntactic or well-formedness violations were output to a file. • Measure observations of the BPMN process instances were collected from the output to a file produced by the USE tool checker, which executed OCL operations for computing the measure’s instances; • At the end of the BPMN models’ verification, the statistics were consolidated into a file that was imported by the IBM-SPSS statistical tool for data analysis. A second empirical study (detailed in section 8.5) was conducted through a quasiexperiment to evaluate the effectiveness of using automatic BPMN rule checking for assessing the correctness of BPMN process models. The process model of this empirical study follows closely the one depicted in Figure 7.11, with some minor differences such as: (1) the BPMN models were built by process surrogates using the CASE tool; (2) the transformation tool used was the EA2USE; and (3) measures observations were not collected in this case.
6 7
http://www.businessprocessincubator.com/ http://www.xpdl.org/
141
7. M ODEL D RIVEN A PPROACH
FOR
BPMN V ERIFICATION
AND
M EASUREMENT
7.3. Instantiation for BPMN
Figure 7.11: Data Collection of BPMN process models for empirical validation
Verification and Measurement
142
7. M ODEL D RIVEN A PPROACH
7.4
FOR
BPMN V ERIFICATION
AND
M EASUREMENT
7.4. Conclusion
Conclusion
Within the MDE paradigm, every concept must be explicitly modeled. BPMN models represent business requirements, and they must be correctly expressed. The transformation of BPMN models for development and implementation on a BPMS, should be made after ensuring that BPMN models are correct. BPMN models can have its attributes quantified through measures. This allows the measurement of process models independently of business processes’ deployment platform. Platform independence is another principle on which MDE is based. Another important concept in MDE is model transformations. A process model can be transformed to another process model or to a XML dialect as well as to an executable process. This chapter introduced the main concepts regarding MDE, brings BPMN to the context of MDE, and presents a framework for BPMN model-based testing (section 7.2). The MDE approach was instantiated in section 7.3 by BPMN well-formedness rules implementation, and data collection for the empirical validation to be presented in chapters 8 and 9.
143
[This page is intentionally blank]
8 Empirical Studies on BPMN Verification
"In so far as such a theory is empirically correct it will also tell us what empirical facts it should be possible to observe in a given set of circumstances." – Talcott Parsons
Contents 8.1
Introduction . . . . . . . . . . . . . . . . . . . . . . . . . . . . . . . . . . . 146
8.2
Choosing the Research Method . . . . . . . . . . . . . . . . . . . . . . . 147
8.3
Empirical Studies’ Definition . . . . . . . . . . . . . . . . . . . . . . . . . 151
8.4
First Empirical Study . . . . . . . . . . . . . . . . . . . . . . . . . . . . . 154
8.5
Second Empirical Study . . . . . . . . . . . . . . . . . . . . . . . . . . . . 183
8.6
Conclusion . . . . . . . . . . . . . . . . . . . . . . . . . . . . . . . . . . . 198
Context: The current version of the BPMN standard has rules that are difficult to follow and enforce, which makes difficult to build BPMN models without the appropriate support of verification tools. Objective: To empirically validate BPMN well-formedness rules, previously formalized, in order to assess whether these rules could have a significant impact upon the quality of BPMN models. Method: Empirical studies are conducted using a specific framework, conform to the scientific method. Results: Our approach unveiled a more effective BPMN models’ verification than checking models through regular BPMN modelers or actual BPMN tools. 145
8. E MPIRICAL S TUDIES
ON
BPMN V ERIFICATION
8.1. Introduction
Limitations: The samples used in the experiments were collected from examples hosted in open repositories, as well as BPMN models built by students, as surrogates of professional BPMN process modelers. Conclusion: More research is needed in order to corroborate the outcomes of the experiments. So, the replication of the studies in industry should be the next step to ensure the generalization of results.
8.1
Introduction
One would expect of BPMN modelers regardless of their technical background, either process analysts or process implementers (section 2.5.2.1), could be able to produce correct process models using currently available tools. The BPMN 2.0 standard is based in a metamodel with large number of meta-classes (section 3.3) and several different kinds of graphical elements and stereotypes (Figures 3.2 and 3.3), constrained by more than a hundred well-formedness rules. Harnessing all the potential and expressiveness of the BPMN standard made available by such a plethora of elements, and building correct BPMN models, does not seem to be an easy task. On one hand, process analysts use the language for purposes such as a documentation or process improvement and have to deal with the subtleties of exception and parallel paths, as well as the multiple kinds of interrupting and non-interrupting events. On the other hand, process implementers, besides having to deal with previous challenges, need also to face the complexity of the language when detailing and tuning process models for enactment upon a BPMS engine. Thus, both roles have to ensure that resulting process models are syntactically correct and well-formed. One would expect that a means to enforce the verification of compliance with well-formedness rules, such as the formalization made in chapter 5, would have a great impact upon the final quality of process models. In section 8.2 we discuss some of the research methods available for a grounded research, as well as the motivation for our choice upon the scientific method. Next, we describe two empirical studies that validate the work done regarding BPMN models’ verification (sections 8.4 and 8.5). The empirical studies’ structure follows closely the guidelines for reporting experiments proposed in [JP05]. The inception of the empirical studies is made from a common basis (section 8.3). Thenceforth, each step of the empirical studies is reported separately in its own section, for the sake of clarity and focus. The experimental design is described (sections 8.4.1 and 8.5.1), namely regarding the goals and hypotheses tested. After the studies’ execution (sections 8.4.2 and 8.5.2) the results are presented (sections 8.4.3 and 8.5.3) and interpreted (sections 8.4.4 and 8.5.4). Finally, conclusions are drawn in section 8.6. 146
8. E MPIRICAL S TUDIES
8.2
ON
BPMN V ERIFICATION
8.2. Choosing the Research Method
Choosing the Research Method
The process of making Science requires activities such as collecting and analyzing data, interpreting the results, and eventually returning back the findings to the community. This process should be replicable by other researchers acting under the same conditions. The selection of the research method is crucial for drawing conclusions about a phenomenon. The research method determines the resources needed for the study, as well as the perspective of analysis of the factors and causes that shape the phenomenon. To conduct science ethically, the researcher has to reveal the followed research approach, and consequently the aim, theory, and method that drives the research from its inception to the results’ communication. Several research approaches have been used in the realm of Computer Science, Software Engineering and Information Systems. We will characterize three of the most recurrent ones (action research, design method, and scientific method) in next section, to help setting the context for justifying the selected research approach.
8.2.1 8.2.1.1
Presenting Research Methods Action research
Action research is an iterative research process joining researchers and practitioners, acting together on a particular cycle of activities, including problem diagnosis, action intervention, and reflective learning [ALMN99]. Action research combines theory and practice through change and reflection in an immediate problematic situation within a mutually acceptable framework. When following this approach, researchers are encouraged to experiment through intervention and to reflect on the effects of their intervention and the implication of their theories [SLT09]. Action research methods can be used in application domains where research takes place in actual organizations. Disciplines from the realm of applied science (e.g. Business Processes Management, Software Engineering and Systems Science) use this approach since it can address complex real-life problems for which practitioners seek immediate solutions. In action research, the researcher seeks a theory in collaboration with practitioners in real situations, gains feedback from the experience, modifies the theory as a result of feedback attained, and tries it again. Each iteration of the action research process is expected to corroborate (or refute) the theory. In our research work the aim is to enforce the quality of BPMN models. So, we formalized in chapter 5, a set of BPMN well-formedness rules. As consequence were defined prescriptive rules in the BPMN standard. We want now, a posteriori, using wellformedness model checking and without intervening in the modeling process, to assess the quality of BPMN models built by process modelers. To attain this goal, the action research study is not the more adequate research method. Action research only is justifiable if we 147
8. E MPIRICAL S TUDIES
ON
BPMN V ERIFICATION
8.2. Choosing the Research Method
wanted to assess how process modelers are using BPMN language for process modeling in organizations, being direct part in the study, which is not the case. 8.2.1.2
Design method
The Design method approach, according to Herbert Simon [Sim96], is concerned with how things ought to be. Design demands skills and competences besides the ones derived from scientific knowledge. Other relevant skills come from craft knowledge, such as apprenticeship, experience, as well as trial and error. This mix of valences is necessary to design solutions compliant with the organizational contexts and accepted as effective by practitioners [CNW81]. So, design is viewed more as a technological, rather than a scientific activity. In design methods, tacit knowledge seems to be the foundation for producing objects fitting appropriately the users’ context. Historically, design has arisen from craft and embodies the know-how. The artifacts do not exist exclusively grounded upon theory. Not rarely an artifact’s invention precedes the underlying theory. Applying blindly procedures can hinder creativity that enables reaching the subtlety of a well-designed artifact. It is more suitable to regard design as a technology, since design involves the application of types of knowledge other than the one that could be formally expressed. Design method’s activities target the invention of things of value that do not yet exist, which makes it constructive by nature. The kind of activities which take place when doing the design method, are clearly very dissimilar from the activities that we must follow in our research work, more in line with the scientific method, as we will see in the next section. 8.2.1.3
Scientific Method
For the Oxford English Dictionary1 the scientific method consists . . . in systematic observation, measurement, and experiment, and the formulation, testing, and modification of hypotheses. The scientific method has evolved to ensure that researchers make discoveries grounded upon logic and reason [Jar01]. It relies upon a standard protocol followed by researchers, when conducting scientific research, for benchmarking and measurement of the validity of the results obtained. By following the set of procedures, researchers seek and document relationships among variables (e.g. merely associations, cause and effect relations). This means that, they raise the evidence (at some level of confidence) about the nature of relationships, among independent and dependent variables. The procedures of the scientific method are targeted at finding out the nature of the phenomena of study. Findings are fed back into the theory that tries to explain the world. Due to the difficulty on attaining reliability and validity of experiments carried out, different disciplines follow the scientific method with different adjustments. Nevertheless, they all perform generically the activities described below [Shu09]. 1
http://oxforddictionaries.com/
148
8. E MPIRICAL S TUDIES
ON
BPMN V ERIFICATION
8.2. Choosing the Research Method
1. Research Problem Identification – after the formulation of the general question about research domain, it proceeds with the observations and measurements regarding the phenomena, collecting and organizing empirical facts. General questions are made, narrowing down the focus to a particular aspect which could facilitate the formulation of realistic hypotheses concerning the phenomena. 2. Hypotheses Formulation – an activity supported by the inductive reasoning which allows researchers to come up with general principles and the elicitation of hypotheses with properties of testability and falsifiability [Pop35]. 3. Experimental Design – consists in making predictions, using deductive reasoning, about how things should behave, as well as in developing a procedure for reliable experiments. The experiments should be designed with statistical tests in mind, by making sure that they have appropriate controls and a sufficiently large sample to provide statistically valid results. The design of experiments establishes the steps that will test and evaluate the hypotheses, manipulating one or more variables to generate analyzable data. Furthermore, data and observations must be recorded in order that the experiments could be replicated. The exact replication and verification of the experiment by independent researchers ensures the reliability of the results. 4. Hypotheses Testing – is the use of statistics to determine the probability that a given hypothesis is true. The usual process of hypothesis testing consists of: (1) formulating the null hypothesis and the alternative hypothesis; (2) identification a statistic test to assess the truth of the null hypothesis; (3) computing the significance of the statistic test; (4) deciding for the acceptance or rejection of the null hypothesis. 5. Interpretation and Conclusions – the researchers provide interpretation of the results and, through deductive reasoning, perform conclusions about their experiments. In light of the information gathered during the experiments, evidence is obtained about the truth or falseness of the original hypothesis. If truth, the hypothesis is not rejected and remains as a possible explanation of phenomena allowing the generalization of the findings. If not, researchers reject the hypothesis and try to come up with alternative, i. e., refined hypotheses, for the phenomena’s explanations. Whether a researcher’s initial hypothesis is right or wrong isn’t as important as whether he sets up well-designed, repeatable experiments that provide necessary information to contribute to the advance of scientific knowledge. 6. Results Communication – consists in sharing the results with the peers and scientific community in general through the appropriate forums and journals allowing other researchers the replication of the findings and future development of the research. A rule of thumb for any researcher is that true research can never give a definitive answer about a phenomenon, since even the most well-known and basic principle is always subject to falsification. The empirical work, addressed by this chapter, is concerned with assessing the effectiveness of BPMN model’s verification. An enhanced method is intended to be achieved 149
8. E MPIRICAL S TUDIES
ON
BPMN V ERIFICATION
8.2. Choosing the Research Method
by adding a set of formalized well-formedness rules to the BPMN metamodel. We adopted, as research approach, the scientific method for assessing the improvements that one can achieve by using BPMN models’ verification with an enhanced version of the BPMN metamodel.
8.2.2
Scientific Method’s Instantiation for BPMN Experiments
To customize the scientific method to the context of BPMN empirical studies, we follow in the next sections the BPMN Empirical Study framework, which was inspired in experiment conduction and reporting guidelines frameworks [KPP+ 02, JP05, Ga08] used in the Experimental Software Engineering field. The activities carried out during the life cycle of an empirical study of BPMN models are depicted in Figure 8.1 and described next:
Figure 8.1: The BPMN empirical study framework 1. Definition – in this activity the addressed research problem is stated alongside with the formulation of the research questions concerning expected results on BPMN models verification, the objectives of the experiments, as well as the context in which the experiments will be carried out (section 8.3). 2. Planning – this set of activities is about how the experiments will be performed, which involves a more detailed decisions concerning the context of the experiments. The formulation of a set of hypotheses under study is the basis for the experiments’ design, in order to answer the initial research questions. We have also to make the elicitation of the set of independent and dependent variables that will be used in the statistical tests, and the selection of subjects to participate in our experiments. The quantitative experiments are designed to filter out external factors, and to avoid bias in the results. The experiments’ instrumentation, as well as a previous evaluation of their validity conclude the phase (sections 8.4.1 and 8.5.1). 3. Execution – consists in the instantiation of the previously established plan constrained to the specific circumstances found in the actual experiments. In this phase data is collected to gather empirical evidence (sections 8.4.2 and 8.5.2). 4. Data Analysis – the activities involved herein are the data set description and reduction, as well as the hypotheses’ testing of the ones defined during each experiment plan (sections 8.4.3 and 8.5.3). 5. Results – since the overall research is constructed to allow comparability with results from other researchers that would eventually repeat the experiments, the next 150
8. E MPIRICAL S TUDIES
ON
BPMN V ERIFICATION
8.3. Empirical Studies’ Definition
set of activities consists is packaging the results so that they can be used by the community. This involves documenting the whole experimental process, and discuss the results achieved with the experiments, after the statistical analysis of the results has been performed, focusing on aspects such as the results’ interpretation, the study’s limitations, the inferencing regarding the effectiveness of use of BPMN well-formedness rules to the population of BPMN models, and the identification of the learned lessons (sections 8.4.4 and 8.5.4). The next sections will illustrate the usage of BPMN Empirical Study framework in two BPMN experiments concerning the empirical validation of BPMN well-formedness rules.
8.3
Empirical Studies’ Definition
After a previous work about the formalization and implementation of BPMN well-formedness rules using OCL (chapter 5), the motivation for the current empirical studies are to assess the quality characteristic of correctness of BPMN models using those formalized rules. With this aim we will assess samples of BPMN models, from different sources (see section 7.3.2): • BPMN models available from open repositories; • BPMN models produced by process modelers with different technical skills (process analysts and process implementers). Following the guidelines proposed in the BPMN Empirical Study framework overviewed in section 8.2.2, we address in this section the activities that are part of the experiments’ definition, which consists upon specifying: • the research problem – justifying the importance of the empirical studies; • the research objectives – highlighting the aims of the studies; and • the context definition of the study – defining the environment that constrains the previous two (research problem and objectives).
8.3.1
Addressing Research Problems
After having previously established the topic of interest of this dissertation (section 1.2.1), we focus our study here in a more narrow research topic by tackling only one of the problems placed (RPA ). This will help us in the formulation of a set of research hypothesis (sections 8.4.1.2 and 8.5.1.2) to be tested (sections 8.4.3.3 and 8.5.3.3). Our concern here is on assessing the quality of BPMN models produced using the BPMN standard. In other words, we want to investigate the effectiveness of BPMN standard usage in different situations that lead to the production of BPMN models. So, this research problem concerns the compliance of BPMN models with the quality characteristic of correctness. For quality compliance verification we use the set of BPMN wellformedness rules previously formalized in chapter 5. The samples came from (see section 7.3.2) (i) repositories of publicly available BPMN models; and (ii) BPMN models 151
8. E MPIRICAL S TUDIES
ON
BPMN V ERIFICATION
8.3. Empirical Studies’ Definition
produced by process modelers from different technical backgrounds. From the attained results we expect to justify the benefits of incorporating well-formedness rules within the BPMN metamodel. We also expect substantiating the benefits that underpin the modeling process with tools amenable of verification of BPMN well-formedness rules.
8.3.2
Addressing Research Questions and Objectives
By tackling the problem mentioned in the previous section, were raised several questions: • Do the BPMN models hosted in open repositories and built by process modeling experts comply with the correctness quality requirement? • Is there any association between errors found in BPMN models and the violation of best-practices in process modeling recommended by practitioners? • Is there any difference, regarding the quality, of BPMN models produced by modelers with different technical backgrounds (process analysts vs process implementors)? To be more systematic and rigorous addressing to the above mentioned problems, as well as to precisely delimit the boundaries of our empirical study, we formulated a set of research questions (RQ). These research questions are stated to guide the empirical study through a short rationale descriptive, and detail the research question RQA formulated in general terms on chapter 1. More complex research questions (RQAi ) were break down in partial questions (RQAij where j is a letter that identifies a research sub-question). 1. [RQA1 ]: Can BPMN expressiveness hamper BPMN models’ correctness? • [RQA1a ]: Can the set of well-formedness rules derived in chapter 5 be more effective uncovering rule violations of process models than the verification made by BPMN experts? • [RQA1b ]: Is it likely that process modelers with different technical skills (process analysis or process implementation oriented) can deliver BPMN models with different quality characteristics? • [RQA1c ]: Is it likely that different organizations interpret differently the BPMN standard and therefore deliver BPMN models with different quality characteristics? 2. [RQA2 ]: Is there any association between the rule violations and the usage of specific constructs in BPMN models? • [RQA2a ]: More exception paths, since it means more abnormal situations to deal with by a process modeler, increase the probability of BPMN well-formedness faults? • [RQ2b ]: More parallel paths, since it means more mental states [Mil56] to deal with by a process modeler, increase the probability of BPMN well-formedness faults? 152
8. E MPIRICAL S TUDIES
ON
BPMN V ERIFICATION
8.3. Empirical Studies’ Definition
3. [RQA3 ]: Is there any association between BPMN well-formedness faults and non conformance with best-practices advocated by process modeling experts? The rest of this chapter is intended to search for answers for the research questions introduced in this section. The research questions will be refined into research goals (sections 8.4.1.1 and 8.5.1.1), which in turn, will lead to the specification of the research hypotheses (sections 8.4.1.2 and 8.5.1.2). To provide grounded answers to the aforementioned research questions, we analyzed samples of BPMN models collected from disparate sources, with respect to the effective compliance with BPMN rules, as well as generally accepted best practices (section 8.4). We analyzed also a sample of process models produced by modelers with different technical skills, either domain or IT oriented (section 8.5). For the experiments’ definition we apply the GQM framework [BCR94], already introduced in section 6.3.2. The GQM model hierarchical structure starts from a top-level goal definition. This goal is then refined into several questions, that usually break down an issue into its major components. Each question is also refined into measures. The same measure can be used to answer different questions under the same goal. The framework is instantiated through a template with a certain number of items (namely study object, purpose, quality focus, viewpoint and environment), which helps delimiting the experiments’ boundaries. This is done by focusing on the relevant goals, and determining for example the related entities to measure, the dependent and independent variables, and the hypotheses to be formulated. The instantiation of the GQM framework for the empirical study of this chapter, is made by establishing the research objective GA , as the GQM’s top-level goal, and stating this goal in the terms prescribed by the above mentioned template: Analyze BPMN models for the purpose of characterizing the usage of BPMN concerning well-formedness rules with respect to the assessment of the quality characteristic of correctness, from the point of view of BPMN modelers (process analysts and process implementers), in the context of experimental studies constrained by the specificities of the multiple sources from which the samples were collected.
8.3.3
Context Definition
The context of the BPMN experiments determines whether the experimental results are generalizable or not to a broader context. It is important to make the context explicit for the sake of the comparability of results, since each experiment can have its own distinct context, with specific costs, benefits and risks. The studies presented throughout this chapter, are developed in the context of BPMN 153
8. E MPIRICAL S TUDIES
ON
BPMN V ERIFICATION
8.4. First Empirical Study
models’ verification, using two samples of BPMN models2 : • S1 – collected from public repositories managed by two BPMN tool providers (Appendix D); and • S2 – collected from an experiment carried out with students of two degrees, in a course on BPMN modeling taught at ESTSetúbal3 academic institution, using a modeling exercise detailed in Appendixes F and G. Although the conclusions of our empirical studies can be generalizable to other BPMN modeling contexts, caution must be taken and further research is required to confirm the attained results, before the generalization of the results.
8.4
First Empirical Study
In the following sections we apply the guidelines for experiments’ reporting proposed in [JP05] to our first empirical study. For the sake of understandability, we detail the rational of each step of the reporting framework.
8.4.1
Empirical Study Planning
In Empirical Studies’ Definition (section 8.3), we already justified the need for BPMN experiments. This section is concerned with how the experiments will be performed. Before actually conducting the experiments in section Empirical Study Execution (section 8.4.2), we will characterize here with more detail the environment in which we will pursuit experiments. This will be the basis for introducing in the following sections, the research goals (section 8.4.1.1), the hypotheses under analysis and the group of independent / dependent variables that will be considered to assess the hypotheses (section 8.4.1.2), the criteria for selection of subjects participating in the experiment (section 8.4.1.3), the experiments’ design and instrumentation (section 8.4.1.4), and an evaluation of the experiment’s validity (section 8.4.1.6). The outcome of this section is an experimental design, i.e., a receipt for the experiments, which provides the information for their replication by other researchers, and also to allow readers to evaluate the experiments’ internal validity. 8.4.1.1
Research Goals
The research objective GA outlined in section 8.3.2 is refined here as research goal. We use the same index for goal and research question for the sake of traceability between them. So, the goal GA1 corresponds to research question RQA1 , and so on. Below, we decompose GA1 and GA2 into sub-goals. 2 3
The samples used in this dissertation are available in http://sdrv.ms/1i451Cd http://www.ips.pt/
154
8. E MPIRICAL S TUDIES
ON
BPMN V ERIFICATION
8.4. First Empirical Study
• GA1 (wrt RQA1 ) – analyze BPMN models for the purpose of assessing constructs’ usage with respect to compliance with BPMN well-formedness rules, from the point of view of the BPMN standard, in the context of empirical studies constrained by the usage of samples of BPMN models. ∗
GA1c (wrt RQA1c ) – analyze BPMN models for the purpose of assessing providers with respect to the quality characteristic of correctness of their models, from the point of view of the BPMN standard, in the context of an experimental study constrained by a set of BPMN models collected from open repositories.
• GA2 (wrt RQA2 ) – analyze BPMN models for the purpose of associate the usage of BPMN constructs with respect to compliance with BPMN well-formedness rules, from the point of view of the BPMN standard, in the context of experimental study constrained by a set of BPMN models from open repositories. ∗
GA2a (wrt RQA2a ) – analyze BPMN models for the purpose of associate the usage of exception paths with respect to compliance with BPMN well-formedness rules, from the point of view of the BPMN standard, in the context of experimental study constrained by a set of BPMN models from open repositories.
∗
GA2b (wrt RQA2b ) – analyze BPMN models for the purpose of associate the usage of parallel paths with respect to compliance with BPMN well-formedness rules, from the point of view of the BPMN standard, in the context of experimental study constrained by a set of BPMN models from open repositories.
• GA3 (wrt RQA3 ) – analyze BPMN models for the purpose of associate BPMN standard’s rule violations and non conformance with best-practices advocate by practitioners with respect to the positive association among them, from the point of view of BPMN modeler, in the context of an experimental study constrained by a set of BPMN models from open repositories.
8.4.1.2 8.4.1.2.1
Hypotheses and Variables Hypotheses
The hypotheses presented in this section suggest explanations for the general phenomenon of BPMN models’ correctness. The null hypothesis represents the explanation for the phenomenon that we want to challenge, i.e., is the one we will try to disprove. Conversely, we will provide an alternative hypothesis, our research hypothesis that traduces the existence of a factor which contributes for the correctness of BPMN models. By testing the hypotheses to disprove the null hypothesis, we expect to contribute for the explanation of BPMN models’ correctness. The goals settled in section 8.4.1.1 guided us through the derivation of eight different hypotheses. For each one of them, we formulate the null hypothesis (denoted by the index 0 ), leaving the alternative hypothesis (index 1 ) to be inferred by negating the null one. 155
8. E MPIRICAL S TUDIES
ON
BPMN V ERIFICATION
8.4. First Empirical Study
• HA10 (wrt GA1 ) – BPMN models built by experts have no significant BPMN wellformedness rules violations. ∗
HA1c0 (wrt GA1c ) – The quality characteristic of correctness in BPMN models, has no significant difference, regardless the organization who publishes the process model.
• HA20 (wrt GA2 ) – BPMN models well-formedness rules violations have no significant correlation with the number of constructs used. ∗
HA2a0 (wrt GA2a ) – BPMN models well-formedness rules violations have no significant correlation with the use of exception paths in BPMN models.
∗
HA2b0 (wrt GA2b ) – BPMN models well-formedness rules violations have no significant correlation with the use of parallel paths in BPMN models.
• HA30 (wrt GA3 ) – The BPMN standard’s rule violations on process models, have no significant correlation with BPMN best-practices’ violations found in the same BPMN models.
8.4.1.2.2
Variables
A variable is a particular attribute or characteristic of an entity which is being observed, so can be measured and assume more than one of a set of qualitative (aka, categorical) or quantitative (aka, numeric) values. Examples of variables in our particular case are for instance, the number of faults in BPMN models or the background of process modelers. A factor (aka, independent variable), in any experiment or observational study, is a particular type of variable that can be manipulated and influences the outcome of experimental study [Shu09]. The independent variable (the cause) is the variable which we would like to measure, while the dependent variable is the assumed effect that relies on the independent variable. Both type of variables can be stated in a hypothesis and should be explicitly tied to the research goals of the experiment. A well-designed experiment normally incorporates one or two independent variables, and two or more dependent variables [Shu09]. For selecting the variables related with the hypotheses formulated in the previous section, we rely in the GQM framework [BCR94], namely on the formulated research goals. The dependent variables’ elicitation is guided by the quality focus of each goal, which is preceded by with respect to sentence in each research goal’s formulation. The dependent variables are the link between the data to be collected and research goals to be achieved. The independent and dependent variables used for each identified hypothesis are listed in the Tables 8.1 and 8.2. Each dependent variable is specified in terms of the constructs of the BPMN metamodel and formally defined through an OCL expression which allows its computation. The definition of the variable refers the attributes to be measured, the computation rule to be applied, and the unit of measurement assigned. 156
8. E MPIRICAL S TUDIES
ON
BPMN V ERIFICATION
8.4. First Empirical Study
Table 8.1: Independent and dependent variables for HAi hypotheses Role
Variable Name
Indep.
Source
Indep.
Total Elements
Indep.
Boundary Events
Indep.
Parallel Gateways
Dep.
Total S NOK
Dep.
Total BP NOK
Description A nominal variable which identifies the source institution (BizAgi or Trisotech) of the BPMN model in the sample S1 . An absolute scale variable representing the total number of instances of modeling constructs used in the BPMN model. An absolute scale variable that conveys the number of instances of type BoundaryEvent in the BPMN model. An absolute scale variable that conveys the number instances of type Gateway that generate parallel SequenceFlow in the BPMN model. An absolute scale variable that conveys the number of well-formedness rules violated in the BPMN model, according to our automatic model checker. Each well-formedness rule is formulated in terms of an OCL invariant (see Appendix E for the complete list of rules). An absolute scale variable that conveys the number of best-practice rules violated in the BPMN model. Each best-practice rule is formulated in terms of an OCL invariant (see Appendix E for the complete list of rules)
Table 8.2: Independent and dependent variables used by HAi hypotheses Variable Name Source Total Elements Boundary Events Parallel Gateways Total S NOK Total BP NOK
Hypotheses HA1c HA2 HA2a HA2b HA1 , HA1c , HA2 , HA2a , HA2b , HA3 HA3
157
8. E MPIRICAL S TUDIES
8.4.1.3
ON
BPMN V ERIFICATION
8.4. First Empirical Study
Subjects Selection
In the pilot study regarding this section, we plan the experiment to ensure that it is carried out properly so that the results can actually reflect the actual reality of BPMN modeling, regarding models verification. The population under consideration corresponds to the BPMN models from all organizations produced by actual process modelers. Since it is unfeasible to collect randomized samples of the whole population, we relied on convenience sample S1 . Although its inference capabilities are reduced, this technique can be used for documenting the specificities of subjects (BPMN artifacts). Our sampling strategy is a combination of the simple organization (all subjects of the sample S1 are treated equally) with convenience sampling (subjects are chosen based on their easier availability). The implications of this choice will be discussed, in the next section 8.4.4, regarding Empirical Study Results. We use as representation of the population, an accessible population of BPMN models, instead of a theoretical population. The population is made available through open repositories by two BPMN standard’s contributors (BizAgi and Trisotech) that are part of the Finalization Task Force Voting Members and voted the final version of the BPMN 2.0. So, both providers of BPMN models are actual experts in the BPMN usage. The BPMN models in the accessible population are distributed into 8 different organizational functions (Human Resources, Finance, Administration, Research & Development, Production, Sales, Supply Chain, Services / Support), and 13 industries (Financial Services, Insurance, Health-care, Government (Public Sector), Manufacturing, Telecommunication, Energy/Utilities, Consulting / Service Providers, Transportation, Retail, Pharmaceutical, Hardware / Software, Communication). This set of BPMN models seems to be representative of the theoretical population, for the purposes of this study, given its broad coverage of domains of usage of BPMN models. Since the set of process models made available through both providers is subject to frequent updates, we include in our sampling frame all the BPMN models listed on both repositories on a particular moment in time (June/30/2012 00:00 GMT). Thus, our sampling frame included the enumerated set of 59 BPMN models, which were the union of the set of BPMN models made available by BizAgi and Trisotech. Finally, we actually draw from the sampling frame our convenience sample by: • discarding from the sampling frame all the To-Be models when the corresponding As-Is model was available. The justification is the big resemblance between the two versions of the process, which makes the To-Be version redundant in the sample; • discarding the models with syntactical errors, i.e., models that do not complied with the abstract syntax of BPMN, because we are interested in assessing wellformedness of BPMN models; • excluding conversation and choreography process models, and including simply orchestration process models since the rules that were going to be verified were 158
8. E MPIRICAL S TUDIES
ON
BPMN V ERIFICATION
8.4. First Empirical Study
only related to internal process models. The convenience sample S1 rested with a set of 48 BPMN models collected from the two tool providers for the realization of a post-mortem observational study. 8.4.1.4
Experimental Design
The experimental design is the framework that gives direction and systematizes the research, namely by constraining the statistical techniques that can be followed for analyzing collected data from the experiment. Hence, the design of an experiment affects findings’ achievement and is also critical for the validity of the results. Several facts may influence the choice of experimental design, such as feasibility, time, cost, ethics, and measurement problems. Moreover, the hypotheses and variables elicited, also place restrictions on the experiment designs to choose. For our experiment’s design we prescribe the division of the sample S1 into a set of groups. Each of those groups receives a set of interventions (observations or treatments). The characterization of the experimental design, to be detailed in next section, was based in the sequencing and synchronization of the interventions, the specification of their nature, as well as the group definition policy. Given the previously described sample S1 and the nature of the phenomenon in study (quality of BPMN models), we use the following types of research: • descriptive design, which aims to observe and to describe the correctness of BPMN models through a descriptive research; • correlational design, searching for relationships between variables through a relational research; • quasi-experimental design, aiming to determine the impact of a treatment in the phenomenon through the use of a semi-experimental research. For each experiment we use a notation [Tro06] that depicts the experiment design as a set of parallel sequences of letters (one sequence for each group). The meaning of each letter is concerned with the assignment to group – random assignment (R), non-equivalent group (N) or assignment by cutoff (C) – or the intervention assigned to the group – observation (O), or treatment (X). The time moves in sequence from left to right, so, elements that are listed on the left occur before elements that are listed on the right. The parallelism and synchronization of interventions among groups are represented by the vertical alignment of the correspondent letters. Following the previous considerations, we describe below the design of a set of experiments involving the intervention on artifacts stored in open repositories, for a series of post-mortem observational studies. For the HA1 hypothesis we use the convenience sample S1 as a single group. The arrangement means that there is no control group in this post-test only non-experimental design. In practical terms we pack all the BPMN models collected from the repositories, apply the checking procedure of well-formedness rules and verify whether the number 159
8. E MPIRICAL S TUDIES
ON
BPMN V ERIFICATION
8.4. First Empirical Study
of violations detected is statistically significant. It consists in a one-shot survey with a single observation, which is the simplest form of non-experiment. According to [Tro06] this is also a valid design and the most adequate form of research for the descriptive study to address our goal GA1 and the corresponding research question RQA1 . The concise representation of the non-experiment is the following: X
O
For addressing HA1c hypothesis we use the provider property of the BPMN models. By checking the well-formedness rules compliance of each group one can conclude whether the source of the BPMN model is a relevant factor regarding the number of violations detected. The BPMN models have a set of properties, thus it seems natural to split the sample S1 using these properties. The most appropriate sampling technique to be used in this case is the non-equivalent groups design technique. This design option is recommended in situations such as the one where a nominal property of the BPMN models was chosen for non-random assignment to the groups. Thus, the qualitative property of the BPMN models’ provider (Bizagi or Trisotech) is the discriminator for group assignment. This design is a post-test only non-equivalent groups quasi-experiment because there are multiple groups subjected to measurement [Tro06]. The concise representation of the quasi-experiment is the following: N1
X
O
N2
X
O
In our hypotheses HA2 , HA2a , HA2b and HA3 , we will perform correlational studies for corroborating existent relationships (associations) among BPMN models variables. We want namely, to establish relationships among BPMN correctness, embodied by wellformedness rules compliance, and specific constructs of BPMN models: (i) all instances of the graphical modeling constructs in HA2 ; (ii) boundary events that control exception paths in HA2a ; (iii) the number of parallel paths in HA2b ; and (iv) the compliance of modelers with BPMN best-practices in HA3 . In each of the correlational experiments we use 2 or more quantitative variables from the same group of BPMN models, to determine whether there is a relationship (or covariation) between the variables. Although correlation cannot prove a causal relationship, we can however use it for supporting the previous statements regarding BPMN constructs and models’ correctness. The statistical measure of correlation strength is the correlation coefficient (r), and our hypotheses should test the non independence between the variables. For testing our hypotheses we use the convenience sample S1 as a single group. The concise representation of the non-experiment is the following: 160
8. E MPIRICAL S TUDIES
X
8.4.1.5
ON
BPMN V ERIFICATION
8.4. First Empirical Study
O
Collection Procedure
The collection process planning consists in defining a protocol for gathering the experimental data in a most cost effective way, as well as ensuring the quality of data. For that purpose, it is established who (e.g. researcher, participants) will collect data, where it will be done, and what procedures should be followed. It should also be ensured the availability of subjects when data collection is scheduled to be performed. We consider for collecting a sample of BPMN models an archival research in open repositories. The advantages of archival research is that the design of the gathered BPMN models is not influenced by the researcher. On the other hand, we can access those models freely, which renders the research less expensive. We also benefit from the large amount of BPMN models available in the repositories, which allows the number of subjects in our convenience sample S1 to exceed 40 BPMN models, thus contributing for the validity of the research. We already covered in section 7.3.2, albeit from a model-driven perspective, the process of collecting BPMN artifacts stored in open repositories. The process model in Figure 7.11 details the activities supported by each tool and the role they play in data collection. The BPMN models are collected by downloading them from providers’ repositories and storing them locally in a directory on the file system. 73% of the total of those BPMN models come from the Trisotech repository and the remainder from the Bizagi web site. The Bizagi Process Modeler tool helped converting the Trisotech’s process models, in Visio file format, to the Bizagi file format. We chose to have all BPMN models in Bizagi file format because this tool has an importer utility of Visio files and also an exporter utility to XPDL file format. The BPMN metamodel – complemented by the well-formedness rules derived in chapter 5, as well as the measures specified in chapter 6 – is the basis for the verification of BPMN models. Each BPMN model after being converted to XPDL format is used as input for the instantiation of the BPMN metamodel. This allows the creation of the metaobjects, the meta-links among them, as well as the assignment of values to the attributes of the meta-objects related with the BPMN model instantiation. The well-formedness rule violations and measure observations from the instantiated process model are stored in a text file, for further processing and transformation into an SPSS data file. Finally, can be carried out the statistical treatment required for testing the formulated hypotheses. 8.4.1.6
Analysis Procedure
The analysis approaches chosen for the experiment is dependent of the adopted experiment design (section 8.4.1.4), the variables earlier defined (section 8.4.1.2.2), and the research hypotheses to be tested (section 8.4.1.2.1). If required, more than one technique 161
8. E MPIRICAL S TUDIES
ON
BPMN V ERIFICATION
8.4. First Empirical Study
may be assigned to each one of the research hypotheses, so the results can be assessed later. Furthermore, each hypothesis may be analyzed with a different technique, namely if the variables involved in the hypothesis are different from the ones being used in other hypothesis to be tested. We do not discuss in this dissertation the applicable tests in detail. However, the scale and level of measurement of the variables used in the statistics tests constrain the choice of the most suitable tests. Some activities included in data analysis are the following: • Descriptive statistics: For the dependent and independent variables, we compute, present and analyze a set of descriptive statistics of the variables’ distribution (e.g. the mean, standard deviation, the minimum value, the maximum value, the skewness and the kurtosis). The descriptive statistics provide a first glimpse on data that will be detailed in subsequent analysis. • Data set reduction: the existence in the data distribution, of outliers and extreme values can modify the relations between dependent and independent variables. Outliers and extreme values should be removed from the analysis when their presence biases the analysis. Therefore, before proceeding with further tests, one must determine whether these values occur in the data distribution. • Normality tests: Before statistical tests be done in order to verify hypotheses, we have to check the data’s distribution through the Kolmogorov-Smirnov and the Shapiro-Wilk tests. This is important, so we can select the appropriate statistical tests for data. In particular, normality tests allow the researcher to decide whether to use parametric tests, or nonparametric tests. The former are generally more powerful than the latter. However, they require a known data distribution. The latter should be used when data does not comply with a normal distribution. Anyway, further tests to the data may be required, to ensure the meaningfulness of the used statistical tests. The mentioned tests are pivotal for deciding the adequate statistics for hypothesis, given the distribution’s characteristics of the sample. The null hypothesis for the normality tests states the absence of statistically significant difference between the observed accumulated distribution and the one of the theoretical normal distribution. Considering the confidence interval of 95% in both tests, the normality hypothesis should be rejected when the significance is less than 0.05. Using different words it can be said that if the variable’s normality test has a significance level (p-value) greater than 0.05, one cannot reject the variables’ distribution normality, with a confidence level of 95%. • Correlation analysis: A kind of tests that allow verifying whether exists a statistically significant association between independent and dependent variables. If yes, the dependent variable can be regarded as a clue of the independent one. This relationship should also be further explored. Otherwise, as one can conclude on the absence of association, the hypothesis under scrutiny can be rejected. 162
8. E MPIRICAL S TUDIES
ON
BPMN V ERIFICATION
8.4. First Empirical Study
• Hypothesis testing: Depending on the sample’s distribution, a parametric or a nonparametric test is performed to check for statistically significant differences among groups of observations. We will detail each of these activities in section 8.4.3. We will also provide specific information regarding particular statistic tests, emphasizing their interpretation when they are used.
8.4.1.7
Instrumentation
The instrumentation process is concerned with the researcher’s definition of the artifacts that will be used during the experiments. The instrumentation also concerns guidelines definition, as well as tools that will support the measurements within the experiment. Training material distributed to the participants, as part of the experiment, should also be pointed out. The aim is to make clear the logistics needed for data collection in case of experiments’ replication. In the case of the current dissertation we are dealing with BPMN models correctness experiments. So, the list of BPMN well-formedness rules that are going to be used in BPMN models’ verification (Appendix E), either manually or automatically, is one of the artifacts that must be considered. The instrumentation of the study also requires off-the-shelf tools as well as custom made tools, developed for the purposes of this work. Each tool is used independently so, the experiments’ environment follows the pipes and filters [BCK03] architectural style. Below we detail the role of each tool. • The Enterprise Architect is a graphical editor of BPMN models. • The USE tool allows the specification models to use elements of UML class diagrams, enriched with expressions in OCL to specify both integrity and constraints. • The Eclipse is an IDE used here for building ATL transformations and a Java application for querying the Enterprise Architect repository. • The Bizagi Process Modeler is a graphical editor of BPMN models, an importer of BPMN models in Visio format and a transformer to XPDL format. • The SPSS is the statistical tool for processing and analysis of collected data. The tool is used to perform all the statistical tests of hypotheses. By scripting and saving the sequence of commands used for performing data analysis, it also allows the automation and replication of the whole statistical treatment. • The BPMN2USE is a transformer that takes as input BPMN graphical models produced with the Enterprise Architect tool and instantiates the BPMN metamodel using the USE concrete syntax. • The XPDL2USE is a transformer developed for parsing XPDL files and create instances of the BPMN metamodel, in the USE concrete syntax. • The JUSE-JUnit is a Java facade for the USE tool used for well-formedness rules testing and debugging. After each rule is codified, added to the BPMN metamodel and 163
8. E MPIRICAL S TUDIES
ON
BPMN V ERIFICATION
8.4. First Empirical Study
syntactically validated, BPMN model snippets were modeled to test the correctness of the rule.
8.4.2
Empirical Study Execution
In this phase, the Empirical Study Planning is instantiated. Since the plan instantiation, due to local constraints, can be done in several ways, it is important to document the specificities of a particular experiment, beyond the previously defined in the experiment plan. For instance, the number of artifacts/subjects, as well as their source/background may differ, from one to another experiment. An experiment is typically carried out by manipulating the independent variable. The effect we are interested in, the dependent variables, can then be measured through the generated data set, which allows the analysis by statistical means, namely by the hypotheses testing. 8.4.2.1
Sample
For the experimental work, we downloaded the BPMN models hosted in open repositories, in order that experiments could be conducted off-line. Although belonging to particular organizations, the BPMN models are made freely available and without any restrictions concerning the usage for academic studies. So, no data clearance need to be obtained for data collection and treatment. 8.4.2.2
Preparation
The preparation of the experiment with the sample S1 from the open repositories consisted on gathering and developing the required computational tools. This included, as mentioned before, off-the-shelf tools (Enterprise Architect, Bizagi Process Modeler, Visio, USE, JUSE-JUnit and SPSS), as well as the development of specific tools (XPDL2USE, BPMN2USE), to be part of the chosen pipe and filter architecture. A pilot study was conducted on a small sample of BPMN models, to test our process with actual data. The performance of the tools was not a requirement, given the relative small amount of sample data. Once the tools interoperability among off-the-shelf and developed tools was ensured, the data collection was performed. 8.4.2.3
Data Collection
The data collection consists in the actual execution of the experiments. We recorded information regarding the problems detected so that the experiments can be improved in further replications. In this observational study, our data collection’s process consisted in the download of a sample of BPMN models available in open repositories. The main constraint in this task was the Bizagi Process Modeler tool that was used to convert the process models from 164
8. E MPIRICAL S TUDIES
ON
BPMN V ERIFICATION
8.4. First Empirical Study
Trisotech in Visio file format (75% of the total sample) to the Bizagi file format, since the tool allows Visio file importing and XPDL file exporting. However, the Visio importer did a clumsy job, so most of the Visio format process models had to be remade in the Bizagi IDE and visually checked with the original. The XPDL exporter, on the other hand, accomplished its job, notwithstanding two main drawbacks: (1) through XPDL metadata it was not possible to locate flow nodes in lanes; (2) since BizAgi did not allow depicting participants and lanes in sub-processes, if it was required, the workaround was to depict the sub-process as call activity; the lateral effect of this option was to deal with an additional XPDL file for each sub-process which had to be merged into the main process model file.
8.4.3
Empirical Study Data Analysis
After data have been collected through sample S1 , we analyzed this sample. This process is detailed in next sections and involves the description of data sets (section 8.4.3.1), consideration regarding its reduction (section 8.4.3.2), as well as the testing of the hypotheses (section 8.4.3.3) defined during the experiments planning. By following these steps, we are instantiating the Analysis Procedure activity, part of the Empirical Study Planning. 8.4.3.1
Data Description
Data description helps understanding the gathered sample. Thus, a detailed data description of the variables collected in our samples is presented in Table 8.3. The raw data collected on our sample S1 have more data than the one needed for our analysis. To be able to statistically analyze relevant data, we filtered the raw data into data sets. Each data set became a collection of data ready for statistical analysis and inference that we used in our statistical tool (SPSS). In the following sections we present for the sample S1 , the descriptive statistics of the relevant variables for a previously formulated hypothesis. For each variable, we present the number of cases (N), the Mean, the Median, the Mode, the standard deviation (Std.Dev.), the Skewness, the Kurtosis, the Minimum value, and the Sum. The KolmogorovSmirnov with Lilliefors correction and the Shapiro-Wilk normality tests are also present. The latter is used mainly with smaller samples, and is presented here for the sake of confirmation. We present the following statistics of those tests: the test statistic (Statistic), the number of degrees of freedom (df ) and the test significance (Sig.). We begin exploring the sample by describing in Table 8.3 each of the variables in the data set. Table 8.4 summarizes the results attained by checking the business process models publicly available. As can be seen, only 53.6% of the models were in conformance with specification rules that are part of the BPMN standard. If furthermore, we had more strict requirements, by imposing the conformance with best-practices modeling rules, the percentage of models that would comply with these rules, would be drastically reduced to only 3.6%. These results underline the effectiveness and importance of OCL rules 165
8. E MPIRICAL S TUDIES
ON
BPMN V ERIFICATION
8.4. First Empirical Study
embedded in the BPMN metamodel to attain correctness in business process models. Table 8.3: Description of variables of the sample S1 Variable Source Model
Total OK Total NOK Total BP NOK Total S NOK Distinct Elements Distinct Events Total Coverage Event Coverage Activities Events Gateways ParalellGateways Boundary Events Total Elements
Description The company that produced the model BPMN model name, related with its domain 133 variables related to distinct BPMN well-formedness and best-practice rules (implemented as a OCL invariant). The value of the variable is 1 if a violation to this particular rule was detected in the model and 0 otherwise Number of distinct BPMN well-formedness and bestpractice rules that the BPMN model conforms to Number of distinct BPMN well-formedness and bestpractice rules violations Number of distinct best practices rules violations Number of distinct BPMN well-formedness rules violations Total number of distinct modeling elements used Total number of distinct instances of event types used Percentage of the available modeling constructs used by the current BPMN model (Figure 3.2) Percentage of the available BPMN event types used by the current BPMN model (Figure 3.3) 110 variables, each one has the number of times the corresponding modeling construct was used in the BPMN model Total number of instances of the Activity modeling element Total number of instances of the Event modeling element Total number of instances of the Gateway modeling element Total number of instances of Gateway used in the BPMN model that have parallel SequenceFlow Total number of instances of the BoundaryEvent modeling element Total number of instances of modeling elements
In Figure 8.2, a series of Pareto’s diagrams highlight the usage of different kind of elements in BPMN models. The shaded shape denotes the number of times a modeling element was used in the BPMN models, starting with the most used elements closest to the origin till the scarcely used, on the right side. In the sample: (a) a small set of the BPMN constructs (20%) represent 80% of the elements used in the sample’s BPMN diagrams; (b) 80% of all sort of modeling violations (well-formedness and best-practice) are due to a set of near 40% of modeling rules. For these figures contributes; (c) the violation of almost 55% of the well-formedness rules; as well as (d) the violation of 40% of the best-practice rules. The information depicted in Figure 8.2 allows us to conclude that in spite of the large set of BPMN constructs (Figure 3.2), only a small set (20%) is actually used by BPMN modelers. Furthermore, even models using a small subset of elements of the BPMN specification, are error prone. 166
8. E MPIRICAL S TUDIES
ON
BPMN V ERIFICATION
8.4. First Empirical Study
Table 8.4: Percentage of cases per number of rules violations Well-formedness
Best-practice
Both
53.6% 26.8% 12.5% 3.6% 1.8% 1.8%
3.6% 7.1% 10.7% 19.6% 16.1% 25.0% 7.1% 5.4% 3.6% 1.8%
3.6% 3.6% 14.3% 14.3% 17.9% 8.9% 10.7% 8.9% 5.4% 8.9% 1.8% 1.8%
0 1 2 3 4 5 6 7 8 9 10 12
5.0%
100%
Cum. Rules Violated
6.0%
# Cases
Cum. Modelling Elements
100%
80%
4.0% 60%
18% 16%
80%
# Cases
# Violations
14% 12%
60% 10%
3.0% 8% 40%
40% 2.0%
6%
20%
4%
20% 1.0%
2% 0%
0%
0.0%
0%
Modelling Element
Rule Violated
18% 80%
16% 14%
60%
12% 10% 8%
40%
100%
25%
80%
20%
60%
15%
40%
10%
20%
5%
# Cases
20%
Cum. Best-Practice Rules Violated
100%
(b) All kind of Rules violations
# Cases
Cum. Standard Rules Violated
(a) Modelling elements
6% 20%
4% 2%
0%
0%
0%
Standard Rule Violated
0%
Best-Practice Rule Violated
(c) Well-formedness rules violation
(d) Best-practice rules violation
Figure 8.2: Pareto diagrams for BPMN elements and rules
167
8. E MPIRICAL S TUDIES
ON
BPMN V ERIFICATION
8.4. First Empirical Study
So, one could expect to decrease the learning curve of new users on the notation, by focusing on the correct usage of these small set of modeling elements. Indeed, this is the approach to achieve quality upon models followed namely by the DSLs community. It consists in a strategy of reducing the number of constructs in the metamodel, aiming to attain correctness by construction of models [BAGaB11]. The same rational can be applied to well-formedness and best-practice rules to be primarily taught to new users. Since they are the major source of BPMN models faults, this would probably mitigate the problem. From a total of 102 formalized rules of the BPMN standard, the sample S1 reported the violation of only 15 (15%). Regarding the best-practice rules, we found errors in 19 (61%) out of 31 rules. Tools that implement the BPMN metamodel with embedded well-formedness rules are expected to contribute to a reduced learning curve of the modeling language for users, since these tools would assist the building of business process models. However, empirical studies should also be done to corroborate this conjecture. Looking for differences, concerning BPMN elements’ usage, one can see in Figure 8.3 that on average models from Trisotech are more concerned with the data perspective (ItemAwareElement and DataAssociation) in process modeling, while Bizagi’s models use on average more role assignment (Lane) and control-flow (Gateway) constructs.
Figure 8.3: Radar diagram depicting the BPMN elements’ usage by Source 168
8. E MPIRICAL S TUDIES
ON
BPMN V ERIFICATION
8.4. First Empirical Study
In Table 8.5 we summarized the descriptive statistics for the dependent variables considered for testing the hypotheses related with the sample S1 . The normality tests of those variables are also presented (Table 8.6). Next we discuss these statistics for each hypothesis. Table 8.5: Descriptive statistics (I) Total S NOK
Total Elements
Parallel Gateways
Boundary Events
Total BP NOK
48 0.81 0 0 1.161 1.746 3.19 0 39
48 101.5 76.5 49 82.98 3.195 15.315 24 4872
48 2.04 2 0 2.37 1.86 4.171 0 98
48 0.44 0 0 1.09 2.843 8.064 0 21
48 3.98 4 5 1.929 0.012 -0.28 0 191
N Mean Median Mode Std. Deviation Skewness Kurtosis Minimum Sum
Table 8.6: Tests of Normality (I) Kolmogorov-Smirnovaa Total S NOK Total Elements ParalellGateways Boundary Events Total BP NOK
Shapiro-Wilk
Statistic
df
Sig.
Statistic
df
Sig.
0.3 0.175 0.236
48 48 48
0.000 0.001 0.000
0.727 0.704 0.784
48 48 48
0.000 0.000 0.000
0.468
48
0.000
0.472
48
0.000
0.118
48
0.09
0.969
48
0.237
a. Lilliefors Significance Correction
8.4.3.1.1 HA1 In the HA1 hypothesis we want to test whether BPMN models collected from open repositories and built by experts are correct, i.e., whether they contain or not statistically significant violations to the BPMN well-formedness rules. Our dependent variable is Total S NOK. Its positive skewness (value 1.746 on Table 8.5) indicates an asymmetric distribution, with a higher frequency of lower values. The value of the kurtosis (value 3.19 on Table 8.5), allows us to say that the distribution is also leptokurtic, with higher probability of values being close to the mean than in a normal distribution. Both the skewness and the kurtosis of the distribution provide a clue on the nonnormality of the variable’s data. Table 8.6 presents the results of two tests which confirm 169
8. E MPIRICAL S TUDIES
ON
BPMN V ERIFICATION
8.4. First Empirical Study
the non-normality of the Total S NOK variable: the Kolmogorov-Smirnov with the Lilliefors correction and the Shapiro-Wilk’s normality tests. The null hypothesis for each test is that the sample comes from a Gaussian (normal) distribution. The alternative hypothesis assumes that the sample comes from a non-normal distribution. With a p-value < 0.01 in both tests for Total S NOK variable, we cannot assume the normal distribution of data. We should definitely choose a non-parametric test to assess hypothesis HA1 , since we have enough statistical confidence that the population is far from being normally distributed. The One sample Wilcoxon signed-rank test is the non-parametric statistical used to test whether a sample mean differs significantly from a hypothesized value. We will use it to test whether the mean of violations to the BPMN well-formedness rules on process models built by experts is equal to zero.
8.4.3.1.2
HA1c
In the HA1c hypothesis we want to test whether the quality characteristic of correctness in BPMN models is statistically significantly different in models published by distinct organizations. In this hypothesis it is also used as dependent variable Total S NOK. From HA1 hypothesis we already know that the variable is right-skewed and leptokurtic. So, we have also to use non-parametric tests to assess hypothesis HA1c . The Wilcoxon-Mann-Whitney test for two unpaired samples is the non-parametric statistical test that we use for verify whether the means of two samples differ significantly. The samples that are considered are the two distinct sets of BPMN models that came from Bizagi and Trisotech repositories. We will test whether the mean of violations to the BPMN well-formedness rules in each set differ significantly.
8.4.3.1.3
HA2
In the HA2 hypothesis we want to test whether the BPMN models correctness is associated with the amount of graphical constructs used in models. Besides the dependent variable Total S NOK we also have the variable Total Elements. The positive right-skewed and leptokurtic indicates the the non-normality of this variable (values of skewness/kurtosis of 3.195/15.315 on Table 8.5). Table 8.6 presents the results of normality tests that confirms the significance of the test and thus we cannot assume a normal distribution of Total Elements. The non-parametric tests of Spearman’s rank correlation coefficient and Kendall rank correlation coefficient are used to assess hypothesis HA2 . Spearman’s coefficient assesses how well the relationship between two variables can be described using a monotonic function. Kendall’s coefficient is a statistic used to measure the association between two measured quantities. We will test whether exists an association between the number of graphical constructs used in process models and the violations to the BPMN well-formedness rules. 170
8. E MPIRICAL S TUDIES
ON
BPMN V ERIFICATION
8.4. First Empirical Study
8.4.3.1.4 HA2a In the HA2a hypothesis we want to test whether the correctness of BPMN models is associated to the number of exception paths represented by instances of BoundaryEvent conveyed by Boundary Events variable. So, besides the dependent variable Total S NOK, we have also the variable Boundary Events, which is right-skewed (value 2.843 on Table 8.5) with a value of the kurtosis (value 8.064 on Table 8.5), indicating that the distribution is leptokurtic. The non-normality of data distribution of this variable is confirmed in Table 8.6 that presents the value of 0.00 in Sig. columns of Boundary Events variable indicating the significance of the test. The non-parametric tests of Spearman’s rank correlation coefficient and Kendall rank correlation coefficient are used to assess hypothesis HA2a . We will test whether exists an association between the number of graphical constructs that trigger exception paths in process models and the violations to the BPMN well-formedness rules. 8.4.3.1.5 HA2b In the HA2b hypothesis we want to test whether the BPMN models correctness is associated to the number of instances of control-flow elements in BPMN models with outgoing parallel paths. Besides the dependent variable Total S NOK, we have also the variable ParalellGateways. It is right-skewed (value 1.86 on Table 8.5) and has a kurtosis (value 4.171 on Table 8.5) which indicates a leptokurtic distribution. The distribution indicates the non-normality of this variable. The value of 0.00 in Sig. columns of ParalellGateways variable confirms the significance of the test and thus the sample is not from a normal distribution. The non-parametric tests of Spearman’s rank correlation coefficient and Kendall rank correlation coefficient are used to assess hypothesis HA2b . We will test whether exists a association between the number of graphical constructs that trigger several parallel paths in process models – i.e. multiple mental states [Mil56] to process modelers – and the violations to the BPMN well-formedness rules. 8.4.3.1.6 HA3 In the HA3 hypothesis we want to test whether the BPMN standard’s rule violations on process models is associated with BPMN best-practices’ violations found in the same BPMN models. The former is conveyed by Total S NOK and the latter by the variable Total BP NOK. This variable is almost symmetric (value 0.012 on Table 8.5) and the value of the kurtosis (value -0.28 on Table 8.5), indicates that the distribution being platykurtic, it is almost mesokurtic. 171
8. E MPIRICAL S TUDIES
ON
BPMN V ERIFICATION
8.4. First Empirical Study
Table 8.6 presents the results of the normality tests. The value of Sig. column of Total BP NOK variable confirms the non-significance of the test and thus we can assume that the sample comes from a normal distribution. The non-parametric tests of Spearman’s rank correlation coefficient and Kendall rank correlation coefficient are used to assess hypothesis HA3 . We will test whether exists an association between the BPMN best-practice rules violations found in process models and the violations to the BPMN well-formedness rules. 8.4.3.2
Data Set Reduction
The data description allows the detection of uncommon cases such as incorrect values, outliers, or extreme values. Statistical outliers are data points numerically distant from the rest of the values. To avoid the insertion of bias on the subsequent analysis to be performed, one should consider the removal of uncommon cases before hypotheses testing. Statistical outliers are however common in distributions, such as the one of most of the variables we are dealing with in our sample, which do not follow the traditional normal distribution. Therefore, in distributions with a heavy tail, when the assumption of a normal distribution do not hold, the presence of statistical outliers can be seen as more common. In the case of our sample S1 , it was not performed any data set reduction. We chose not to remove outliers and extreme values in the sample, as this would mean a threat to the validity of the achieved results. 8.4.3.3
Hypotheses Testing
From previous section 8.4.3.1 we know how data are organized, how many groups (paired or unpaired) we have to consider, and whether data are drawn for a normal or nonnormal population. We have also formulated in section 8.4.1.2.1, the null hypotheses H0 , which describe the assumptions regarding the data sets. In this section, through hypothesis testing, we want to contrast each null hypothesis H0 against its corresponding alternative hypothesis H1 . Each null hypothesis establishes the absence of a claimed observable pattern in the data set, so any found variations are due to chance. So, H0 is treated as valid unless the actual data contradicts it. Using a statistical tests we try to reject H0 against the alternative hypothesis which states that the variations observed are not coincidental. The statistical test is concerned only in testing the null hypothesis. One can only either reject the null hypothesis, or not reject it. A statistical test can never prove the alternative hypothesis, since falsifiability demands that the hypothesis is never completely accepted, only when the null is rejected. Through significance tests we decide whether the null hypothesis is supported or not. Statistical tests are the tools that allow us to conclude for the existence of statistical significance. A relevant statistical significance mean that there is statistical evidence, beyond the 172
8. E MPIRICAL S TUDIES
ON
BPMN V ERIFICATION
8.4. First Empirical Study
mere observer’s judgment, to support scientific decision of rejecting the null hypothesis. In hypothesis testing is always assumed a predefined level of significance, denoted by α. α represents an acceptable probability of wrongly rejecting the null hypothesis H0 when it is in fact true. It is also known as type I error or false positive determination. pvalue of a statistical hypothesis test is the probability of attaining a test statistic value as extreme as or more extreme when the null hypothesis H0 is true. One can also incur in the type II error or false negative determination, i.e., fail to reject the alternative hypothesis, although it is in fact false. The probability for making this error, called β, is often unknown. Type II errors are frequently due to small samples. Hence, the power of the test is defined as the probability of not committing a type II error, and should preferably be as close as possible to 1. The steps we followed to apply a statistical test are summarized below: • Confirm the statements regarding null and alternative hypotheses to be tested, as well as check whether the pre-conditions for the tests to be performed as stated in section 8.4.3.1. When comparing two groups, we must also distinguish between one-tail and two-tail tests. We choose a one-tail test when we must predict which group will have the larger population parameter before we collect any data. • Define the significance level at 5%, corresponding to the value of 0.05 for α. • Obtain using the SPSS statistical tool the p-value, which is computed getting the test’s statistics (S) and comparing it to the relevant critical values (CV). If the estimate point of a population parameter is P, with confidence interval [a, b] at confidence level C = 1 - α, then any value outside the interval [a, b] will be significantly different from P at significance level α, under the same distributional assumptions that were made to generate the confidence interval [MB10]. • Decide to either fail to reject the null hypothesis or reject it in favor of the alternative hypothesis. The decision rule can be made through two methods: (a) using the rejection region approach one should reject the null hypothesis H0 if S > CV, and otherwise accept it; (b) using the p-value one should reject the null hypothesis H0 if p ≤ α, and otherwise accept it. In this section we will use the latter approach. The soundness of our hypotheses test should be verifiable by external observers reading experiment’s report in this dissertation. We try to achieve this through a description of the results’ tests, their probability, degrees of freedom, direction, as well as test power. This level of detail is also essential so that comparisons could be meaningful when trying to combine results from tests performed in independent experiments. A detailed presentation of results is also fundamental in order to support the results’ interpretation to be made in section 8.4.4.1. 8.4.3.3.1
HA1
For testing HA1 we have measured the variable related with the number of faults in each model (Total S NOK), with all BPMN models as one group. Since those BPMN models 173
8. E MPIRICAL S TUDIES
ON
BPMN V ERIFICATION
8.4. First Empirical Study
were built by experts we would expect the faults’ mean to be equal to the hypothetical value of zero. If not we would like to know whether the difference is statistically significant. The One sample Wilcoxon signed-rank test is the non-parametric statistical test to verify whether the sample mean differs significantly from the hypothesized value of zero. The test starts by ranking all the observations, irrespective of the sample they came from. Values are ranked from Negative Ranks to Ties. There are no Positive Ranks, since the number of violations in BPMN models is a non negative number. Table 8.7 summarizes the information concerning the computed ranks. The One sample Wilcoxon signed-rank test summarized in table 8.8 leads us to reject the null hypothesis. So, there is a high probability that the sample has as mean a value different from zero. These results allow us to conclude that the BPMN models that came from open repositories and were built by BPMN experts are provided with significant well-formedness violations. Table 8.7: Ranks for HA1 Error Free - Total S NOK
Negative Ranks Positive Ranks Ties Total
N
Mean Rank
Sum of Ranks
22a 0b 26c 48
11.5 0
253 0
a. Error Free < Total S NOK b. Error Free > Total S NOK c. Error Free = Total S NOK
Table 8.8: Wilcoxon Signed Ranks test for the Total S NOK variable Error Free - Total S NOK -4.197a 0.00
Z Asymp. Sig. (2-tailed) a. Based on positive ranks.
8.4.3.3.2
HA1c
The hypothesis HA1c concerns whether there are significant differences between the BPMN well-formedness rules violations found in process models originated from different sources. We have to compare statistics of two unpaired groups of BPMN models and test whether the two groups means differ significantly. Our independent variable is Source, and we use it to discriminate between the two groups (the BPMN models from Bizagi repository and the models coming from Trisotech). 174
8. E MPIRICAL S TUDIES
ON
BPMN V ERIFICATION
8.4. First Empirical Study
Table 8.9: Ranks for HA1c Source N Mean Rank Total S NOK
1-Bizagi 2-Trisotech Total
15 33 48
Sum of Ranks
32.1 21.05
481.5 694.5
In order to compare the correctness of these BPMN models, we will perform the Mann-Whitney U test (aka Wilcoxon-Mann-Whitney) to evaluate whether the two samples come from the same population, by testing whether their means differ significantly. The test starts by ranking all the observations, regardless the sample they come from. Table 8.9 summarizes the information concerning the computed ranks. Table 8.10: Mann-Whitney U test for the Total S NOK variablea Total S NOK Mann-Whitney U Wilcoxon W Z Asymp. Sig. (2-tailed)
133.5 694.5 -2.794 0.005
a. Grouping Variable: Source As we can see, 15 of the analyzed BPMN models come from the Bizagi repository, and they have a lower mean rank. Note that the lowest ranks correspond to the highest values. If the distributions come from the same sample, they should have equal probability distributions. The Mann-Whitney test summarized in table 8.10 takes us to reject the null hypothesis, which states that the two samples come from the same population. So, we conclude for an high probability of BPMN models being from different samples. The test’s results are confirmed with a Two-Sample Kolmogorov-Smirnov test (table 8.11). The Kolmogorov-Smirnov statistic quantifies a distance between the empirical distribution functions of the two groups. Under the null hypothesis it is stated that the two samples are drawn from the same distribution. This test relies on the same rank classification (see table 8.9). Its significance confirms the results presented for the Mann-Whitney U test. These results indicate that the BPMN models produced by different sources have different levels of correctness, i.e., the the BPMN models from different origins comply differently to the BPMN well-formedness rules established by BPMN standard. In tables 8.12 and 8.13 we can collate the descriptive statistics of the sample by Source. One can conclude that although the number of the Bizagi BPMN models are less than the ones provided by Trisotech, they contribute to the whole sample with a larger number of well-formedness rule violations, both in the total and by model.
175
8. E MPIRICAL S TUDIES
ON
BPMN V ERIFICATION
8.4. First Empirical Study
Table 8.11: Two-Sample Kolmogorov-Smirnov test for the Total S NOK variablea Total S NOK Most Extreme Differences
Absolute Positive Negative
0.400 0.400 0.000 1.285 0.014 0.010
Kolmogorov-Smirnov Z Exact Sig. (2-tailed) Point Probability a. Grouping Variable: Source
Table 8.12: Descriptive statistics by Source (I) Total S NOK Source 1-Bizagi 2-Trisotech Total
Mean 1.53 0.48 0.81
Median 1 0 0
N 15 33 48
Std. Dev. 1.506 0.795 1.161
Kurtosis 0.695 2.118 3.19
Skewness 1.086 1.639 1.746
Table 8.13: Descriptive statistics by Source (II) Total S NOK Source 1-Bizagi 2-Trisotech Total
Sum 23 16 39
% of Total Sum 59.00% 41.00% 100.00%
176
% of Total N 31.30% 68.80% 100.00%
Min. 0 0 0
Max. 5 3 5
Range 5 3 5
8. E MPIRICAL S TUDIES
ON
BPMN V ERIFICATION
8.4. First Empirical Study
8.4.3.3.3 HA2 , HA2a and HA2b For testing HA2 , HA2a , and HA2b , we should find whether the variable representing wellformedness rules violations in BPMN models (Total S NOK) is associated with the variable that represents the number of instances of BPMN constructs of a certain type (Total Elements, Boundary Events, Parallel Gateways). Basically, a correlational study looks at the strength of association between the variables. Correlation does not necessarily mean causality. We start performing the correlation analysis, using the Spearman’s correlation test. For each of the studied hypotheses, we tested the correlations of the dependent variable (Total S NOK) with respect to each of the independent variables. In the correlation test, the significance level showed is regarding the two-tailed asymptotic significance. A p-value below 0.05 denotes a significance level, i.e., a statistically significant correlation. The HA2 hypothesis is concerned whether or not the number of constructs used (Total Elements) is correlated with the well-formedness rules violations in BPMN models. On the other hand, the HA2a hypothesis is concerned whether or not exception paths in BPMN models (Boundary Events) are correlated with the well-formedness rules violations in BPMN models. Finally, with HA2b hypothesis we try to measure whether or not the number of constructs with outgoing parallel paths in BPMN models (Parallel Gateways) is correlated with the well-formedness rules violations in BPMN models. The correlation analysis for the three hypotheses is summarized in table 8.14. We can observe significant correlations between our independent and dependent variables for hypothesis HA2 and HA2b and no significant correlations for hypothesis HA2a . Table 8.14: Spearman’s rho for HA2 , HA2a and HA2b Correlations Total S NOK
Total Elements
Boundary Events
Parallel Gateways
48 .549** 0.000
48 0.141 0.339
48 .422** 0.003
N Correlation Coefficient Sig. (2-tailed)
**. Correlation is significant at the 0.01 level (2-tailed). In table 8.15 is shown the strong positive relationship between all instances of FlowNode in the BPMN models (Total Elements) and the main instances of subtypes of FlowNode (Activity, Event, Gateway). We can conclude that the overall number of constructs, and particularly the number of constructs with outgoing parallel paths used in BPMN models, are associated to the observed defect violations found in BPMN models. So, one can reject the hypothesis that BPMN models well-formedness rules violations have no significant correlation with total number of instances used in the BPMN models. 177
8. E MPIRICAL S TUDIES
ON
BPMN V ERIFICATION
8.4. First Empirical Study
Table 8.15: Spearman’s rho for variables Activities, Events, Gateways
Total Elements
N Correlation Coefficient Sig. (2-tailed)
Activities
Events
Gateways
48 0.902** 0.00
48 0.725** 0.00
48 0.851** 0.00
**. Correlation is significant at the 0.01 level (2-tailed).
8.4.3.3.4
HA3
For testing HA3 we should find whether the dependent variable representing well-formedness rules violations in BPMN models (Total S NOK) is correlated to the independent variable Total BP NOK. The non-parametric test performed to validate the hypothesis HA3 is computed based on the ranks of the values in the sample instead of the values themselves. The reason for using ranks is due to the fact that one cannot rely on the assumption of normality in the analysis of variance. The Kendall rank correlation coefficient (aka Kendall’s tau coefficient) , is a statistic used to measure the association between two measured quantities. Specifically, it is a measure of rank correlation, i.e., the similarity of the orderings of the data when ranked by each of the quantities. We use the Kendall rank coefficient, under the null hypothesis, to test the independence of Total S NOK and Total BP NOK, assuming that the sampling distribution of tau has an expected value of zero. In Table 8.16 is shown that the test is statistically significant, so there is a positive relationship between Total S NOK and Total BP NOK. Table 8.16: Kendall’s tau b for HA3 Total S NOK Correlation Coefficient Sig. (2-tailed) N
.430** 0.000 48
**. Correlation is significant at the 0.01 level (2-tailed). The previous test’s result is confirmed by the Spearman’s correlation test. The Spearman rho test is also a measure of statistical dependence between two variables. It assesses how well the relationship between two variables can be described using a monotonic function. In this test we use the same variables used in the Kendall rank coefficient. In the correlation test, the significance level presented is the two-tailed asymptotic significance. As in the previous test, a p-value below 0.01 indicates a statistically significant correlation (Table 8.17). So, one can reject the null hypothesis HA3 that BPMN standard’s rule violations on process models, have no significant correlation with BPMN best-practices’ violations found 178
8. E MPIRICAL S TUDIES
ON
BPMN V ERIFICATION
8.4. First Empirical Study
Table 8.17: Spearman’s rho for HA3 Total BP NOK Total S NOK
Correlation Coefficient Sig. (2-tailed) N
0.522** 0.000 48
**. Correlation is significant at the 0.01 level (2-tailed).
in the same BPMN models. Therefore, the violations of best-practices BPMN models are associated to the observed well-formedness rules violations found in BPMN models.
8.4.4
Empirical Study Results
Since this experimental study is done, it is now crucial to package the achieved results so it can be used by the BPMN community. This involves substantiating the experimental process, as previously discussed, which includes the discussion on the results achieved with the experiments. This discussion is focused the interpretation of the results (section 8.4.4.1), as well as the limitations of the study (section 8.4.4.2), the inferencing that can be made regarding the extent to which the study’s results are expected to hold for population (section 8.4.4.3), and the identification of the learned lessons (section 8.4.4.4). 8.4.4.1
Interpretation
This section is concerned with the analysis of the tests’ outcomes, supported on the theory being assessed. When the tests do not substantiate the theoretical assumptions, we try to identify the causes that lead to the failure. Below we go through each of the hypothesis, by presenting and discussing the outcome of the hypotheses testing. • RA1 (wrt HA1 ) – Empirical evidence allows us to reject the hypothesis that BPMN experts generally produce correct BPMN models, i.e., those that do not violate BPMN well-formedness rules. This result is in line with studies [RIRG05, RRIG09] that pointed out the increase in complexity of the latest BPMN standard [BPM11] due to the introduction of several new constructs (see Figures 3.2 and 3.3). The relatively more expressiveness of BPMN came at a price of more error proneness even by BPMN experts. The solution seems to be the attachment to BPMN design tools of a well-formedness rules checker. The proposal for the well-formedness rules formalization is presented in chapter 5 and listed in Appendix E. • RA1c (wrt HA1c ) – Empirical evidence allows us to reject the hypothesis that BPMN models quality correctness is the same regardless of institution. Different institutions interpret and implement BPMN well-formedness rules differently, since they are informally expressed in natural language in the specification [BPM11]. The formalization of BPMN well-formedness rules through a rigorous 179
8. E MPIRICAL S TUDIES
ON
BPMN V ERIFICATION
8.4. First Empirical Study
language such as OCL, as done in chapter 5, could mitigate this situation, as well as facilitate the enforcement of those rules by tool makers. • RA2 (wrt HA2 ) – Empirical evidence allows us to considerer the hypothesis that BPMN models well-formedness rules violations are associated with the number of constructs used. This scalability problem comes at no surprise. Indeed, an increase in the models’ dimension, without the adequate support of automatic tools, seems to be difficult to deal with by process modelers who fail to comply with modeling rules, thereby generating faulty BPMN models. • RA2a (wrt HA2a ) – Empirical evidence do not allow us to reject the hypothesis that BPMN models well-formedness rules violations are independent of the number of constructs used to deal with exception paths. There is no evidence that an increase in the number of constructs used for documenting exceptions to the happy path, could be associated to an increase in the number of BPMN well-formedness rules violations. In other words, tackling abnormal situations is independent of the number of rule violations. • RA2b (wrt HA2b ) – Empirical evidence allows us to reject the hypothesis that BPMN models well-formedness rules violations are not associated with the parallel paths used. There is some evidence that an increase in the number of constructs from which parallel paths are derived is associated to an increase in the number of BPMN wellformedness rules violations. In other words, an increase in the number of mental states in process modeling is associated to the number of rule violations. This finding is aligned with the one reported by Cardoso [CMNR06] regarding the CFC measure. • RA3 (wrt HA3 ) – Empirical evidence allows us to reject the hypothesis that BPMN standard’s rule violations on process models are not associated with BPMN bestpractices’ violations. In other words, compliance with modeling rules advocated by practitioners are associated with well-formedness rules compliance in BPMN models.
8.4.4.2
Validity Threats
The threats’ identification aims to substantiate relevant weaknesses of the previously described empirical work. This analysis can be seen as an opportunity for a systematic approach to the experimental work for identifying supplementary studies that can contribute to improve the BPMN modeling process [Ga08]. While packaging the experimental results, we evaluate the whole experimental process, namely activities such as sampling or experimental design selection, and try to identify the potential threats to the validity of the results. Moreover, we discuss the measures put in place to address those threats. 180
8. E MPIRICAL S TUDIES
ON
BPMN V ERIFICATION
8.4. First Empirical Study
We will consider for categories of validity threats in this section the ones advocated by [Ga08] that considers four aspects to deal with: (1) internal validity which is related with the validity of the study itself, namely with the causal effect under study; (2) external validity concerns with the researcher’s ability for generalizing the results to the industry; (3) construct validity refers to the the experiment’s results generalization to the underlying theory; and (4) conclusion validity is related to the ability to derive adequate conclusions regarding the relations between the performed treatment and the research’s outcome. 8.4.4.2.1
Internal Validity
Concerning the internal validity, we consider multiple group threats. Multiple group threats result from the fact that multiple groups differently exposed to single group threats. An effect of reduction of the comparability of obtained results may occur. For S1 we consider the following threats. ∗ History. This threat is concerned with uncontrolled events that are irrelevant for the hypotheses under test. However, after those events occur confounding effects may be introduced on the outcome of performed tests. In S1 some of the BPMN models were done using BPMN version 1.2 (85%) while others were related to version 2.0 (15%). The evolution of the BPMN standard brought differences in the number of constructs and rules of the older version. However, for the analyzed models, applying the set of rules in BPMN 2.0 (a superset of the rules already existent in version 1.2) did not increase the number of faults in the BPMN models under scrutiny. ∗ Instrumentation. Errors in the measurements, either systematic or random, result from measurement instruments not working as precisely as they should. Systematic or random events may jeopardize the quality of the experiment’s collected and consequently the interpretation of the results. In S1 the instrumentation used with Trisotech and Bizagi BPMN models was slightly different, as described in section 7.3.2. However, it is unlikely the introduction of some sort of differentiation among the BPMN models, since only the models’ transformation was different. ∗ Selection. When sampling from the population, one may incur in the risk that the subjects do not represent the whole population. In S1 we are only using BPMN models which were made available through public repositories. This excludes all the BPMN models not available in the repositories’ list, at the time of the sample collection. Our convenient sampling process, also has the potential to introduce some sort of bias, even if we were not aware of it. We expected to have mitigated that bias by using BPMN models with different sources, size, and domains. 8.4.4.2.2
External Validity
External validity is related to the suitability of results’ generalization, beyond the scope of the experiment. We elicit the following potential source of threat: 181
8. E MPIRICAL S TUDIES
ON
BPMN V ERIFICATION
8.4. First Empirical Study
∗ Time. It may be the case that future developments of BPMN modeling tools may render the observations reported here as obsolete. Care must be taken on extrapolations to other contexts. 8.4.4.2.3
Construct Validity
Regarding construct validity, we consider the following design threats. Design threats are the result of difficulties for rigorously define the causes and effects being tested. This may lead to measurements and treatments poorly chosen, since the theoretical concepts intended to be tested are not truly understood. In our experimental studies the design threats regarding construct validity include: ∗ Inadequate pre-operational explanation of constructs. This threat occurs from poorly defined constructs used in the experiment. It becomes more difficult to analyze the experimental results if the theory underpinning the experiment is not clear. Our experiments are supported in OCL constraints for a rigorous measurement of all of the well-formedness rules violations in experiments, as well as other measures needed by the experiments based on S1 . We regard this as an effective mitigation of this potential threat. ∗ Confounding constructs and level of constructs. Besides assessing a construct with respect to its presence, one should measure its level. In S1 BPMN models correctness is being measured indirectly using a specific mechanism (number of well-formedness rules violations). Differentiated replicas of this study could use eventually other mechanisms (e.g. ratio of detected errors by number of modeling constructs used in the BPMN model). 8.4.4.2.4
Conclusion Validity
These are the kind of threats that are inherent to statistical tests’ usage: ∗ Reliability of treatment implementation. A lack of standardization in the implementation of the treatment can originate a confounding factor. This may be due to an inconsistent administration of the treatment in different groups. These variations happen more likely if different people apply the treatment. However, they can also occur with the same person administer the treatment. In S1 the observational study was conducted by the author of the dissertation, using automated tools. This uniformity mitigates this potential threat. 8.4.4.3
Inferences
Following the testing phase of the experimental study, should be made conclusions from the statistical tests results. Through inference we apply the conclusions that have been obtained from the experimental study to the general population. A study or experiment 182
8. E MPIRICAL S TUDIES
ON
BPMN V ERIFICATION
8.5. Second Empirical Study
needs to state and conclude something about general populations and not just about the sample that was studied. The analysis accomplished in this observational study is expected to hold for samples with larger number of BPMN models. So, we expect that some patterns of wellformedness rules violations to be observable with other BPMN models made publicly available. It seems also plausible that these observations could also applied to the BPMN models kept internal to organizations. We expect that some properties to hold, namely the ones regarding to: (1) the difficulty to cope with the expressiveness of BPMN constructs in order to ensure BPMN models’ correctness, even by BPMN experts; (2) different BPMN model producers have different conformance to BPMN rules unless BPMN wellformedness rules get formalized and implemented, by tool makers, through automatic model checkers; (3) a positive association among constructs usage and the faults detected in models built without automatic model checkers; and (4) a positive association between best-practices violations and non-conformance with BPMN well-formedness rules, suggesting process modelers should comply with BPMN modeling best-practices to attain better quality from BPMN modeling.
8.4.4.4
Lessons Learned
In this section, are discussed the lessons collected from the operationalization of the experimental study. Rather than the results’ discussion, we address the implications of these results. Ensuring data quality for the statistical analysis, was an important challenge to overcome. A large amount of time and effort was required for data collection through downloading and transformation of BPMN models. After gathering BPMN models we were able to feed them into our pipeline of applications to support our analysis. We used transformers for automating the repetitive tasks (e.g. BPMN2USE and XPDL2USE), namely for generating the meta-objects and meta-associations to instantiate the BPMN metamodel. Collecting the figures for statistical analysis after that instantiation was relatively fast. By conducting the experiment, some process issues that can be improved were noted, as well as challenges that can be tackled in future replications of this experiment. We would like to concentrate the study on clusters of rules, rather than carry out the rules one by one.
8.5
Second Empirical Study
In the following sections we report our second empirical study. Since we already detailed the rational of each step of the framework for experiments reporting [JP05] (section 8.4), we only present here the obtained results. 183
8. E MPIRICAL S TUDIES
8.5.1
ON
BPMN V ERIFICATION
8.5. Second Empirical Study
Empirical Study Planning
This step is the basis for introducing in the following sections: the research goals (section 8.5.1.1), the hypotheses under study, as well as the independent and dependent variables to be used for hypotheses’ evaluation (section 8.5.1.2), the criteria for selection of subjects participating in the experiment (section 8.5.1.3), the experiments’ design and instrumentation (section 8.5.1.4), and an evaluation of the experiment’s validity (section 8.5.1.6). 8.5.1.1
Research Goals
The research objective GA , outlined in section 8.3.2, is also refined here through two more sub-goals of the research goal GA1 . ∗
GA1a (wrt RQA1a ) – analyze BPMN models for the purpose of assessing effectiveness of automatic and manual BPMN models’ verification with respect to well-formedness rules, from the point of view of the BPMN standard, in the context of an experimental study constrained by the intervention of surrogates of actual BPMN modelers.
∗
GA1b (wrt RQA1b ) – analyze BPMN models for the purpose of assessing compliance of BPMN well-formedness rules by process analysts and process developers with respect to the quality characteristic of correctness, from the point of view of the BPMN standard, in the context of an experimental study constrained by surrogates of actual BPMN process modelers.
8.5.1.2 8.5.1.2.1
Hypotheses and Variables Hypotheses
The hypotheses presented in this section also intend to suggest explanations for the general phenomenon of BPMN models’ correctness. By testing these hypotheses we expect to contribute for the explanation of BPMN models’ correctness. The goals settled in section 8.5.1.1 guided us through the derivation of two different hypotheses. ∗
HA1a0 (wrt GA1a ) – The effectiveness of BPMN experts verifying BPMN well-formedness rules, has no significant difference from the one provided by automatic model checking.
∗
HA1b0 (wrt GA1b ) – The quality characteristic of correctness in BPMN models, has no significant difference, regardless the technical background of process modelers (process analyst and process developer).
8.5.1.2.2
Variables
The independent and dependent variables used for each identified hypothesis are listed in the Tables 8.18 and 8.19. Each dependent variable is specified in terms of the constructs of the BPMN metamodel and formally defined through an OCL expression which allows 184
8. E MPIRICAL S TUDIES
ON
BPMN V ERIFICATION
8.5. Second Empirical Study
its computation. The definition of the variable refers the attributes to be measured, the computation rule to be applied, and the unit of measurement assigned. Table 8.18: Independent and dependent variables for HA1a and HA1b hypotheses Role
Variable Name
Indep.
Modeler Type
Dep.
Total A NOK
Dep.
Total M NOK
Description A nominal variable which identifies the technical background of the BPMN modeler (process analyst or process implementer) in the sample. An absolute scale variable that conveys the same as variable Total S NOK, however collect from a different sample. An absolute scale variable that conveys the number of well-formedness rules violated in the BPMN model, according to a verification made by a panel of BPMN experts.
Table 8.19: Independent and dependent variables used by HA1a and HA1b hypotheses Variable Name Modeler Type Total A NOK Total M NOK
8.5.1.3
Hypotheses HA1b HA1a , HA1b HA1a
Subjects Selection
Our sampling strategy is a combination of the simple organization (all subjects of the sample are treated equally) with convenience sampling (subjects are chosen based on their easier availability). The implications of this choice will be discussed, in the next section 8.5.4, regarding Empirical Study Results. The study was conducted from March to June of 2012 at Escola Superior de Tecnologia de Setúbal (ESTSetúbal)4 , a polytechnic institution. It included subjects attending two degrees with distinct curricula. The participants were 1st cycle undergraduate students of Bologna’s Program of Studies, in the second semester of their academic year. The characteristics of the two graduations are described next. • Technology and Industrial Management5 – this degree includes courses with topics such as industrial processes, and information systems (with process modeling using BPMN). Given the more business and industry oriented nature of the topics taught, we chose the students from the second year of this degree as process analysts surrogates; 4 5
https://www.si.ips.pt/ests_si_uk/web_page.Inicial http://goo.gl/gNFwYd
185
8. E MPIRICAL S TUDIES
ON
BPMN V ERIFICATION
8.5. Second Empirical Study
• Informatics Engineering6 – in this degree are taught computer science topics, such as procedural and object-oriented programming languages, systems analysis and design (using UML) and process modeling (using BPMN). The prevalence of implementation topics in this degree, led us to choose students from the third year of this graduation as process implementers surrogates. The students of both degrees attended a process modeling course in the same semester, which was a good opportunity to enroll all of them in the same BPMN modeling exercise. The context of the course was a learning environment with students having a first contact with the BPMN. The students were provided, through an e-learning platform, course materials (course’s notes and tools usage) regarding BPMN modeling, as well as the exercise’s description, one of the course assignments. The number of participants was 51 (18 process developers and 33 process analysts). The experiment had the two following phases. • Training – this phase was mainly a period of familiarization with the notation. Therefore, the output produced in this phase was not used in data analysis. Was delivered detailed information to the students, about the domain of financial services provisioning using Automated Teller Machines (ATMs) (see Appendix F). The process modelers were asked to read, understand and model the exercise using BPMN. A deadline of one month was given for the accomplishment of this preliminary assignment. The main intent of this phase was that students could: (1) be acquainted with the process modeling tasks when performing a realistic modeling exercise; (2) practice the application of the process modeling and BPMN concepts taught in regular classes; (3) use a BPMN tool capable of basic syntactical checking of BPMN models, hence the tool Sparx Enterprise Architect (it was provided a video tutorial about its usage7 ). • Experiment – the actual experiment took place in a laboratory class with a time frame of two hours. At the beginning, the instructor explained to the participants what they were expected to do during that experiment, namely: (1) read the business process of Withdraw Cash (Appendix G), which was a shorter part of the overall case presented in the previous phase; (2) complete the BPMN model and store it in a provided repository of the Enterprise Architect tool. As part of the provided repository, a baseline of the solution was delivered to the students, in order to delimit the scope and variability of their solutions. With this experiment we intended, as primary goal, to evaluate the quality of the BPMN models produced by surrogates of professional process modelers with two distinct modeling profiles (process analysts and process implementers), whom were proposed to solve the same modeling exercise using the BPMN standard. 6 7
http://goo.gl/WhBC4X http://goo.gl/Y6hqW
186
8. E MPIRICAL S TUDIES
8.5.1.4
ON
BPMN V ERIFICATION
8.5. Second Empirical Study
Experimental Design
This section describes the design of a set of experiments involving the intervention on artifacts produced by undergraduate students, as surrogates of process modelers with different backgrounds. In this non-experimental study regarding the HA1a hypothesis, we chose a withingroups design. This is a type of experimental design in which all subjects are exposed to every treatment. In our case the subjects are the BPMN models, which are viewed as a single group and are subject to more than one treatment: (i) manual verification by BPMN experts; and (ii) automatic verification through a model checker. Each treatment refers to a level of the independent variable. We checked the well-formedness rules violations (dependent variable) scored by each type of verification method (independent variable) in order to answer the question regarding the effectiveness of the methods, i. e., which method is more effective discovering BPMN well-formedness rule violations. There are two fundamental advantages of the within-groups design: (1) increased statistical power; and (2) reduction in error variance associated with BPMN models differences due to the verification method. • A fundamental inferential statistics principle is that, as the number of participants increases, statistical power increases, and therefore the probability of β error decreases (the probability of not finding an effect when one truly exists). By using a within-groups design we have increased the number of sample cases relative to a between-groups design. • The reduction in error variance is due to the fact that much of the error variance in a between-groups’ design is due to the fact that, even though we randomly assigned subjects to groups, the two groups may differ with regard to important individual difference factors that effect the dependent variable. With within-groups designs, the conditions are always exactly equivalent with respect to individual difference variables since the BPMN models are the same in the different conditions. So, in the particular case of HA1a hypothesis, any factor that may affect performance on the dependent variable (detection of well-formedness rules violations) such as the previous modeling expertise of process modelers, or previous knowledge of the modeled domain by process modelers, will be exactly the same for the two conditions, because they are the exact same group of BPMN models in the two conditions. The concise representation of the non-experiment with within-groups design addressing HA1a hypothesis is the following: X1
O
X2
O
Quasi-experimental design involves selecting groups, upon which a variable is tested, without any random pre-selection process. The researcher treats the situation as an experiment even though strictly, by design, it is not. The independent variable may not be manipulated, treatment and control groups may not be randomized or matched, or there 187
8. E MPIRICAL S TUDIES
ON
BPMN V ERIFICATION
8.5. Second Empirical Study
may be no control group, so the researcher is limited in drawing conclusions [Aca13]. Non-equivalent groups are often used in quasi-experiments. In non-equivalent groups (between-groups) design, participants cannot be part of several groups, i.e., every participant is only subjected to a single treatment. This design lowers the chances of participants become more savvy through practice and experience, which could skew the results. Being aware of shortcomings of the quasi-experimental design, this sort of studies can be a very useful tool, especially in situations where randomized experiments are not possible. The design is a very good option to obtain a general overview of the problem and then follow up with a case study or quantitative experiment to focus on the underlying reasons for the attained results. For a modeling exercise, such the one we are dealing with, quasi-experimental design can be applied since the figures and results generated, allow some sort of statistical analysis. In addition, without the need of randomization to be undertaken, the design reduces the time and resources for the experimentation. Quasi-experiments with non-equivalent groups are often used when interventions are carried out on academic context and the groups correspond to different classes, such is the case for HA1b hypothesis. The time and resources available, as well as the academic rules constraint the way the groups are formed. So, usually it is not feasible, during the semester while students are taking the course, to constitute a control group. In the current modeling exercise, a possible usage of a control group would be an experiment in which one would expect assessing the benefits of modeling with support of a BPMN well-formedness rules verification tool. A treatment group would be submitted to an intervention using the BPMN verification tool, while a control group would model without the tool. The ultimate aim of this experiment, would be the assessment and comparison of generated faults on BPMN models produced by both groups. In the hypothesis HA1b addressed here students are assigned to non-equivalent groups, all submitted to the same treatment. The division of subjects between groups was convenient to cause as little disruption as possible. Albeit the groups’ probabilistic equivalence is lost, one can still compare the groups. So, to constitute the non-equivalent groups, we only have to assign students based in their graduation. During the experiment, the two sets of modelers with different backgrounds, produce BPMN models using the same testing factor: the proposed exercise. One group, constituted by surrogate of process analysts, is more knowledgeable of organizational processes and has more domain skills. The other group, constituted by surrogates of process implementers, has modeling proficiency and previous knowledge in other graphical notations, such as UML, as well as programming skills. We would expect that any deviation in results attained by groups, would be due to the fact that BPMN is not equally suitable for process analysts and process implementers, unlike advocated by the BPMN standard [BPM11]. The assessment of interventions’ effectiveness on BPMN models, from process modelers with different skills, is ensured by a post-test. Both groups received the treatment, over the same period of time, and undergone exactly the same support by the teacher 188
8. E MPIRICAL S TUDIES
ON
BPMN V ERIFICATION
8.5. Second Empirical Study
monitoring the experiment. Statistical analysis will determine whether the characteristics of the groups had a significant effect in the attained results. The concise representation of the post-test quasi-experiment with non-equivalent groups and between-subjects design is the following: N1
X
O
N2
X
O
8.5.1.5
Collection Procedure
The data for sample S2 is based on BPMN models collected in laboratory classes intended for the realization of an exercise on process modeling (Appendix G). The BPMN models were produced in a time frame of two hours, by undergraduate students attending two different degrees, in the second semester of the academic year. The students behave as surrogates of process modelers with different backgrounds. They should complete a provided baseline of the exercise’s solution, by designing new required BPMN models, which should be delivered in a file format that could be read by the Enterprise Architect tool. After collecting all the repositories with the participants’ solutions, we can now instantiate the BPMN models and verify the well-formedness rules violations. The verification process is made in two ways: • manually, by visual inspection of delivered BPMN models. This allows the comparison with the next method of BPMN models verification, for measurement of the accuracy of BPMN experts detecting rules violations; • automatically, using a BPMN model checker tool in conjunction with the Framework for BPMN Model-based testing (see Figure 7.4 in section 7.2.2). This allows the verification of BPMN models against the enriched BPMN metamodel with wellformedness rules as OCL invariants, complemented with best practices from the field. The well-formedness rule violations detected in both verifications of the instantiated BPMN models are stored in a text file, for further processing and transformation into an SPSS data file. Finally, the statistical treatment required for testing the formulated hypotheses can be carried out.
8.5.1.6
Analysis Procedure
The techniques chosen for analyzing the experiment are dependent on the adopted experiment design (section 8.5.1.4), the variables earlier defined (section 8.5.1.2.2), and the research hypotheses to be tested (section 8.5.1.2.1). 189
8. E MPIRICAL S TUDIES
8.5.1.7
ON
BPMN V ERIFICATION
8.5. Second Empirical Study
Instrumentation
The instrumentation process of this empirical study follows closely the one set up for the first empirical study. Furthermore, we distributed to the participants training material regarding BPMN, as well as the modeling exercise detailed in Appendixes F and G
8.5.2 8.5.2.1
Empirical Study Execution Sample
The sample S2 of BPMN models was collected using students as surrogates for process modelers practitioners. The experimental work was carried out within the courses on process modeling followed by the students. The evaluation of assignment, consisting in solving a modeling exercise, was one of students’ course grades. The students’ participation on the experiment have a didactic objective which was the practical usage of concepts acquired during the course. All the students that started the experiment concluded it, so any drops occurred before and there were no mortality of subjects. Non-disclosure of the responses was ensured to the participants. 8.5.2.2
Preparation
Before the conduction of the experimental work on class labs, the students received the proposed problem statement, as well as the Enterprise Architect repository with the baseline of the modeling assignment they were instructed to complete. The students were informed about our aim of using, for research purposes, the data collected during the class. However, they were not aware of the aspects being researched, as this could jeopardize the validity of the results. 8.5.2.3
Data Collection
The students carried out the experiment as part of normal lab class within the course. The exercise’s assignment accounted for their final grade, so there was an incentive to perform it well. The validation of the produced BPMN models did not interfere directly in the outcome of the solutions, as this was made off-line, after the class. The manual verification of the experiment outputs was carried out by a panel of instructors, based on a previously proposed solution for the problem. We carried out the automatic validation using the BPMN2USE and USE tools. After the manual and automatic verifications, was made available detailed data for the data analysis.
8.5.3
Empirical Study Data Analysis
After data have been collected through samples, we analyzed those samples. This process is detailed in next sections and involves the description of data sets (section 8.5.3.1), consideration regarding its reduction (section 8.5.3.2), as well as the testing of the hypotheses 190
8. E MPIRICAL S TUDIES
ON
BPMN V ERIFICATION
8.5. Second Empirical Study
(section 8.5.3.3) defined during the experiments planning. By following these steps, we are instantiating the Analysis Procedure activity, part of the Empirical Study Planning. 8.5.3.1
Data Description
In this section we are going to explore th sample S2 by describing each of the variables in the data set (Table 8.20). Table 8.20: Description of variables of the second sample Variable
Description The BPMN modeler’s background (analyst or implementer) Number of distinct BPMN well-formedness rules violations detected manually by BPMN experts Number of distinct BPMN well-formedness rules violations detected automatically by a BPMN model checker
Modeler Type Total M NOK Total A NOK
Table 8.21: Descriptive statistics (II) Total M NOK
Total A NOK
51 2.75 3 3 1.146 0.195 0.072 1 140
51 8.12 8 8 3.09 0.792 1.19 3 414
N Mean Median Mode Std. Deviation Skewness Kurtosis Minimum Sum
Table 8.22: Tests of Normality (II) Kolmogorov-Smirnovaa Total M NOK Total A NOK
Shapiro-Wilk
Statistic
df
Sig.
Statistic
df
Sig.
0.215 0.143
51 51
0.000 0.011
0.906 0.952
51 51
0.001 0.038
a. Lilliefors Significance Correction
8.5.3.1.1 HA1a In the HA1a hypothesis we want to test whether the effectiveness of BPMN experts verifying BPMN well-formedness rules, has no significant difference from the one provided by automatic model checking. 191
8. E MPIRICAL S TUDIES
ON
BPMN V ERIFICATION
8.5. Second Empirical Study
Our dependent variables are Total M NOK and Total A NOK. Its positive skewness and kurtosis (Table 8.21) indicates an asymmetric distribution, with a higher frequency of lower values and a distribution leptokurtic. Table 8.22 presents the results of two tests which confirm the non-normality of this variable. The null hypothesis for each test is based on the assumption that the sample comes from a Gaussian (normal) distribution. Conversely, the alternative hypothesis is that the sample comes from a non-normal distribution. With a p-value < 0.05 in both tests for Total M NOK and Total A NOK variables, we cannot assume the normal distribution of data and therefore we will have to use non-parametric tests to assess hypothesis HA1a . The Wilcoxon signed-rank test for two paired samples is the non-parametric statistical test that we use for verifying whether two samples come from the same population. The samples that are considered two: (1) well-formedness rules violated according to the verification performed by BPMN experts (variable Total M NOK of the data set); (2) wellformedness rules violated according to the verification executed by an automatic model checker (variable Total A NOK of the data set). We will test whether the mean of violations to the BPMN well-formedness rules by each method differ significantly. 8.5.3.1.2
HA1b
In the hypothesis HA1b the dependent variable is Total A NOK and the independent variable is Modeler Type. From HA1a hypothesis we already know that the variable is rightskewed and leptokurtic. So, we have also to use non-parametric tests to assess hypothesis HA1b . The Wilcoxon-Mann-Whitney test for two unpaired samples is the non-parametric statistical test that we use for verifying whether the means of two samples differ significantly. The samples considered are the two distinct sets of BPMN models built by surrogates of process analysts and process developers. We will test whether the mean of violations to the BPMN well-formedness rules in each set differ significantly. In this hypothesis we want to test whether the quality characteristic of correctness in BPMN models is significantly different depending on the technical background of process modelers. 8.5.3.2
Data Set Reduction
In the case of the sample S2 it was not performed any data set reduction. 8.5.3.3 8.5.3.3.1
Hypotheses Testing HA1a
For testing HA1a we have to compare statistics of two paired samples, measure the variable in two groups, and test whether the 2 samples mean differs significantly. This will allow us to conclude whether the effectiveness of BPMN experts verifying BPMN 192
8. E MPIRICAL S TUDIES
ON
BPMN V ERIFICATION
8.5. Second Empirical Study
well-formedness rules, have no significant difference from the one provided by automatic model checking. The Wilcoxon signed-rank test for two paired samples is a non-parametric statistical test to test whether the two samples mean differs significantly. Like the previous test, this one starts by ranking the difference between the observations of the two related samples. Values are ranked from Negative Ranks to Ties. There are no Negative Ranks, which means that the number of violations in BPMN models detected by manual checking never surpass the automatic checking. Table 8.23 summarizes the information concerning the computed ranks. Table 8.23: Ranks of Total A NOK - Total M NOK for HA1a N Mean Rank Sum of Ranks Negative Ranks Positive Ranks Ties Total
0a 48b 3c 51
0 24.5
0 1176
a. Total A NOK < Total M NOK b. Total A NOK > Total M NOK c. Total A NOK = Total M NOK The results for the Wilcoxon signed-rank test for two paired samples we performed are presented in Table 8.24. This test leads us to reject the null hypothesis. On the average, automatic checking is more effective than manual checking unveiling the BPMN models well-formedness rule violations. The results of the test are significant, with p-value < 0.01. Table 8.24: Test Statistics of Total A NOK - Total M NOK Wilcoxon Signed Ranks Test Sign Test -6.046a 0.000
Z Asymp. Sig. (2-tailed)
-6.784 0.00
a. Based on negative ranks.
8.5.3.3.2 HA1b The hypothesis HA1b concerns whether there are significant differences between the number of BPMN well-formedness rules violations found in process models built by process modelers with different backgrounds. We have to compare statistics of two unpaired groups of BPMN models and test whether the two groups mean differs significantly. Our independent variable is Modeler Type. We use it to distinguish between the two groups (the BPMN models built by process analysts and the ones built by process implementers). 193
8. E MPIRICAL S TUDIES
ON
BPMN V ERIFICATION
8.5. Second Empirical Study
For testing HA1b we have to compare statistics of two unpaired samples and test whether the two samples means differ significantly. By doing so, we are testing whether the quality characteristic of correctness in BPMN models, has no significant difference, regardless the technical background of process modelers. To confirm whether the values are statistically significant, we use the Mann-Whitney U test (Table 8.26). This is a non-parametric test aimed to assess whether two samples come from the same population. Table 8.25 summarizes the information concerning the computed ranks. The test starts by ranking all the observations, disregarding the sample they come from. The values are sorted in descending order. The columns represent the BPMN models designer (1-Implementer, 2-Analyst), the corresponding count of BPMN models (N), their Mean Rank and the sum of their ranks (Sum Ranks). Table 8.25: Ranks for HA1b Total A NOK
Modeler Type
N
Mean Rank
Sum of Ranks
1-Implementer 2-Analyst Total
18 33 51
27.81 25.02
500.5 825.5
18 of the analyzed BPMN models were built by process implementers, while the remaining 33 come from process analysts. The Mann-Whitney U test (M-W U) is summarized in table 8.26, where in the first column we have the Mann-Whitney U statistic (M-W U), the Wilcoxon W statistic, the test’s Z score, and the 2-tailed asymptotic significance (Asymp.Sig(2-tail)). This test leads us to not reject the null hypothesis. Table 8.26: Mann-Whitney U test for the Total A NOK variablea Total A NOK Mann-Whitney U Wilcoxon W Z Asymp. Sig. (2-tailed)
264.5 825.5 -0.645 0.519
a. Grouping Variable: Modeler Type The test’s results from the Mann-Whitney test are confirmed with a Two-Sample KolmogorovSmirnov test. This is a non-parametric test which tests differences in the shapes of the distributions of the two groups of BPMN models. This test also relies on the rank classification presented in table 8.25. Table 8.27 presents the test’s results, where we can observe that the most extreme absolute (Absolute) and positive (Positive) difference is 0.177, while the most extreme negative difference (Negative) is -0.061. A Kolmogorov-Smirnov Z-score of 0.603 and a 2-tailed asymptotic significance (Asymp.Sig.(2-tail)) p-value > 0.05 confirm the results presented for the Mann-Whitney U test. These results indicate that the BPMN models produced by process analysts are not significantly different regarding well-formedness rule violations than the BPMN models 194
8. E MPIRICAL S TUDIES
ON
BPMN V ERIFICATION
8.5. Second Empirical Study
Table 8.27: Two-Sample Kolmogorov-Smirnov test for the Total A NOK variablea Total A NOK Most Extreme Differences
Absolute Positive Negative
Kolmogorov-Smirnov Z Asymp. Sig. (2-tailed)
0.177 0.177 -0.061 0.603 0.86
a. Grouping Variable: Modeler Type
produced by process implementers.
8.5.4
Empirical Study Results
The discussion regarding the second experimental study is focused on the interpretation of the results (section 8.5.4.1), as well as the limitations of the study (section 8.5.4.2), the inference to be made regarding the extent to which the study’s results are expected to be representative of the population (section 8.5.4.3), and the identification of the learned lessons (section 8.5.4.4).
8.5.4.1
Interpretation
Below we go through each of the hypothesis of the second empirical study, by presenting and discussing the outcome of the hypotheses testing. • RA1a (wrt HA1a ) – Empirical evidence allows us to reject the hypothesis that BPMN experts have the same effectiveness evaluating BPMN rules violations as an automatic model checker. We believe this is due to the limitation of process modelers in dealing with large amount of constructs and well-formedness rules that are part of the BPMN standard (Appendix E). This result is in line with the previous one (RA1 ), which claims that BPMN models with many constructs require automatic model checking. • RA1b (wrt HA1b ) – Empirical evidence did not allow us to reject the hypothesis that BPMN models built by process analysts and process developers have the same quality. This is in line with the claimed suitability of BPMN as process modeling amenable, indeed, both for process analysts and process developers [BPM11]. Indeed, we found process analysts as able to cope with the usage of the BPMN constructs and rules as process implementers. However, since both incur in faults, during process modeling, an automatic BPMN model checker could drive process modelers through the modeling process and give hints when BPMN models are built, allowing the achievement of correct models. 195
8. E MPIRICAL S TUDIES
8.5.4.2
ON
BPMN V ERIFICATION
8.5. Second Empirical Study
Validity Threats
In this section we identify the threats and potential weaknesses of the experimental study described using sample S2 . 8.5.4.2.1
Internal Validity
Concerning internal validity, we consider two distinct threats: the social threats and the multiple group threats. Social threats to internal validity can result from usage of distinct treatments within the sample, when such distinction produces a behavior’s change in subjects. In S2 none of the groups was aware of the work performed by the other group so we dismiss any imitation in groups’ behavior. Moreover, have been made efforts in order that both groups receive the same sort of treatment avoiding behaviors of compensatory equalization, compensatory rivalry or resentful demoralization from any group. Multiple groups threats. In S2 we consider the potential of having multiple group threats since there are two process modelers’ groups with different backgrounds. ∗ Maturation. This threat conveys the distinct reaction from subjects as time progresses, resulting from, for example, the learning process or saturation. In S2 the risk of heterogeneous maturation of the process modeling language’s concepts was mitigated through a preliminary phase where modelers got acquainted with BPMN, as well as with the problem domain (see Appendix F). The preliminary phase lasted for a month, and allowed students to understand the modeling exercise (modeling a solution for the exercise described in Appendix G) and practice the BPMN language using a design tool. This setting provided homogeneity, in terms of process modeling knowledge, as well as immersion upon the problem domain, for all the participants in the experiment. ∗ Instrumentation. The participants used the same BPMN design tool, thus, problems with instrumentation could only have been occurred from misusage of the tool. Minor deviations to the instructions provided, regarding the modeling exercise, were corrected before verification of BPMN faults. 8.5.4.2.2
External Validity
External validity refers to the researcher’s ability for generalize the results beyond the scope of the experiment. As potential sources of threats are considered: ∗ People. In this study, all subjects were students. We believe students can be seen as surrogates for beginner professional modelers, in the context of this experiment, without affecting significantly its outcome. The process modeling role in general is yet to achieve a mature status. So, the problems faced by students do not noticeably differ from the ones addressed by actual practitioners. ∗ Setting. The experiment can be jeopardized when an obsolete experimental environment is used. In this study, subjects used a case tool environment during modeling, 196
8. E MPIRICAL S TUDIES
ON
BPMN V ERIFICATION
8.5. Second Empirical Study
with limited capabilities concerning syntax verification, in order to challenge their BPMN knowledge regarding BPMN well-formedness rules and syntax. Another potential issue is the usage of a modeling exercise in the experiment, which frames and consolidates, in a single place, information that otherwise had to be collect and systematized by process modelers. The provision of a baseline to students can also bias their solutions. 8.5.4.2.3
Construct Validity
With respect to construct validity, we consider the social threats. Social threats are the result from the behavior of the subjects and experimenters, when as consequence of the experiment, they act differently than they would. This behavioral change, although unintentional, is the result of the subjects’ and experimenters’ awareness regarding the experiment. In the case of S2 we are aware of facing the following threat: ∗ Experimenter’s expectancies. The experimenter’s interest in the outcome of the experiment, may bias its execution toward confirming (or refuting) the underlying theory. We did not expect to observe significant differences in the results obtained, since the training and directions provided to all participants were similar. So, no intervention on the conduction of the process modeling exercise was made, in order to not interfere with the experiment outcome. 8.5.4.2.4
Conclusion Validity
These are the kind of threats that are inherent to the usage of statistical tests. In the case of S2 we are aware of facing the following threat: ∗ Reliability of treatment implementation. To mitigate this threat, all subjects had similar conditions for performing their modeling task. The artifacts were distributed to participants of each group at the same time so they could do their modeling exercise. After solutions have been collected a single person ran the automatic model checker and a panel of experts evaluated manually the outcomes of the exercise. 8.5.4.3
Inferences
The evidences collected throughout the experiment with the second sample, suggest that the results obtained by participants, which revealed similar BPMN modeling skills regardless the subjects’ technical background, can be extrapolated for undergraduate students from the two degrees (Informatics / Technology and Industrial Management) of ESTSetúbal. Assuming that these students have basically a similar academic profile to those of other polytechnics/universities with equivalent degrees, the results could also be generalized to those students. However, this assumption should be tested by replicating this experiment in such institutions. 197
8. E MPIRICAL S TUDIES
ON
BPMN V ERIFICATION
8.6. Conclusion
Evidence referred by [Ga08] also suggests that results gathered from students with a similar profile of the ones of our experiments could be compared to those obtained by novice professionals. So, one can expect that our results to hold for the population, as well. Nevertheless, this inference should be supported through replications in professional environments. Extrapolating the observed behavior for seasoned experimenters requires that other studies must be conducted.
8.5.4.4
Lessons Learned
A large amount of time and effort was required for preparing and conducting the experiments with students. After gathering BPMN models we were able to feed them into our pipeline of applications to support our analysis. We used also transformers for automating the repetitive tasks (e.g. BPMN2USE ans XPDL2USE), namely for generating the meta-objects and meta-associations to instantiate the BPMN metamodel. While conducting the experiment, we realized that some steps on the experimental process could be improved. Also, some challenges could be tackled, in future replications of this experiment. We mention some of them: • narrow the scope of the modeling exercise presented to process modelers participating in the experiment, in order to collate the number of models’ faults and functional requirements fulfillment of models; • consider a new version of the exercise, with a treatment that gives to the participants free will regarding the model checker tuning. Therefore, modelers could decide which rules they wanted to enforce upon BPMN models (e.g. control-flow vs. data flow, or sets of best-practices or standard rules); • measure the effects on students’ learning curve of the BPMN model checker usage. During the whole experimental process, the practical details of the experimental process were registered. The feedback provided by students while learning and applying BPMN to the modeling exercise helped writing this dissertation. These information were particularly valuable for packaging the experiments, as well as for replicating the experiment in the future.
8.6
Conclusion
Given the BPMN high expressiveness, it is a challenging endeavor a process modeler be able to produce BPMN models conforming well-formedness rules. The process modeler has to ensure that the BPMN model is both syntactically valid, and that it follows the well-formedness rules described in BPMN standard. This chapter was intended to assess, through empirical studies, the effectiveness of well-formedness rules formalized in chapter 5, in raising the quality of BPMN models. In section 8.2 we discussed our option for the scientific method as the research method 198
8. E MPIRICAL S TUDIES
ON
BPMN V ERIFICATION
8.6. Conclusion
for validation of the effectiveness of the formalized well-formedness rules. We also proposed the BPMN empirical study framework, based in previous studies on Experimental Software Engineering. Throughout the remainder of the chapter we have instantiated the above mentioned framework with two experimental studies, using each one a different sample (S1 and S2 ). For both experimental studies, in the Empirical Studies’ Definition phase, the research problem was aligned with their objectives, and the context of the experiments was defined (section 8.3). The Empirical Study Planning consisted in a set of activities regarding the specification of how the experimental study had to be performed. This was done through more detailed decisions concerning the context of the experimental study, namely the formulation of the hypotheses under study, the elicitation of the set of independent and dependent variables that were used in the statistical tests, the selection of subjects to participate in the experiment, the experiments’ design and instrumentation, as well as a preliminary evaluation of the experiment’s validity (sections 8.4.1 and 8.5.1). The Empirical Study Execution consisted in the instantiation of the previously established plan, constrained to the specific circumstances found in the actual experiment (sections 8.4.2 and 8.5.2). In the Empirical Study Data Analysis the activities were the data set description, its reduction, and the hypotheses test defined during the experiment plan (sections 8.4.3 and 8.5.3). Finally with the Empirical Study Results, the activities were the results’ packaging so that they could be used in the real world. This involved documenting the whole experimental process, and discussing the achieved results, focusing on particular perspectives such as the results’ interpretation, the study’s limitations, the results’ inferencing to the population, as well as the identification of lessons learned (sections 8.4.4 and 8.5.4).
199
[This page is intentionally blank]
9 Empirical Study on BPMN Measurement
"No one has the right to destroy another person’s belief by demanding empirical evidence." – Ann Landers
Contents 9.1
Introduction . . . . . . . . . . . . . . . . . . . . . . . . . . . . . . . . . . . 202
9.2
BPMN Measurement Empirical Study . . . . . . . . . . . . . . . . . . . 203
9.3
Empirical Study Definition . . . . . . . . . . . . . . . . . . . . . . . . . . 203
9.4
Empirical Study Planning . . . . . . . . . . . . . . . . . . . . . . . . . . . 205
9.5
Empirical Study Execution . . . . . . . . . . . . . . . . . . . . . . . . . . 209
9.6
Empirical Study Data Analysis . . . . . . . . . . . . . . . . . . . . . . . . 209
9.7
Empirical Study Results . . . . . . . . . . . . . . . . . . . . . . . . . . . . 217
9.8
Conclusion . . . . . . . . . . . . . . . . . . . . . . . . . . . . . . . . . . . 219
Context: Generally process models’ measures are derived, focusing almost exclusively on their theoretical or empirical validation. This approach usually leads to unsound results difficult to interpret and generalize. Objective: The aim is to empirically validate BPMN measures previously formalized and theoretically validated, in order to assess whether these measures could be used for prediction of BPMN models’ correctness. 201
9. E MPIRICAL S TUDY
ON
BPMN M EASUREMENT
9.1. Introduction
Method: An empirical study is conducted using the BPMN empirical study framework, in order to validate the adequacy of a set of BPMN base measures to characterize the BPMN models’ internal attributes. Results: The empirical study unveiled the association between the internal attributes of BPMN models and well-formedness rules violations. A predictive model was built using a Binary Logistic Regression model for estimating the probability of a BPMN model having errors, based in measures of its internal attributes. Limitations: The validation of results was done, given the restrictions in using actual data, with a small sample of BPMN models from open repositories. Conclusion: Despite the promising results attained, more research is needed in order to corroborate the outcomes of the experiment. So, the replication of the studies in industry should be the next step to ensure the generalization of results.
9.1
Introduction
In chapter 6, we set up BPMN measures focusing mainly on their theoretical validation. The proposal was supported by a framework for BPMN measurement, inspired in the measure definition process GQM/MEDEA. Based on knowledge of the BPMN language, specific measurement goals were explicitly defined and a set of intuitive hypotheses were formulated. A set of base measures were also identified and validated against the set of theoretically properties. The base measures were intended to quantify various BPMN models’ internal attributes (e.g. size, autonomy, etc.) and act as independent variables of a prediction model for BPMN measurement. Moreover, an indirect measure for quantifying the dependent variable (wellformedness rules violations) was also derived and related with an external attribute (correctness) of BPMN models. The results attained in chapter 6 need to be empirically validated. This is the intent of the current chapter. So, the main contribution of this chapter is performing a field study aiming to: (1) the empirical validation of BPMN measures theoretically validated; (2) to formulate a prediction model to explain the relationship between BPMN models’ base measures and the models’ external quality measure. This chapter’s structure follows closely the framework for reporting BPMN experiments proposed in section 8.2.1. The empirical study inception, as well as previous related work are discussed in section 9.3. Section 9.4 describes the experimental design, namely the goals (9.4.1) and hypotheses tested (9.4.2). After empirical studies execution (section 9.5) results are presented in section 9.6 and interpreted in section 9.7. Finally, conclusions are drawn in section 9.8. 202
9. E MPIRICAL S TUDY
9.2
ON
BPMN M EASUREMENT
9.2. BPMN Measurement Empirical Study
BPMN Measurement Empirical Study
As mentioned before, this empirical study follows the BPMN empirical study framework. The rationale of each step of the framework was already detailed when empirical studies were carried out in the previous chapter. To avoid redundancy in the text of this dissertation, in the following empirical study we will refer to the sections of the previous chapter where was made the foundation of each step of the framework. We also assume that some of the activities regarding the current empirical study are already completed, namely the ones related with data collection of the sample. Since we will use in this chapter the first sample (BPMN models downloaded from open repositories) of the previous chapter, we will also omit the description of the activities already described.
9.3
Empirical Study Definition
After a previous work concerning the formalization and implementation of BPMN measures using OCL (chapter 6), the motivation of this chapter is to empirically validate those derived measures. This will be done through an empirical study on the set of formalized measures instantiated upon a sample of BPMN process models, collected from open repositories, which were already used in chapter 8. In this section we address successively: • the research problem – justifying the importance of the current empirical study; • the research objectives – highlighting the aims of the study; and • the context definition of the study – defining a framework that constrains the previous two (research problem and objectives).
9.3.1
Addressing Research Problem
After having previously established the topics of interest of this dissertation (section 1.2.1), we focus our study here in a more narrow research topic by tackling only one of the problems that was then identified (RPB ). This will help us in the formulation of a set of related research hypotheses (section 9.4.2) to be tested (section 9.6.2). So, our concerns here are: • associating the internal attributes (i.e. the candidate independent variables) of BPMN models with the correctness, the external attribute of BPMN models (i.e. the dependent variable). • derive a predictive model for quality characteristic of correctness of BPMN models based on their internal characteristics. For internal attributes measurement we use the measures formalized and implemented in chapter 6. For measurement of external attribute of correctness we use the set of BPMN well-formedness rules previously formalized in chapter 5. The samples used in the empirical study are referred in section 7.3.2. 203
9. E MPIRICAL S TUDY
ON
BPMN M EASUREMENT
9.3. Empirical Study Definition
From the attained results we would expect to contribute for improving the BPMN modeling process, providing the process modelers, methods for measuring BPMN models’ attributes, linked to their proven quality.
9.3.2
Addressing Research Questions and Objectives
In order to address the problems mentioned in the previous section, the following general questions are raised: • Is it possible to establish an association among the process model’s characteristics (e. g. autonomy, complexity, size) and well-formedness rules violations? • Is it possible to define a predictor model for the existence of rule violations in a BPMN model? To be more systematic and to rigorously address the above mentioned problems, as well as to precisely delimit the boundaries of current empirical study, we formulate a set of research questions (RQ). These research questions are in line with the intuitive hypotheses formulated in section 6.4.1.2. The research questions also intend to guide the empirical study through a short descriptive rationale, and detail the research question RQB , formulated in general terms on chapter 1. More complex research questions (RQBi ) were break down in partial questions (RQBij where j is a letter meaning a research subquestion). • [RQB1 ]: Is there any association between specific internal attributes of BPMN models and their correctness? ∗
[RQB1a ]: Is there any association between tangle and correctness of BPMN models?
∗
[RQB1b ]: Is there any association between autonomy and correctness of BPMN models?
∗
[RQB1c ]: Is there any association between complexity and correctness of BPMN models?
∗
[RQB1d ]: Is there any association between modularity and correctness of BPMN models?
∗
[RQB1e ]: Is there any association between size and correctness of BPMN models?
• [RQB2 ]: Is it possible to produce an accurate prediction model relating internal attributes and correctness of BPMN models? The remainder of this chapter is dedicated to provide answers for the research questions introduced in this section. The latter will be refined into research goals (section 9.4.1) which, in turn, will lead to the specification of the research hypotheses (section 9.4.2). To provide grounded answers to the aforementioned research questions, we are going to analyze the sample of BPMN models detailed in Appendix D, collected from disparate sources (section 7.3.2). For the experiments’ definition we apply the GQM framework [BCR94], introduced in section 6.3.2. 204
9. E MPIRICAL S TUDY
ON
BPMN M EASUREMENT
9.4. Empirical Study Planning
The instantiation of the GQM framework for the empirical study of this chapter, is based in the research objective GB , as the GQM’s top-level goal (section 6.4.1.1). The goal is stated according to the terms of the GQM template. For the sake of readability, we replicate here the GQM top-level goal already defined: Analyze BPMN models for the purpose of prediction with respect to assessment of quality characteristic of correctness, from the point of view of process modelers, in the context of a sample from open repositories constrained by the requirements of regression studies.
9.3.3
Context Definition
We follow the principles stated in section 8.3.3 and use the first sample mentioned there and identified as S1 .
9.4
Empirical Study Planning
This section is concerned with how the experiment will be performed. Before describing how the experiment was conducted (section 9.5), we will detail the environment in which we will pursuit the experiment. This will be the basis for introducing, in the following sections, the research goals (section 9.4.1), the hypotheses under study and the set of independent and dependent variables to be used for hypotheses’ evaluation (section 9.4.2), the criteria for selection of subjects participating in the experiment (section 9.4.3), the experiments’ design and instrumentation (section 9.4.4), and an evaluation of the experiment’s validity (section 9.4.6). The outcome of this section is an experimental design, i.e., a receipt for the experiment, which provides the information for experiment’s replication, and also to allow readers to evaluate the experiment’s internal validity.
9.4.1
Goals
The research objective GB outlined in section 9.3.2 is refined here as research goals. These research goals, are the subgoals of GB1 (decomposed as GB1a – GB1e ) and GB2 (section 6.4.1.1). • GB1 (wrt RQB1 ) – analyze BPMN models for the purpose of measurement of models’ internal attributes with respect to assessment of quality characteristic of correctness, from the point of view of process modelers, in the context of samples of models collected from open repositories constrained by the requirements of regression studies. Question: How to assess the internal attributes of BPMN models? 205
9. E MPIRICAL S TUDY
∗
ON
BPMN M EASUREMENT
9.4. Empirical Study Planning
GB1a (wrt RQB1a ) – . . . for the purpose of measurement of models’ tangle . . . Question: How to measure the tangle of BPMN models?
∗
GB1b (wrt RQB1b ) – . . . for the purpose of measurement of models’ autonomy . . . Question: How to measure the autonomy of BPMN models?
∗
GB1c (wrt RQB1c ) – . . . for the purpose of measurement of models’ complexity . . . Question: How to measure the complexity of BPMN models?
∗
GB1d (wrt RQB1d ) – . . . for the purpose of measurement of models’ modularity . . . Question: How to measure the modularity of BPMN models?
∗
GB1e (wrt RQB1e ) – . . . for the purpose of measurement of models’ size . . . Question: How to measure the size of BPMN models?
• GB2 (wrt RQB2 ) – analyze BPMN models for the purpose of producing a prediction model with respect to assessment of the quality characteristic of correctness, from the point of view of process modelers, in the context of samples of models collected from open repositories, constrained by the requirements of regression studies. Question: How to evaluate a predictive model of BPMN models’ quality characteristic of correctness?
9.4.2
Hypotheses and Variables
The goals settled in section 9.4.1 guide us through the derivation of six different hypotheses. For each of them, we formulate the null hypothesis (denoted by the index 0 ), leaving the alternative hypothesis (index 1 ) to be inferred by negating the null one. • HB10 (wrt GB1 ) – the external attribute of BPMN models, correctness, has no significant correlation with BPMN models’ internal attributes. ∗
HB1a0 (wrt GB1a ) – BPMN models’ correctness has no significant correlation with BPMN models’ tangle.
∗
HB1b0 (wrt GB1b ) – BPMN models’ correctness has no significant correlation with BPMN models’ autonomy.
∗
HB1c0 (wrt GB1c ) – BPMN models’ correctness has no significant correlation with BPMN models’ complexity.
∗
HB1d0 (wrt GB1d ) – BPMN models’ correctness has no significant correlation with BPMN models’ modularity.
∗
HB1e0 (wrt GB1e ) – BPMN models’ correctness has no significant correlation with BPMN models’ size.
• HB20 (wrt GB2 ) – The predictive model of BPMN models’ correctness has no significant difference from the actual correctness of BPMN models. For selecting the variables related with the formulated hypotheses, we rely also in the GQM framework [BCR94], namely on the specified research goals. The dependent variables’ elicitation is guided by the quality focus of each goal, which is preceded by the with respect to sentence in each research goal’s formulation. 206
9. E MPIRICAL S TUDY
ON
BPMN M EASUREMENT
9.4. Empirical Study Planning
The independent and dependent variables used for each identified hypothesis are detailed in the table 9.1. Each dependent variable is specified in terms of the constructs of the BPMN metamodel and formally defined through an OCL expression which allows its computation. We refer to the definition of each variable, the attributes to be measured, the measurement to be made, the computation rule to be applied, and the unit of measurement assigned (see the description column in table 9.1). Table 9.1: Variables for HB1a to HB1e Role
9.4.3
Variable Name
Indep.
Tangle
Indep.
Autonomy
Indep.
Complexity
Indep.
Modularity
Indep.
Size
Dep.
Total S NOK
Description A ratio variable with properties specified in the Definition 6.7 and measured according Definition 6.12. A ratio variable with properties specified in the Definition 6.8 and measured according Definition 6.13. A ratio variable with properties specified in the Definition 6.9 and measured according Definition 6.14. A ratio variable with properties specified in the Definition 6.10 and measured according Definition 6.15. A ratio variable with properties specified in the Definition 6.11 and measured according Definition 6.16. A ratio variable that conveys the correctness in the BPMN model, according to the verification made by an automatic model checker. The well-formedness rules are formulated in terms of OCL invariants (see Appendix E for the complete list of rules)
Subjects selection
For subjects selection in this experimental study we rely on the sample S1 collected for the study described in section 8.4.1.3.
9.4.4
Experimental Design
As referred in section 8.4.1.4, the hypotheses and variables we elicited in section 9.4.2 place restrictions on the experiment design to choose. On the other hand, this constrains the statistical studies to pursue the analyze the data collected from the experiment. Given the sample description and the nature of the phenomena in study (correctness of BPMN models), we apply a correlational design in this study to collect and analyze data in search for associations between variables. The intention of the study is to show, whether variables representing internal attributes (e.g. complexity, size) and external attributes (correctness) of BPMN models, have any kind of relationship among them. A convenience sample, of more than 40 BPMN process models from open repositories, described in section 8.4.1.3, is processed through the use of OCL measures automatically 207
9. E MPIRICAL S TUDY
ON
BPMN M EASUREMENT
9.4. Empirical Study Planning
collected from the instantiated BPMN models. For HB1a to HB1e hypotheses, we use the convenience sample as a single group. The arrangement means that there is no control group in this post-test only non-experimental design. In practical terms we pack all the BPMN models collected from the repositories, apply the measurement of internal attributes, as well as check the correctness of BPMN models and verify whether the association between variables is statistically significant. It consists in a one-shot survey with a single observation, which is the simplest form of non-experiment. This is the design [Tro06] most adequate for the descriptive study to address our goal GB1 and the corresponding research question RQB1 . The concise representation of the non-experiment is the following: X
O
We should conduct further research, regarding other kinds of formulation of processes, to check which conclusions are specific to the BPMN process models and which are generalizable to other notations.
9.4.5
Collection Procedure
The motivation for this procedure was described in section 8.4.1.5, where it was also presented an overview of the procedure followed for collecting the sample S1 used in this experiment.
9.4.6
Analysis Procedure
The analysis techniques chosen for the current experiment depend on the adopted experiment design (section 9.4.4), the variables defined and the research hypotheses being tested (section 9.4.2). The statistical tests and their conditions for the current experiment are the same as those defined in section 8.4.1.6.
9.4.7
Instrumentation
The instrumentation process is concerned with the artifacts that are used during the current experiment. It includes, among other, off-the-shelf and custom made tools that support measurements in the experiment. It also includes the logistics required to put in place the replication of the experiment. These instruments are described in section 8.4.1.7. The process models in Figures 7.8 and 7.11 detail the role of each mentioned tool, used in a pipes and filters architectural style [BCK03]. 208
9. E MPIRICAL S TUDY
9.5
ON
BPMN M EASUREMENT
9.5. Empirical Study Execution
Empirical Study Execution
The Empirical Study Planning instantiation for the current experiment was synchronized with the instantiation of the plan regarding the experiments of the previous chapter (described in section 8.4.2). So, all the steps followed (Sample, Preparation, and Data Collection) were the same for the experiments reported on both chapters.
9.6
Empirical Study Data Analysis
After we have collected the sample, we analyzed it. This process is detailed in the next sections and involves the description of the data set (section 9.6.1), as well as the testing of the hypotheses (section 9.6.2) defined during the experiment’s planning. By following these steps, we are instantiating the Analysis Procedure activity, which is part of the Empirical Study Planning (section 9.4).
9.6.1
Data Description
Data description helps understanding the sample gathered. A detailed data description of the variables collected in our sample is presented in Table 9.2. As mentioned before, relevant descriptive statistics are the measures of central tendency, as well as dispersion measures and data distributions like normal distribution. We said in section 8.4.3.1 that a sampling distribution is not normally distributed if it is skewed or has outliers which influences the statistical tests to choose in the subsequent analysis. We begin exploring the current sample by describing in Table 9.2 each of the relevant variables in the data set. Table 9.2: Description of variables of measures’ sample Variable Source Model Total S NOK Tangle Autonomy Complexity Modularity Size isFaultyModel
Description The company that was the source of the model BPMN model name, which indicates the domain of the BPMN model Number of distinct BPMN well-formedness rules violations detected in the model by the BPMN automatic checker Computed according equation 6.1 Computed according equation 6.2 Computed according equation 6.3 Computed according equation 6.4 Computed according equation 6.5 Obtained by transformation of variable Total S NOK. isFaultyModel was set to 0 (Error Free) for Total S NOK equal 0 and, to 1 (Error Found) for Total S NOK greater than 0
Looking for differences concerning measures of BPMN models from distinct sources, one can see in Figure 9.1 that, on average, models from Bizagi reveal higher values of the 209
9. E MPIRICAL S TUDY
ON
BPMN M EASUREMENT
9.6. Empirical Study Data Analysis
Complexity measure, equal Size measure value and lesser values of the other measures, when compared with models from Trisotech.
Figure 9.1: Radar diagram depicting the BPMN measures by Source In Table 9.3 we summarized the descriptive statistics of the independent variables considered for testing the hypotheses related with this sample. The normality tests of those variables are also presented (Table 9.4). Next we discuss the statistics for the hypotheses. Table 9.3: Descriptive statistics (III) N Mean Median Mode Std. Deviation Skewness Kurtosis Minimum Sum
Tangle
Autonomy
Complexity
Modularity
Size
48 1.5336 1.4393 0.88a 0.44661 0.735 -0.079 0.88 73.61
48 0.368475 0.324507 0.3214a 0.163646 1.29 1.931 0.1111 17.6868
48 2.484582 2.584963 2.8074 1.121211 0.258 1.074 0.0000 119.2599
48 0.136243 0.116071 0.0000 0.149622 1.584 3.219 0.0000 6.5396
48 5.235372 5.128694 4.4594 0.869117 0.247 -0.453 3.585 251.2979
a. Multiple modes exist. The smallest value is shown
In the HB1a to HB1e hypotheses we want to test whether the BPMN models correctness is associated with certain internal measures of BPMN models. The dependent variable for these hypotheses is Total S NOK, which was already analyzed in section 8.4.3.1.1. 210
9. E MPIRICAL S TUDY
ON
BPMN M EASUREMENT
9.6. Empirical Study Data Analysis
Its positive skewness (value 1.746 on Table 8.5) indicates an asymmetric distribution, with a higher frequency of lower values. The value of the kurtosis (value 3.19 on Table 8.5), allows us to say that the distribution is also leptokurtic, with higher probability of values being close to the mean than in a normal distribution. Both the distribution’s skewness and kurtosis provide a clue on the non-normality of the variable’s data. Table 8.6 presented also in section 8.4.3.1.1 confirms the non-normality of the Total S NOK variable. Besides the dependent variable Total S NOK, we have also the independent variables Tangle, Autonomy, Complexity, Modularity, and Size. The positive right-skewed and leptokurtic of Autonomy, Complexity, Modularity indicates the non-normality of this variable (values of skewness/kurtosis in Table 9.3). Table 9.4 presents the results of normality tests that confirms its significance and thus, we cannot assume a normal distribution of Autonomy, Complexity, and Modularity. Only Tangle and Size conform with a Gaussian distribution. The non-parametric tests of Spearman’s rank correlation coefficient is used to assess HB1a to HB1e hypotheses. Spearman’s coefficient assesses how well the relationship between two variables can be described using a monotonic function. We will test whether exists a correlation between the internal attributes of BPMN models (through the measures Tangle, Autonomy, Complexity, Modularity, and Size) and the external attributes of BPMN models (correctness) measured through the counting of violations of BPMN well-formedness rules. Table 9.4: Tests of Normality (III) Kolmogorov-Smirnovaa Tangle Autonomy Complexity Modularity Size
Shapiro-Wilk
Statistic
df
Sig.
Statistic
df
Sig.
0.112 0.168 0.135 0.181 0.085
48 48 48 48 48
0.173 0.002 0.028 0.000 .200*
0.941 0.896 0.972 0.831 0.981
48 48 48 48 48
0.018 0.000 0.305 0.000 0.609
a. Lilliefors Significance Correction *. This is a lower bound of the true significance.
9.6.2 9.6.2.1
Hypotheses Testing Hypotheses HB1a to HB1e
For testing HB1a to HB1e , we should find whether the variable representing the external attribute correctness in BPMN models (Total S NOK) is associated with the variables that represent the internal attributes of BPMN models (Tangle, Autonomy, Complexity, Modularity, and Size). We perform the correlation analysis, using the Spearman’s correlation test. For each 211
9. E MPIRICAL S TUDY
ON
BPMN M EASUREMENT
9.6. Empirical Study Data Analysis
of the hypotheses considered, we computed and tested the correlations of the dependent variable (Total S NOK) with respect to the independent variables, as summarized in table 9.5. We realized significant correlations between the independent variable and the dependent variables Tangle, Autonomy, Complexity, and Size. Only for Modularity there is no significant correlations with Total S NOK. Table 9.5: Spearman’s rho for HB1a to HB1e Correlations Total S NOK
N Correlation Coefficient Sig. (2-tailed)
Tangle
Autonomy
Complexity
Modularity
Size
48 .359* 0.012
48 -.345* 0.016
48 .509** 0.000
48 0.053 0.723
48 .485** 0.000
**. Correlation is significant at the 0.01 level (2-tailed). *. Correlation is significant at the 0.05 level (2-tailed).
We can conclude that the internal attributes of BPMN models Tangle, Autonomy, Complexity, and Size, are associated to the external attribute correctness of BPMN models. So, one can reject the hypothesis that in BPMN models’ sample, the referred internal attributes have not significant correlation with the defects found in the BPMN models, at the 0.05 level. 9.6.2.2
Predictive Model
In this section we derive a predictive model to statistically detect faults in BPMN models, using a Binary Logistic Regression (BLR) model. BLR requires an initial calibration phase where the values of the model coefficients are determined based on preexisting values. For calibration of our model, we use the sample of BPMN models collected from open repositories. These models constituted the training set of the statistical model. Logistic regression (aka logistic model or logit model) is used for prediction of the probability of occurrence of an event by fitting data to a logistic curve [Fie09]. Here, the considered event is a BPMN model containing well-formedness rules violations. BLR is a generalized linear model used for binomial regression. The logistic function is useful because it can take as an input any value from negative infinity to positive infinity, whereas the output is confined to values between 0 and 1. BLR has been used in experimental works in several domains, such as Software Engineering (e.g. [BAM10]). After the BLR model has been calibrated, and like other types of regression models, it is fed with a set of numerical or categorical regressors variables (predictor variables). In our case, the regressors are a set of internal attributes of BPMN models (Tangle, Autonomy, Complexity, and Size) derived in chapter 6, and shown in the previous section to be associated with the external attribute correctness of BPMN models. As dependent variable, in the formulation of our predictive model, we define isFaultyModel. This variable represents the probability of a given BPMN model to be correct based on its own internal attributes. The BLR is formalized by the following expression 212
9. E MPIRICAL S TUDY
ON
BPMN M EASUREMENT
9.6. Empirical Study Data Analysis
(a formulation similar to the equation 6.6): isFaultyModel = f (z) =
1 1 + e−z
(9.1)
where
z = β0 + β1 Tangle + β2 Autonomy + ComplexityX3 + β4 Size
(9.2)
The variable z represents the exposure to some set of risk factors (the internal attributes of BPMN models in this case), while f (z) represents the probability of a particular outcome (incorrectness of BPMN model due to non-compliance with some wellformedness rules), given that set of risk factors. Variable z is a measure of the total contribution of all the risk factors used in the model and is known as the logit. The β0 parameter is called the intercept parameter (value of z when all risk factors are 0) and β1 through β4 are the regression coefficients of the corresponding predictors. Each of the regression coefficients quantifies the contribution of the respective predictor. A positive regression coefficient means that the risk factor increases the probability of the outcome, while a negative regression coefficient means that the risk factor decreases the probability of that outcome. The values of all βi parameters are obtained by regression upon the mentioned training set of predictor and outcome values. The values of the predictors were obtained by running the measures upon the collected sample of BPMN models from open repositories. The values of the outcome variable (values of isFaultyModel for each BPMN model in the sample set) were obtained by transformation of the values of variable Total S NOK (Table 9.2). isFaultyModel was set to 0 (Error Free) for Total S NOK equal 0, and to 1 (Error Found) for Total S NOK greater than 0. We are interested in finding high correlations between the internal attributes of BPMN models and the external attribute represented by isFaultyModel. Furthermore, we want to ensure there is independence among of the base measures of the internal attributes. To do so, and since, as we saw in Table 9.4, none of the variables has a normal distribution, we use the non-parametric Spearman’s rho correlation coefficient (Table 9.6). We conclude that all correlations are significant, except the relationship between Tangle and Autonomy. The results presented in Table 9.6 show that all other measures have a low to moderate correlation with isFaultyModel. Tangle and Autonomy exhibit low correlation and therefore seems to be the worst predictors among the chosen measure set. Noteworthy, the high correlation between Size and Tangle / Autonomy. This is a potential threat since it indicates the presence of multicollinearity, which means that predictor variables are highly correlated among them. The collinearity statistics in Table 9.7, allow us to consider all regressors as acceptable. The presence of multicollinearity is only assumed for the thresholds of Tolerance < 0.20 213
9. E MPIRICAL S TUDY
ON
BPMN M EASUREMENT
9.6. Empirical Study Data Analysis
Table 9.6: Spearman’s rho for BLR model Tangle Tangle Autonomy Complexity Size isFaultyModel
Correlation Coefficient Sig. (2-tailed) Correlation Coefficient Sig. (2-tailed) Correlation Coefficient Sig. (2-tailed) Correlation Coefficient Sig. (2-tailed) Correlation Coefficient Sig. (2-tailed)
-.737** 0.000 .608** 0.000 0.123 0.403 .323* 0.025
Autonomy
Complexity
Size
isFaultyModel
-.737** 0.000
.608** 0.000 -.564** 0.000
0.123 0.403 0.004 0.978 .635** 0.000
.323* 0.025 -.287* 0.048 .432** 0.002 .420** 0.003
-.564** 0.000 0.004 0.978 -.287* 0.048
.635** 0.000 .432** 0.002
.420** 0.003
**. Correlation is significant at the 0.01 level (2-tailed). *. Correlation is significant at the 0.05 level (2-tailed).
or VIF > 5. Table 9.7: Collinearity Statistics for BLR model Tolerance
VIF
Coefficients for Dependent Variable: Tangle Autonomy Complexity Size
0.38 0.22 0.357
2.634 4.544 2.803
Coefficients for Dependent Variable: Autonomy Complexity Size Tangle
0.224 0.429 0.374
4.466 2.332 2.673
Coefficients for Dependent Variable: Complexity Size Tangle Autonomy
0.946 0.445 0.46
1.057 2.246 2.175
Coefficients for Dependent Variable: Size Tangle Autonomy Complexity
0.367 0.447 0.481
2.727 2.236 2.081
Running BLR, the step 0 of model construction, give us the intercept only model, a model with no predictors’ variables included (Tables 9.8 – 9.10). The value of 54.2% (= 26/48) in Table 9.8, gives the classification accuracy we get if we had considerer all the BPMN models as Error Free, which is the same as the probability of getting a error free model from the sample. In Table 9.9 the value of -0.167 in the exponentiate intercept, is the intercept B of the model, since there are no predictor variables. The level of significance of 0.564 for the Wald statistics allows not reject the null hypothesis, which states an equal probability of find errors in the model or getting a error free model. The exponentiate intercept, Exp(B), is 0.846 (= 22/26), which means there is a likelihood of 15.4% of not having errors in the model. Another way to convey the same is saying that process modelers are likely to get a model free of errors at an odds rate of 1.18 (= 26/22). 214
9. E MPIRICAL S TUDY
ON
BPMN M EASUREMENT
9.6. Empirical Study Data Analysis
Table 9.8: Step 0 - Classification Tablea,b Predicted isFaultyModel Error Error Free Found
Observed isFaultyModel
Error Free Error Found
26 22
Percentage Correct
0 0
100 0 54.2
Overall Percentage a. Constant is included in the model. b. The cut value is .500
Table 9.9: Step 0 - Variables in the Equation Constant
B
S.E.
Wald
df
Sig.
Exp(B)
-0.167
0.29
0.333
1
0.564
0.846
According to Table 9.10, one can conclude that all regressors are statistically significant and related to isFaultyModel. Table 9.10: Step 0 - Variables not in the Equation Variables
Tangle Autonomy Complexity Size
Overall Statistics
Score
df
Sig.
5.345 4.312 10.406 8.723 12.924
1 1 1 1 4
0.021 0.038 0.001 0.003 0.012
In Table 9.11 are presented the results of the tested hypothesis that have the the same predictive capacity of the BLR model when all three independent variables are entered. The null hypothesis for the Omnibus test is that adding the predictors to the model has not significantly increased our ability to predict the correctness of the BPMN model. Given the statistically significance of the Chi-square statistic, we can reject the null hypothesis and conclude that the predictors have significantly increased our ability to predict the correctness of the BPMN model. Table 9.12, shows the R Squares presented in both tests. These statistics give a rough estimate of the variance in isFaultyModel that can be predicted through the conjunction of the three variables. The Nagelkerke R Square statistic, which is scaled from 0 to 1.0, can roughly be interpreted as 34.5% of variability on dependent variable be accountable to the independent variables. The Cox and Snell test is usually an underestimate. The -2 Log likelihood statistic is quite small, meaning that the model has some predictive capacity of isFaultyModel occurrence. The Hosmer-Lemeshow goodness-of-fit test considers as null hypothesis that there is a linear relationship between the predictor variables and the log odds of the criterion variables. Given the level of significance shown in Table 9.13 we reject this hypothesis. Since the Hosmer-Lemeshow is not statistically significant, it means that our BLR model has 215
9. E MPIRICAL S TUDY
ON
BPMN M EASUREMENT
9.6. Empirical Study Data Analysis
Table 9.11: Step 1 - Omnibus Tests of Model Coefficients Step Block Model
Chi-square
df
Sig.
15.505 15.505 15.505
4 4 4
0.004 0.004 0.004
Table 9.12: Step 1 - Model Summary -2 Log likelihood
Cox & Snell R Square
Nagelkerke R Square
50.704a
0.276
0.369
a. Estimation terminated at iteration number 5.
some predictive capacity. Table 9.13: Step 1 - Hosmer and Lemeshow Test Chi-square
df
Sig.
3.064
8
0.93
If we compare the results of Table 9.14 with the ones previously obtained in Table 9.8, we can conclude that the introduction of predictors variables in the BLR model, increased the errors’ predictive capacity of the model, from 0% to 72.7%. The Overall Percentage of predictive capacity of the BLR also increased by 20.8% (from 54.2% to 75%). According to Table 9.14, we can say that 76.9% of the BPMN models which are Error Free are predicted correctly with this model, while in 72.7% classified as Error Found were predicted correctly. In other words, we have 6 false positives and 6 false negatives. We predict 22 (=16+6) BPMN models with errors, but we fail in 6 cases, so our false positive rate is 27.2% (=6/22). We predict 26 (=20+6) BPMN models without well-formedness rules violations and we fail in 6 cases. Thus, our false negatives rate is 27.2% (=6/26). We can conclude from Table 9.15 that, when all variables (Tangle, Autonomy, Complexity, and Size) are considered together with an α=0.05, they are not significant. This suggests some correlation among variables, as we previously saw in Table 9.6. The Wald statistic, which tests the unique contribution of each predictor in the context of the other predictors, shows that Size is the predictor that most contributes to the BLR model, followed by Autonomy. The z value required to calculate the probability of a BPMN model being incorrectly formed (isFaultyModel), is so the one we can obtain by instantiating the equation 9.2 with the values of the B column of Table 9.15, as follows:
z = −5.866 + 0.392 Tangle − 4.653 Autonomy + 0.096 Complexity + 1.244 Size
(9.3)
For assess the BLR model we used also the precision and recall concepts, from pattern 216
9. E MPIRICAL S TUDY
ON
BPMN M EASUREMENT
9.7. Empirical Study Results
Table 9.14: Step 1 - Classification Tablea Predicted isFaultyModel Error Error Free Found
Observed isFaultyModel
Error Free Error Found Overall Percentage a. The cut value is .500
20 6
Percentage Correct
6 16
76.9 72.7 75
Table 9.15: Step 1 - Variables in the Equationa Tangle Autonomy Complexity Size Constant
B
S.E.
Wald
df
Sig.
Exp(B)
0.392 -4.653 0.096 1.244 -5.866
1.382 4.23 0.767 0.735 3.697
0.081 1.21 0.016 2.868 2.517
1 1 1 1 1
0.776 0.271 0.901 0.09 0.113
1.481 0.01 1.101 3.469 0.003
a. Variable(s) entered on step 1: Tangle, Autonomy, Complexity, Size.
recognition, which are based on the understanding and measure of relevance. In this particular case precision (aka positive predictive value) is the percentage of errors detected by the BLR model that are correct: 72.7% (=16/(16+6)). On the other hand, recall (aka sensitivity) is defined as the percentage of errors that are selected, which also takes the value of 72.7% (=16/(16+6)). Since we have a high recall, it means that the BLR model returned most of the relevant results. The high precision means also that the BLR model returned substantially more relevant results than irrelevant. In terms of accuracy the BLR model gets the value of 75% (=(16+20)/(16+20+6+6)), which is considered good enough for this kind of application.
9.7
Empirical Study Results
In this section we package the results so they can be used by the process modeling community, as mentioned in section 8.4.4. We focus the following discussion on the interpretation of the results (section 9.7.1), the inference regarding the extent of the study’s results being expected to hold for the population (section 9.7.2), and the identification of the learned lessons (section 9.7.3).
9.7.1
Interpretation
This section analyzes the outcome of the tests, anchored on the theory formulated in chapter 6. In the following paragraphs we go through the hypotheses to discuss the results of their testing. • RB1 (wrt HB1 ) – Empirical evidence allows us to reject the hypothesis that BPMN 217
9. E MPIRICAL S TUDY
ON
BPMN M EASUREMENT
9.7. Empirical Study Results
models’ external attribute of correctness has no association with the internal attributes of Tangle, Autonomy, Complexity, and Size. On the other hand we do not reject the null hypothesis for the measure of Modularity The relationships are positive (negative) between the BPMN models’ measures of Tangle, Complexity, and Size (Autonomy), and the number of BPMN well-formedness rules violations. The correlation strength of these relationships can be considered low (between 20%– 40%), for Tangle and Autonomy, and moderate (between 40%–70%), for internal attributes’ of Complexity and Size (Table 9.5). • RB2 (wrt HB2 ) – A predictive model based in the Binary Logistic Regression, was built to detect faults in BPMN models. We have shown that using a set of BPMN measures, with a moderate sized training set, we were able to build a model that predicted correctly around 72.7% of the methods which are faulty BPMN models and 76.9% of the BPMN models which are not, with a false positive rate of 27.2% and a false negative rate also of 27.2%. The potential validity threats of this experimental work were previously described in section 8.4.4.2, regarding the first sample (S1 ) used in chapter 8, the same used in the current experiment. Furthermore, albeit BLR is a mathematically sound approach, since we used a limited number of BPMN models, we are aware that our ability to generalize the results is limited.
9.7.2
Inferences
In section 8.4.4.3, we characterized the aim of this activity, which is mainly to derive conclusions from the statistical tests results and generalize the research. We expect the same patterns of BPMN models’ internal attributes and correctness shown through this empirical study should hold and be observable with other models publicly available. The results of this study should only be considered valid in the context of BPMN models, rather than generic to other process notations or formalizations. It seems also plausible that these observations could also be applied to actual BPMN models of real organizations. However, we must bear in mind that observing these results in an organization, requires some stability of the modeling tool, as well the modeling process. The introduction of new tools and working processes could easily alter structurally the prediction model, forcing the re-computation of the BLR coefficients. Nevertheless, it was demonstrated in this chapter that it is possible to produce a BLR model for estimating the probability of a BPMN model having errors, based in measures of its internal attributes. However, for applying the BLR model in an organization, it is required the calibration of the BLR coefficients based in the repository of past BPMN modeling projects. 218
9. E MPIRICAL S TUDY
9.7.3
ON
BPMN M EASUREMENT
9.8. Conclusion
Lessons Learned
In section 8.4.4.4, we already discussed the learned lessons with respect to the operationalization of the experimental studies. Those remarks also applies to this regression study. Specifically we highlight the use of statistical techniques to calibrate a predictive model amenable to determine the probability of a BPMN model to violate well-formedness rules. Moreover, the BLR model besides being able to predict how many faulty models exist in a sample, it can also predict the number of false positives and false negatives.
9.8
Conclusion
One of the objectives of this chapter was to perform a correlational field study in order to complete the theoretical study of chapter 6 regarding BPMN measures, by validating empirically those measures and the relationship between BPMN models’ base measures and the BPMN models’ correctness. Another objective was to formulate a prediction model for the BPMN models’ correctness based on BPMN models’ base measures. For achieving the BLR model, was used a sample of BPMN models as a training set, for calibration purposes. Using the measures theoretically validated in chapter 6, the regressors (BPMN measures) were computed, as well as the BLR coefficients needed. Using the probabilistic model, we were able to estimate the probability of a given BPMN model being faulty, giving as input the measures of its internal attributes. In this chapter, to conduct the empirical study, we also followed the BPMN empirical study framework, derived in the previous chapter. In section Empirical Study Definition, the research problem was stated with the objectives of the experiment, as well as the context in which the experiment was carried out. The Empirical Study Planning detailed the decisions concerning the context of the experiment, namely the formulation of the hypotheses under study and the elicitation of the set of independent and dependent variables that were used in the statistical tests. In section 9.6, we described the data set and performed the testing of the hypotheses defined during the experiment plan. Finally, in section 9.7, after the experiment has been performed, the results were packaged so that they could be disseminated.
219
[This page is intentionally blank]
10 Conclusion
"I never see what has been done; I only see what remains to be done."
– Buddha the enlightened one
Contents 10.1 Synthesis . . . . . . . . . . . . . . . . . . . . . . . . . . . . . . . . . . . . . 222 10.2 Contributions . . . . . . . . . . . . . . . . . . . . . . . . . . . . . . . . . . 223 10.3 Future Work . . . . . . . . . . . . . . . . . . . . . . . . . . . . . . . . . . . 225
Context: We have concluded the dissertation on quality of process modeling using BPMN by following a product-oriented perspective and using a model-driven approach. Objective: To survey the work done in the dissertation and forecast future directions for that work. Method: We highlight the main aspects covered by the previous chapters, our main contributions, as well as the future work that we intend to undertake to pursue the open research path. Results: The list of main contributions and the plan for future research are the main outputs of this chapter. Limitations: Being a summary, this chapter only shallowly covers the work done. Conclusion: The chapter gives a glimpse on the work done and to be pursued in search of quality of process modeling using BPMN. 221
10. C ONCLUSION
10.1
10.1. Synthesis
Synthesis
BPMN is the most popular process modeling language. However, it reveals limitations. We had to confirm whether those limitations were relevant enough to affect the quality of process models produced using actual BPMN tools. This was done by checking whether current BPMN tools implementing the BPMN standard could rigorously verify process models, and ultimately produce good quality artifacts. The achieved results corroborate the idea that the limitations in the BPMN standard, i.e. rules informally specified in natural language, contribute for poor quality of process models, given the weakness of available BPMN tools in terms of models’ verification. So, the main contribution intended by this dissertation was the improving of the quality of process models at the design phase. We add to the BPMN 2.0 metamodel, for enforcing the process diagrams’ quality (namely regarding their correctness): (1) well-formedness rules defined in the BPMN standard document in natural language; (2) best-practices rules promoted by BPMN experts in the literature. We also derived and add to the BPMN metamodel measures that could help process modelers be knowledgeable of BPMN models’ internal attributes (e.g. complexity, size). These measures can also provide process modelers with hints and guidelines for improving models’ external quality characteristics (e.g. correctness). Grounded in the research problems and research questions, the purpose of the dissertation was summarized in the following thesis statement: in order to improve BPMN models’ quality we propose a model-driven approach capable of formalizing: (i) wellformedness rules; (ii) measures for assessment of models characteristics (chapter 1). In chapter 2 current process modeling languages were surveyed and assessed. From those languages we chose BPMN to assess the quality of process models. However, BPMN has weaknesses that we confirmed through a survey upon BPMN tools (chapter 3). In chapter 4 we conducted a systematic review regarding BPMN process models verification. We concluded that most of the research works surveyed addressed essentially the properties verification aspects, i.e., the papers were related with checking of domainindependent properties (e.g. deadlock, liveness). The aspects considered relevant for this dissertation were insufficiently covered by those studies, namely the BPMN wellformedness/best-practices rules checking, as well as the measurement dimension, and empirical validation of BPMN process models. Another literature review was made regarding the research work done about measurement of BPMN models quality characteristics. The limitations pointed out to the surveyed work were: (1) no theoretical validation of proposed measures; as well as (2) the computation of measures without considering the well-formedness of BPMN models. To circumvent these limitations, it was proposed the elicitation of a set of BPMN measures aligned with the BPMN 2.0 standard. 222
10. C ONCLUSION
10.2. Contributions
In chapter 5 we formalized and implemented BPMN rules, informally specified in the BPMN 2.0 standard, as well as best-practices rules, advocated by BPMN practitioners. Since property verification (e.g. deadlock, liveness) is a topic already covered by several other approaches, it was not addressed by the present dissertation. In chapter 6 we theoretically validated a set of BPMN measures through the BPMN measurement framework. Following the guidelines of the framework, we defined measurement goals and a set of intuitive hypotheses to be validated. Next, we also identified internal attributes of interest and validated related base measures against a set of theoretically properties. The base measures were intended to quantify BPMN models’ internal attributes. They were also designated as independent variables of a prediction model for BPMN models’ correctness. Finally, we derived indirect measures for quantifying the dependent variable related to an external attribute (correctness) of BPMN models. The proposed framework for BPMN models measurement requires further instantiation with other measures, in order to assess its general suitability. Chapter 7 brought BPMN to the context of MDE, and presented a framework for BPMN model-based testing. The MDE approach was instantiated through BPMN wellformedness rules implementation, as well as with the definition and construction of the transformations needed for data collection to allow empirical studies in the following chapters. Albeit the approach brought the BPMN to the context of MDE, using different kinds of tools and languages, we are aware that more work can be done regarding process modeling transformations, using DSLs, and their formalization. Chapter 8 presented empirical evidence of the feasibility of a MDE approach to BPMN model checking. The well-formedness rules formalized in chapter 5 were used for that purpose. The overall conclusion is that well-formedness rules have a significant impact upon the final quality characteristic of BPMN models’ correctness. In chapter 9 was performed a regression analysis in order to provide empirical evidence of the usefulness of the BPMN measures proposed in chapter 6. Those measures were used as exploratory variables in a Binary Logistic Regression model that allows to forecast potentially defective BPMN models. The samples used in the experiments of the two previously mentioned chapters were collected from examples hosted in repositories from tool makers, as well as BPMN models built by students, as surrogates of professional BPMN process modelers. Further replication studies must be done to corroborate the achieved results.
10.2
Contributions
In the following sections we summarize some of the major and minor contributions of our dissertation. The classification assigned has essentially to do with the expected impact and future reuse of the contribution, rather than the work required to achieve it. 223
10. C ONCLUSION
10.2.1 10.2.1.1
10.2. Contributions
Major Contributions BPMN Rules Formalization
A formalization of BPMN well-formedness rules as OCL invariants, was presented in section 5.2. The derived well-formedness and best-practices rules were attached to the BPMN metamodel in order to enhance the BPMN models’ verification. 10.2.1.2
BPMN Measures
The base measures are intend to quantify various BPMN models’ internal attributes (e.g. size, complexity, etc.) and are the independent variables of a prediction model for BPMN measurement. We proposed a set of theoretical and empirically validated base measures for the internal attributes of BPMN models. Those measures could help during the course of process design, to take corrective actions based on the assessment of process models’ internal characteristics. They can also provide a rationale for adopting best-practice modeling rules in order to enhance quality in process models.
10.2.2 10.2.2.1
Minor Contributions A Taxonomy for Process Modeling Languages
To address the research topic of quality in process modeling, we needed to choose, according to certain criteria, a language suitable for the specification and assessment of the quality attributes in process models. For this purpose, is proposed a pragmatic taxonomy in section 2.5.1 to enable a grounded justification of the choice made. 10.2.2.2
A Survey on Process Modeling Languages
In the chapter 2 we surveyed and rank a set of semi-formal and formal/executable process modeling languages, according to the aforementioned taxonomy. 10.2.2.3
Detected Flaws in the BPMN 2.0 Metamodel
In section 3.3.2, after BPMN metamodel analysis we detected a couple of flaws in the standard specification and suggested some workarounds to face them. 10.2.2.4
Survey on BPMN Tools Maturity
Since, in this dissertation, we were concerned mainly with the quality aspects of process modeling, we wanted to ascertain the effectiveness of current BPMN tools to ensure the quality of the generated models. We conclude in section 3.4.3 that none of the tools from the sample, fully detect the rules violations. 224
10. C ONCLUSION
10.2.2.5
10.3. Future Work
BPMN Measurement Terminology
In section 6.2 we set up BPMN measurement terminology, grounded on concepts and definitions anchored upon the metrology vocabulary and the industry’s set of standards on quality, on measurement concepts from the discipline of Software Engineering, as well as on an the SMO ontology. 10.2.2.6
A Framework for BPMN Measurement
In section 6.3 we proposed a framework for BPMN measurement which allows the customized setting up of guidelines for design and definition of sound BPMN measures. This framework was based upon the measure definition process GQM/MEDEA, a systematic approach from software measurement. 10.2.2.7
BPMN Model-Based Testing Framework
The BPMN model-based testing framework presented in Figure 7.4 is a model-driven engineering approach that guides the design and execution of a set of test cases against an enhanced version of the BPMN metamodel with well-formedness rules. 10.2.2.8
BPMN Empirical Studies
In chapters 8 and 9 we conducted two sets of empirical studies using BPMN models. In those studies were tested several hypotheses regarding the quality of BPMN models samples. Using the Binary Logistic Regression model, we were able to demonstrate its suitability for estimating the probability of a given BPMN model being faulty, giving as input the measures of its internal attributes.
10.3
Future Work
The future work intended to be done, for development of the paths traversed by this dissertation, includes the following: 1. BPMN patterns and anti-patterns – Continue the evolution of the catalog of BPMN common modeling errors (see a sample in Appendix B), based on current and new versions of the BPMN standard. This catalog depicts about one hundred BPMN model snippets with rules violations together with the model counterpart without errors. Those BPMN model snippets were the test cases used in the framework for BPMN model-based testing, through which we tested the OCL invariants and operations implemented in the BPMN metamodel. 2. BPMN standard – Contribute to the OMG’s future version of BPMN standard, with a document based on the above mentioned catalog, as well as with the formalization of other rules that the community consider important. We expected by 225
10. C ONCLUSION
this way, to contribute for the uniformization of the BPMN rules interpretation by BPMN tool makers, as well as for an improvement in the verification capabilities of BPMN modeling tools. 3. Technology – Build an open source tool that allows, in practice, the well-formedness rules or best-practices rules reinforcement. This tool should provide hints (a depiction of a model with the error found and its corrected version, as in Appendix B), guiding the process modelers in the overcoming of non-compliances in BPMN models. 4. New Empirical Studies – Conduct empirical studies for measuring the effects of the usage of the BPMN model checking tool on BPMN language’s learning curve. The studies should prioritize BPMN rules and constructs by clusters and give major relevance to the most used clusters of BPMN elements (see section 8.4.3). We expect that a tool that implements the BPMN metamodel with the well-formedness rules embedded, can contribute to decrease the modelers’ learning curve. 5. Generalization of Approach – Conduct studies regarding other external attributes of BPMN models (e.g. understandability) using the same approach as the one presented in this dissertation for correctness. 6. Process-Oriented Quality – Use the results of this dissertation, regarding correctness of BPMN models, to support a new research line about quality upon BPMN process modeling, in a process-oriented perspective. The general ideas concerning this research work we intend to develop in future are presented in Appendix H.
226
Bibliography
[Aab96]
Anthony A. Aaby. Introduction to Programming Languages. http: //www.emu.edu.tr/aelci/Courses/D-318/D-318-Files/ plbook/, Dec 1996.
[Aca13]
AcademyHealth. Health Services Research Methods and Techniques. http://www.hsrmethods.org/glossary.aspx, Feb. 2013.
[AH10]
Wil van der Aalst and Arthur ter Hofstede. Workflow Patterns home page. http://www.workflowpatterns.com/, Dec. 2010.
[AL06]
Krishna B. Athreya and Soumendra N. Lahiri. Measure Theory and Probability Theory. Springer Texts in Statistics. Springer Science+Business Media, LLC, 2006.
[All10]
Thomas Allweyer. BPMN 2.0: Introduction to the Standard for Business Process Modeling. Herstellung and Verlag: Books on Demand GmbH, Norderstedt, 2010.
[ALMN99]
David E. Avison, Francis Lau, Michael D. Myers, and Peter Axel Nielsen. Action research. Communications of the ACM, 42(1):94–97, 1999.
[Ant96]
Annie I. Anton. Goal-Based Requirements Analysis. In Proceedings of the Second International Conference on Requirements Engineering, pages 136– 144. IEEE, 1996.
[ARGP06]
E.R. Aguilar, F. Ruiz, F. García, and M. Piattini. Evaluation measures for business process models. In Proceedings of the 2006 ACM symposium on Applied computing, pages 1567–1568. ACM, 2006.
[Awa07]
Ahmed Awad. BPMN-Q: A Language to Query Business Processes. In Proceedings of the EMISA, volume 119, pages 115–128, 2007. 227
B IBLIOGRAPHY [AWW11]
Ahmed Awad, Matthias Weidlich, and Mathias Weske. Visually specifying compliance rules and explaining their violations for business processes. Journal of Visual Languages & Computing, 22(1):30–55, 2011.
¨ [B12]
Egon Börger. Approaches to modeling business processes: a critical analysis of BPMN, workflow patterns and YAWL. Software & Systems Modeling, 11(3):305–318, 2012.
[BAGaB11]
Ankica Bariši´c, Vasco Amaral, Miguel Goulão, and Bruno Barroca. How to reach a usable DSL? Moving toward a Systematic Evaluation. In Proceedings of the 5th International Workshop on Multi-Paradigm Modeling (MPM’2011), 2011.
[BAM10]
Sérgio Bryton, Fernando Brito e Abreu, and Miguel Monteiro. Reducing Subjectivity in Code Smells Detection: Experimenting with the Long Method. In Proceedings of the 7th International Conference on the Quality of Information and Communications Technology (QUATIC’2010), volume Thematic Track on Quality in ICT Reengineering and Refactoring, pages 337–342. IEEE Computer Society Press, 2010.
[BB01]
Erwan Breton and Jean Bézivin. Process-centered model engineering. In Proceedings of the Fifth IEEE International Enterprise Distributed Object Computing Conference, 2001. EDOC’01, pages 179–182. IEEE, 2001.
[BBKK04]
J. Bae, H. Bae, S.H. Kang, and Y. Kim. Automatic control of workflow processes using ECA rules. IEEE Transactions on Knowledge and Data Engineering, 16(8):1010–1023, 2004.
[BBM96]
V.R. Basili, L.C. Briand, and Walcélio L Melo. A validation of objectoriented design metrics as quality indicators. IEEE Transactions on Software Engineering, 22(10):751–761, 1996.
[BCK03]
Len Bass, Paul Clements, and Rick Kazman. Software Architecture in Practice. SEI Series in Software Engineering. Addison-Wesley Pearson Education, Boston, second edition, 2003.
[BCR94]
Victor R. Basili, Gianluigi Caldiera, and H Dieter Rombach. The goal question metric approach. Encyclopedia of software engineering, 2:528–532, 1994.
[BD00]
Christie Bolton and Jim Davies. Activity graphs and processes. In Proceedings of the Integrated Formal Methods, pages 77–96. Springer, 2000.
[BD12]
Paolo Bocciarelli and Andrea D’Ambrogio. Automated performance analysis of business processes. In Proceedings of the 2012 Symposium 228
B IBLIOGRAPHY on Theory of Modeling and Simulation-DEVS Integrative M&S Symposium, page 10. Society for Computer Simulation International, 2012. [BDG+ 08]
Paul Baker, Zhen Ru Dai, Jens Grabowski, Ina Schieferdecker, and Clay Williams. Model-Driven Testing: Using the UML Testing Profile. SpringerVerlag, first edition, 2008.
[BeA01]
Fernando Brito e Abreu. Using OCL to formalize object oriented metrics definitions. In Tutorial in 5th International ECOOP Workshop on Quantitative Approaches in Object-Oriented Software Engineering (QAOOSE 2001), 2001.
[BeAPFC10]
Fernando Brito e Abreu, Raquel Porciúncula, Jorge Freitas, and José Carlos Costa. Definition and Validation of Complexity Metrics for ITSM Process Models. 7th International Conference on the Quality of Information and Communications Technology (QUATIC’2010), pages 79–88, Sept. 2010.
[BEEM95]
Lionel Briand, Khaled El Emam, and Sandro Morasca. Theoretical and empirical validation of software product measures. International Software Engineering Research Network, Technical Report ISERN-95-03, 1995.
[BHR84]
Stephen D Brookes, Charles AR Hoare, and Andrew W Roscoe. A theory of communicating sequential processes. Journal of the ACM (JACM), 31(3):560–599, 1984.
[BMB96]
Lionel C. Briand, Sandro Morasca, and Victor R. Basili. Property-based software engineering measurement. IEEE Transactions on Software Engineering, 22(1):68–86, 1996.
[BMB02]
Lionel C. Briand, Sandro Morasca, and Victor R. Basili. An operational process for goal-driven definition of measures. IEEE Transactions on Software Engineering, 28(12):1106–1125, 2002.
[BMNT05]
Jorge Biolchini, P Gomes Mian, A Candida Cruz Natali, and G Horta Travassos.
Systematic review in software engineering.
Technical
Report 05, System Engineering and Computer Science Department COPPE/UFRJ, 2005. [BO10]
Dominik Birkmeier and Sven Overhage. Is BPMN Really First Choice in Joint Architecture Development? An Empirical Study on the Usability of BPMN and UML Activity Diagrams for Business Users. In George T. Heineman, Jan Kofron, and Frantisek Plasil, editors, Research into Practice – Reality and Gaps, volume 6093 of Lecture Notes in Computer Science, pages 119–134. Springer Berlin Heidelberg, 2010. http: //dx.doi.org/10.1007/978-3-642-13821-8_10. 229
B IBLIOGRAPHY [BPG+ 04]
Paolo Bresciani, Anna Perini, Paolo Giorgini, Fausto Giunchiglia, and John Mylopoulos. Tropos: An agent-oriented software development methodology. Autonomous Agents and Multi-Agent Systems, 8(3):203–236, 2004.
[BPJ+ 10]
Lars Braubach, Alexander Pokahr, Kai Jander, Winfried Lamersdorf, and Birgit Burmeister. Go4Flex: Goal-Oriented Process Modelling. In Mohammed Essaaidi, Michele Malgeri, and Costin Badica, editors, Intelligent Distributed Computing IV, volume 315, pages 77–87. Springer, 2010.
[BPM04]
BPMI. Business Process Modeling Notation (BPMN) v1.0, May 2004.
[BPM11]
OMG BPMN2. Business Process Model and Notation (BPMN) v2.0, January 2011.
[BPV05]
Jan van Bon, Mike Pieper, and Annelies van der Veen. Foundations of IT Service Management: Based on ITIL, ITIL Version 2. Van Haren Publishing, 2005.
[Bru04]
Warren Brussee. Statistics for Six Sigma Made Easy! McGraw-Hill, 2004.
[BRvU00]
Jörg Becker, Michael Rosemann, and Christoph von Uthmann. Guidelines of business process modeling. In Business Process Management, pages 241–262. Springer, 2000.
[BS11]
E. Börger and O. Sörensen. BPMN core modeling concepts: Inheritancebased execution semantics. In Handbook of Conceptual Modeling, pages 287–332. Springer, 2011.
[BT08]
Egon Börger and Bernhard Thalheim. A Method for Verifiable and Validatable Business Process Modeling, volume 5316 of Lecture Notes in Computer Science – Advances in Software Engineering. Springer Berlin / Heidelberg, 2008.
[BV10]
M.F. Bertoa and A. Vallecillo. Quality attributes for software metamodels. Proceedings of the 13th TOOLS Workshop on Quantitative Approaches in Object-Oriented Software Engineering (QAOOSE 2010), July 2010. Málaga, Spain.
[BW10]
Jeremy W. Bryans and Wei Wei. Formal analysis of bpmn models using event-b. In Stefan Kowalewski and Marco Roveri, editors, Formal Methods for Industrial Critical Systems, volume 6371 of Lecture Notes in Computer Science, pages 33–49. Springer Berlin Heidelberg, 2010. http: //dx.doi.org/10.1007/978-3-642-15898-8_3. 230
B IBLIOGRAPHY [Car07]
Jorge Cardoso. Business process quality metrics: log-based complexity of workflow patterns. In On the Move to Meaningful Internet Systems 2007: CoopIS, DOA, ODBASE, GADA, and IS, pages 427–434. Springer, 2007.
[CBeA09]
Anacleto Correia and Fernando Brito e Abreu. Integrating IT service management within the Enterprise Architecture. In Proceedings of the Fourth International Conference on Software Engineering Advances, pages 553–558. IEEE, 2009.
[CBeA10a]
Anacleto Correia and Fernando Brito e Abreu. Model-Driven Service Level Management. Phd research plan, FCT/UNL, September 2010.
[CBeA10b]
Anacleto Correia and Fernando Brito e Abreu. Model-driven service level management. In Mechanisms for Autonomous Management of Networks and Services, pages 85–88. Springer, 2010.
[CBeA12]
Anacleto Correia and Fernando Brito e Abreu. Adding preciseness to BPMN Models. In Proceedings of the 4th Conference on ENTERprise Information Systems (CENTERIS’2012), volume 5 of Procedia Technology, pages 407–417. Elsevier, 2012.
[CBeAA11a]
Anacleto Correia, Fernando Brito e Abreu, and Vasco Amaral. SLALOM: a language for Service Level Agreement specification and monitoring. In Proceedings on the 3th INForum. Universidade de Coimbra, 2011.
[CBeAA11b]
Anacleto Correia, Fernando Brito e Abreu, and Vasco Amaral. SLAME: A Service Level Agreements Method for Elicitation. In Proceedings on the CAPSI’2011, 2011.
[CC97]
Ronald Christensen and R Christensen. Log-Linear Models and Logistic Regression. Springer Texts in Statistics. Springer-Verlag New York, Inc., second edition, 1997.
[CdO13]
Andre L. N. Campos and Toacy Cavalcante de Oliveira. Software Processes with BPMN: An Empirical Analysis. In Proceedings of the ProductFocused Software Process Improvement, pages 338–341. Springer, 2013. http://dx.doi.org/10.1007/978-3-642-39259-7_29.
[Che76]
Peter Pin-Shan Chen. The entity-relationship model - toward a unified view of data. ACM Trans. Database Syst., 1(1):9–36, 1976.
[CKO92]
Bill Curtis, Marc I. Kellner, and Jim Over. Process modeling. Commun. ACM, 35(9):75–90, September 1992. http://doi.acm.org/10. 1145/130994.130998. 231
B IBLIOGRAPHY [CL09]
Lawrence Chung and Julio Cesar Prado Leite. On Non-Functional Requirements in Software Engineering. In Conceptual Modeling: Foundations and Applications, pages 363–379. Springer-Verlag, 2009.
[CMBC93]
Giovanni Chiola, Marco Ajmone Marsan, Gianfranco Balbo, and Gianni Conte. Generalized stochastic Petri nets: A definition at the net level and its implications. IEEE Transactions on Software Engineering, 19(2):89–107, 1993.
[CMNR06]
J. Cardoso, J. Mendling, G. Neumann, and H.A. Reijers. A Discourse on Complexity of Process Models. In J. Eder and S. Dustdar, editors, Proceedings of the Business Process Management 2006 Workshops, volume LNCS 4103, pages 115–126, 2006.
[CN95]
Lawrence Chung and Brian A Nixon. Dealing with non-functional requirements: three experimental studies of a process-oriented approach. In Proceedings of the 17th International Conference on Software Engineering (ICSE 1995), pages 25–25. IEEE, 1995.
[CNW81]
Nigel Cross, John Naughton, and David Walker. Design method and scientific method. Design studies, 2(4):195–201, 1981.
[CNYM00]
Lawrence Chung, Brian A. Nixon, Eric Yu, and John Mylopoulos. NonFunctional Requirements in Software Engineering. Kluwer Academic Publishers, Boston, 2000.
[Cod70]
E. F. Codd. A relational model of data for large shared data banks. Commun. ACM, 13(6):377–387, 1970.
[Cro00]
Stephen Crouch. Process Modelling for Requirements Capture. PhD thesis, University Of Southampton, 2000.
[CT12]
Michele Chinosi and Alberto Trombetta. BPMN: An introduction to the standard. Computer Standards & Interfaces, 34(1):124–134, 2012.
[Dav93]
Thomas H. Davenport. Process innovation: reengineering work through information technology. Harvard Business School Press, 1993.
[DDDGB08]
Gero Decker, Remco Dijkman, Marlon Dumas, and Luciano GarcíaBañuelos. Transforming BPMN diagrams into YAWL nets. In Business Process Management, pages 386–389. Springer, 2008.
[DDO07]
Remco M. Dijkman, Marlon Dumas, and Chun Ouyang. Formal Semantics and Analysis of BPMN Process Models. Technical report, Queensland University of Technology, 2007. http://eprints.qut.edu.au/ 7115/. 232
B IBLIOGRAPHY [DDO08]
Remco M Dijkman, Marlon Dumas, and Chun Ouyang. Semantics and analysis of business process models in BPMN. Information and Software Technology, 50(12):1281–1294, 2008.
[DFL91]
Anne Dardenne, Stephen Fickas, and Axel van Lamsweerde.
Goal-
directed concept acquisition in requirements elicitation. In Proceedings of the 6th international workshop on Software specification and design, pages 14–21. IEEE Computer Society Press, 1991. [dFS08]
Pedro M. Gonzalez del Foyo and José Reinaldo Silva. Using time Petri nets for modelling and verification of timed constrained workflow systems. In Proceedings of the ABCM Symposium Series in Mechatronics, volume 3, pages 471–478, 2008.
[DGMR03]
Islay Davies, Peter Green, Simon Milton, and Michael Rosemann. Using meta models for the comparison of ontologies. In Proceedings of the Eighth CAiSE/IFIP8.1 International Workshop on Evaluation of Modeling Methods in Systems Analysis and Design, pages 16–17, 2003.
[DHP05]
G. Dallons, P. Heymans, and I. Pollet. A Template-based Analysis of GRL. In Proceedings of the EMMSAD, volume 5, pages 493–504, 2005.
[Dij82]
E. W. Dijkstra. EWD 447: On the role of scientific thought. Selected Writings on Computing:
A Personal Perspective, pages 60–66, 1982.
http://www.cs.utexas.edu/users/EWD/transcriptions/ EWD04xx/EWD447.html. [DP11]
K. Decreus and G. Poels. A goal-oriented requirements engineering method for business processes. Information Systems Evolution, pages 29– 43, 2011.
[DR98]
Jörg Desel and Wolfgang Reisig. Place/transition petri nets. In Wolfgang Reisig and Grzegorz Rozenberg, editors, Lectures on Petri Nets I: Basic Models, volume 1491 of Lecture Notes in Computer Science, pages 122–173. Springer Berlin Heidelberg, 1998.
[DRC+ 06]
N. Debnath, D. Riesco, M. P. Cota, J. B. Garcia Perez-Schofield, and D. R. M. Uva. Supporting the SPEM with a UML Extended Workflow Metamodel. In Proceedings of the IEEE International Conference on Computer Systems and Applications (AICCSA), pages 1151–1154, 2006.
[DS02]
Morris H. DeGroot and Mark J. Schervish.
Probability and Statistics.
Addison-Wesley, Pearson Education, Inc., fourth edition, 2002. 233
B IBLIOGRAPHY [DSP09]
K. Decreus, M. Snoeck, and G. Poels. Practical Challenges for Methods Transforming i* Goal Models into Business Process Models. In Proceedings of the 17th IEEE International Requirements Engineering Conference. RE ’09., pages 15–23. IEEE, 2009.
[DVDA04]
J. Dehnert and W.M.P. Van Der Aalst. Bridging the gap between business models and workflow specifications. International Journal of Cooperative Information Systems, 13(03):289–332, 2004.
[DVDATH05]
M. Dumas, W. Van Der Aalst, and A. Ter Hofstede. Process-aware information systems. Wiley Online Library, 2005.
[DvLF93]
Anne Dardenne, Axel van Lamsweerde, and Stephen Fickas. directed requirements acquisition.
Goal-
Science of Computer Programming,
20(1):3–50, 1993. [Ecl11]
Eclipse. Atlas Transformation Language (ATL) v3.2.0. http://www. eclipse.org/atl/, 2011.
[EFLR98]
Andy Evans, Robert France, Kevin Lano, and Bernhard Rumpe. Developing the UML as a formal modelling notation. In Proceedings of the UML’98, LNCS, volume 1618, 1998.
[Erl07]
Thomas Erl. SOA: Principles of Service Design. Service-Oriented Computing Series. Prentice Hall, 2007.
[FABD10]
Corradini Flavio, Polzonetti Alberto, Re Barbara, and Falcioni Damiano. An eclipse plug-in for formal verification of bpmn processes. In Proceedings of the Communication Theory, Reliability, and Quality of Service (CTRQ), 2010 Third International Conference on, pages 144–149. IEEE, 2010.
[Fah08]
Dirk Fahland. Translating UML2 Activity Diagrams to Petri nets for analyzing IBM WebSphere Business Modeler process models. InformatikBerichte 226, Humboldt-Universität zu Berlin, 2008.
[Fav04]
Jean-Marie Favre. Foundations of meta-pyramids: languages vs. metamodels – Episode II. Story of Thotus the Baboon. Language Engineering for Model-Driven Software Development, 4101, 2004.
[Fav05]
Jean-Marie Favre. Foundations of Model (Driven) (Reverse) Engineering : Models – Episode I: Stories of The Fidus Papyrus and of The Solarus. In Jean Bezivin and Reiko Heckel, editors, Proceedings of the Language Engineering for Model-Driven Software Development. Internationales Begegnungs- und Forschungszentrum für Informatik (IBFI), Schloss Dagstuhl, Germany, 2005. 234
B IBLIOGRAPHY [FCBeA08]
Jorge Freitas, Anacleto Correia, and Fernando Brito e Abreu. An Ontology for IT Services. In Proceedings of the 13th Conference on Software Engineering and Databases (JISBD’2008), 2008.
[FELR98]
Robert France, Andy Evans, Kevin Lano, and Bernhard Rumpe. The UML as a formal modeling notation. Computer Standards & Interfaces, 19(7):325–334, 1998.
[FFK+ 11]
Dirk Fahland, Cédric Favre, Jana Koehler, Niels Lohmann, Hagen Völzer, and Karsten Wolf. Analysis on demand: Instantaneous soundness checking of industrial business process models. Data & Knowledge Engineering, 70(5):448–466, 2011.
[Fie09]
Andy Field. Discovering Statistics Using SPSS, Second Edition. SAGE Publications Ltd, third edition, 2009.
[Fle10]
Albert Fleischmann. What Is S-BPM?, volume 85 of Communications in Computer and Information Science, pages 85–106. Springer Berlin Heidelberg, 2010.
[FMS11]
Sanford Friedenthal, Alan Moore, and Rick Steiner. A Practical Guide to SysML: The Systems Modeling Language. Morgan Kaufmann, 2nd edition, 2011.
[FN05]
Jean-Marie Favre and Tam Nguyen. Towards a megamodel to model software evolution through transformations. Electronic Notes in Theoretical Computer Science, 127(3):59–74, 2005.
[FP98]
N.E. Fenton and S.L. Pfleeger. Software metrics: a rigorous and practical approach. PWS Publishing Co., 1998.
[FPMT01]
A. Fuxman, M. Pistore, J. Mylopoulos, and P. Traverso. Model checking early requirements specifications in Tropos. In Proceedings of the Fifth IEEE International Symposium on Requirements Engineering,, pages 174– 181. IEEE, 2001.
[FPPR12]
Damiano Falcioni, Andrea Polini, Alberto Polzonetti, and Barbara Re. Direct verification of BPMN processes through an optimized unfolding technique. In Proceedings of the 12th International Conference on Quality Software (QSIC 2012), pages 179–188. IEEE, 2012.
[Fra03]
David S. Frankel. Enterprise Systems.
BPM and MDA: The Rise of Model-Driven www.bptrends.com/publicationfiles/
06-03WPBPMandMDAWhitepaperFrankel11.pdf, June 2003. 235
B IBLIOGRAPHY [FSS+ 12a]
Albert Fleischmann, Werner Schmidt, Christian Stary, Stefan Obermeier, and Egon Börger. From Language Acquisition to Subject-Oriented Modeling Subject-Oriented Business Process Management, pages 9–23. Springer Berlin Heidelberg, 2012.
[FSS+ 12b]
Albert Fleischmann, Werner Schmidt, Christian Stary, Stefan Obermeier, and Egon Börger. S-BPM Method by Comparison Subject-Oriented Business Process Management, pages 269–291. Springer Berlin Heidelberg, 2012.
[Ga08]
Miguel Goulão. Component-Based Software Engineering: a Quantitative Approach. PhD thesis, FCT/UNL, 2008.
[Gao06]
Yi Gao.
BPMN-BPEL Transformation and Round Trip Engineering.
Technical report, eClarus Software, 2006.
http://eclarus.com/
resources/BPMN_BPEL_Mapping.pdf. [GBC+ 06]
Félix García, Manuel F. Bertoa, Coral Calero, Antonio Vallecillo, Francisco Ruíz, Mario Piattini, and Marcela Genero. Towards a consistent terminology for software measurement. Information and Software Technology, 48(8):631–644, 2006.
[GBR07]
Martin Gogolla, Fabian Buttner, and Mark Richters. USE: A UML-based specification environment for validating UML and OCL. Science of Computer Programming, pages 69:27–34, 2007.
[GD13]
Pieter Van Gorp and Remco Dijkman. A visual token-based formalization of BPMN 2.0 based on in-place transformations. Information and Software Technology, 55(2):365–394, 2013.
[GH13]
B. Galloway and G. P. Hancke. Introduction to Industrial Control Networks. Communications Surveys & Tutorials, IEEE, 15(2):860–880, 2013.
[Gia01]
George M. Giaglis. A taxonomy of business process modeling and information systems modeling techniques. International Journal of Flexible Manufacturing Systems, 13(2):209–228, 2001.
[GKMP04]
Paolo Giorgini, Manuel Kolp, John Mylopoulos, and Marco Pistore. The Tropos Methodology Methodologies and Software Engineering for Agent Systems, volume 11 of Multiagent Systems, Artificial Societies, and Simulated Organizations, pages 89–106. Springer US, 2004.
[GL06]
Volker Gruhn and Ralf Laue. Complexity metrics for business process models. In Proceedings of the 9th international conference on business information systems (BIS 2006), volume Lecture Notes in Informatics, 85, 2006.
[GL07]
Volker Gruhn and Ralf Laue. What business process modelers can learn from programmers. Science of Computer Programming, 65(1):4–13, 2007. 236
B IBLIOGRAPHY [GMS05]
P. Giorgini, J. Mylopoulos, and R. Sebastiani. Goal-oriented requirements analysis and reasoning in the Tropos methodology. Engineering Applications of Artificial Intelligence, 18(2):159–171, 2005.
[GR05]
P. Green and M. Rosemann.
Ontological analysis of business sys-
tems analysis techniques: experiences and proposals for an enhanced methodology. Business systems analysis with ontologies, pages 1–27, 2005. [GRI05]
P.F. Green, M. Rosemann, and M. Indulska. Ontological evaluation of enterprise systems interoperability using ebXML. IEEE Transactions on Knowledge and Data Engineering, 17(5):713–725, 2005.
[Gro07]
Alexander Grosskopf. xBPMN - Formal Control Flow Specification of a BPMN based Process Execution Language. PhD thesis, Hasso-PlattnerInstitute, 2007.
[GT09]
D. Gagne and A. Trudel. Time-BPMN. In Proceedings of the IEEE Conference on Commerce and Enterprise Computing, CEC ’09, pages 361–367, 2009.
[GW00]
Ignacio E Grossmann and Arthur W Westerberg. Research challenges in process systems engineering. AIChE Journal, 46(9):1700–1703, 2000.
[Har04]
P. Harmon.
The OMG’s Model Driven Architecture and BPM,
May 2004.
http://www.bptrends.com/publicationfiles/
05-04NLMDAandBPM.pdf. [Har07]
P. Harmon. Business Process Change: a guide for business managers and BPM and Six Sigma Professionals. Morgan Kaufmann, 2007.
[HBS00]
Adnan Hassan, Mohd Shariff Nabi Baksh, and Awaluddin M. Shaharoun. Issues in quality engineering research. International Journal of Quality & Reliability Management, 17(8):858–875, 2000.
[HC93]
Michael Hammer and James Champy. Reengineering the Corporation: A Manifesto for Business Revolution. Harperbusiness, Brealey, London, 1993.
[HCKP09]
J.B. Hill, M. Cantara, M. Kerremans, and D.C. Plummer. Magic quadrant for business process management suites. Gartner Research, 164485, 2009.
[HCV10]
Peter Heisig, P. John Clarkson, and Sandor Vajna. Modelling and Management of Engineering Processes. Springer-Verlag, London, 1st edition, 2010.
[Hef04]
Jeff Heflin. An Introduction to the OWL Web Ontology Language, 2004. 237
B IBLIOGRAPHY [HKP11a]
R. Heinrich, A. Kappe, and B. Paech. Modeling Quality Information within Business Process Models. In Proceedings of the 4th SQMB Workshop, TUM-I1104, pages 4–13, 2011.
[HKP11b]
R. Heinrich, A. Kappe, and B. Paech. Tool Support for the Comprehensive Modeling of Quality Information within Business Process Models. In Proceedings of the Enterprise Modelling and Information Systems Architectures (EMISA 2011), page 213, 2011.
[HMVHR06]
J. Hernandez-Matias, A. Vizan, A. Hidalgo, and J. Rios. Evaluation of techniques for manufacturing process analysis. Journal of Intelligent Manufacturing, 17(5):571–583, 2006.
[Hoa78]
Charles Antony Richard Hoare. Communicating sequential processes. Communications of the ACM, 21(8):666–677, 1978.
[Hoa04]
C. A. R. Hoare. Communicating Sequential Processes. Prentice Hall International, 2004.
[Hob81]
Eric Hobsbawm. The Age of Revolution: Europe 1789–1848. Little, Brown Book Group Limited, 1981.
[Hol09]
Jon Holt. A Pragmatic Guide to Business Process Modelling. BCS - British Computer Society, Swindon SN2 1FA, UK, 2nd edition, 2009.
[HOS06]
Kees van Hee, Olivia Oanea, and Natalia Sidorova. Colored Petri Nets to Verify Extended Event-Driven Process Chains. In Proceedings of the 4th Workshop on Modelling, Simulation, Verification and Validation of Enterprise Information Systems (MSVVEIS06), pages 76–85, 2006.
[HPSVH03]
I. Horrocks, P.F. Patel-Schneider, and F. Van Harmelen. From SHIQ and RDF to OWL: The making of a web ontology language. Web semantics: science, services and agents on the World Wide Web, 1(1):7–26, 2003.
[HR85]
Frederick Hayes-Roth. Rule-based systems. Commun. ACM, 28(9):921– 932, 1985.
[HW02]
James K. Huggins and Charles Wallace. An Abstract State Machine Primer.
Technical report, Computer Science Department, Michigan
Technological University, 4 December 2002. [HW11]
Paul Harmon and Celia Wolf. Business Process Modeling Survey, December 2011. BPTrends.
[IEE98]
IEEE. Std 1061-1998 – IEEE Standard for a Software Quality Metrics Methodology, 1998. 238
B IBLIOGRAPHY [IMR09]
Marta Indulska, Michael zur Muehlen, and Jan Recker.
Measur-
ing Method Complexity: The Case of the Business Process Modeling Notation.
Technical report, BPM Center Report, Apr 2009.
www.BPMcenter.org. [ISO00]
ISO. ISO 9004:2000 - Quality management systems – Guidelines for performance improvements, 2000. International Organization for Standardization.
[ISO03]
ISO. ISO/IEC TR 14143-3:2003 – Information technology – Software measurement – Functional size measurement – Part 3: Verification of functional size measurement methods, 2003. International Organization for Standardization.
[ISO04a]
ISO. ISO/IEC 15504-4:2004 – Information technology – Process assessment – Part 4: Guidance on use for process improvement and process capability determination, 2004. International Organization for Standardization.
[ISO04b]
ISO. ISO/IEC 90003:2004 - Software engineering – Guidelines for the application of ISO 9001:2000 to computer software, 2004. International Organization for Standardization.
[ISO05a]
ISO. ISO 9000-1:2005 - Quality management systems – Fundamentals and vocabulary, 2005. International Organization for Standardization.
[ISO05b]
ISO. ISO/IEC 25000:2005 – Software Engineering – Software product Quality Requirements and Evaluation (SQuaRE) – Guide to SQuaRE, 2005. International Organization for Standardization.
[ISO07a]
ISO. ISO/IEC 15939:2007 – Systems and software engineering – Measurement process, 2007. International Organization for Standardization.
[ISO07b]
ISO. ISO/IEC Guide 99:2007, International vocabulary of metrology – Basic and general concepts and associated terms (VIM), 2007. International Organization for Standardization.
[ISO08]
ISO. ISO 9001:2008 - Quality management systems – Requirements, 2008. International Organization for Standardization.
[ISO11]
ISO/IEC. Systems and software engineering – Systems and software Quality Requirements and Evaluation (SQuaRE) – System and software quality models, 2011-03-01 2011.
[Jar01]
Richard D. Jarrard. Scientific methods. Technical report, Dept. of Geology and Geophysics, University of Utah, 2001. www.iibhg.ukim. edu.mk/obrazovanie/sm_all.pdf. 239
B IBLIOGRAPHY [Jen94]
Kurt Jensen. An introduction to the theoretical aspects of Coloured Petri nets. A decade of Concurrency Reflections and Perspectives, pages 230–272, 1994.
[Jen97]
Kurt Jensen. A brief introduction to Coloured Petri Nets. Tools and Algorithms for the Construction and Analysis of Systems, pages 203–208, 1997.
[Jen98]
Kurt Jensen. An introduction to the practical use of Coloured Petri Nets. Lectures on Petri Nets II: Applications, pages 237–292, 1998.
[Joh08]
Jendrik Johannes. ATL Use Case - Model Driven Performance Engineering: From UML/SPT to AnyLogic. http://www.eclipse.org/m2m/ atl/usecases/UML2AnyLogic/, 2008.
[Jon94]
Christopher R. Jones. Improving Your Key Business Processes. The TQM Magazine, 6(2):25 – 29, 1994.
[JP05]
Andreas Jedlitschka and Dietmar Pfahl. Reporting guidelines for controlled experiments in software engineering. In Proceedings of the 4th International Symposium on Empirical Software, pages 95–104. IEEE Computer Society, 17-18 Nov. 2005 2005.
[Jur11]
Marko Juriši´c. Transition between process models (BPMN) and service models (WS-BPEL and other standards): A systematic review. Journal of Information and Organizational Sciences, 35(2):163–171, 2011.
[Kav02]
E. Kavakli. Goal-oriented requirements engineering: A unifying framework. Requirements Engineering, 6(4):237–251, 2002.
[KCJ98]
Lars M. Kristensen, Soren Christensen, and Kurt Jensen. The practitioner’s guide to coloured Petri nets. International Journal on Software Tools for Technology Transfer (STTT), 2(2):98–132, 1998.
[Kin03]
Ekkart Kindler. On the semantics of EPCs: A framework for resolving the vicious circle. Technical report, Computer Science Department, University of Paderborn, Germany, August 2003.
[Kit04]
Barbara Kitchenham. Procedures for performing systematic reviews. Keele, UK, Keele University, 33:2004, 2004.
[KK97a]
Peter Kueng and Peter Kawalek. Goal-based business process models: creation and evaluation. Business Process Management Journal, 3(1):17 – 38, 1997.
[KK97b]
Peter Kueng and Peter Kawalek. Goal-based business process models: creation and evaluation. Business Process Management Journal, 3(1):17 – 38, 1997. 240
B IBLIOGRAPHY [KKGL10]
S. Kühne, H. Kern, V. Gruhn, and R. Laue. Business process modeling with continuous validation. Journal of Software Maintenance and Evolution: Research and Practice, 22(6–7):547–566, 2010.
[KL04]
Evangelia Kavakli and Pericles Loucopoulos. Goal Driven Requirements Engineering: Analysis and Critique of Current Methods, pages 102 – 124. IDEA Group, 2004.
[KL07]
Birgit Korherr and Beate List. Extending the epc and the bpmn with business process goals and performance measures. In ICEIS (3), pages 287–294, 2007.
[KLS95]
J. Krogstie, O.I. Lindland, and G. Sindre. Defining quality aspects for conceptual models. Proceedings of the IFIP8, 1:28–30, 1995.
[Ko09]
R.K.L. Ko. A computer scientist’s introductory guide to business process management (BPM). Crossroads, 15(4):4, 2009.
[Kor08]
B. Korherr. Business Process Modelling: Languages, Goals, and Variabilities. VDM Publishing, 2008.
[KPF95]
B. Kitchenham, S. L. Pfleeger, and N. Fenton. Towards a framework for software measurement validation. Software Engineering, IEEE Transactions on, 21(12):929–944, 1995.
[KPP+ 02]
Barbara A Kitchenham, Shari Lawrence Pfleeger, Lesley M Pickard, Peter W Jones, David C. Hoaglin, Khaled El Emam, and Jarrett Rosenberg. Preliminary guidelines for empirical research in software engineering. IEEE Transactions on Software Engineering, 28(8):721–734, 2002.
[Kro03]
J. Krogstie. Evaluating UML using a generic quality framework. Irm Press, 2003.
[KS00]
John Krogstie and Arne Solvberg. Information Systems Engineering: Conceptual Modeling in a quality perspective. Andersen Consulting / The Norwegian University of Science and Technology, 2000.
[KSJ06]
J. Krogstie, G. Sindre, and H. Jørgensen. Process models representing knowledge for action: a revised quality framework. European Journal of Information Systems, 15(1):91–102, 2006.
[KSSB11]
A. Kossiakoff, W.N. Sweet, S.J. Seymour, and S.M. Biemer. Systems Engineering Principles And Practice. Wiley Online Library, 2011.
[LA94]
Frank Leymann and Wolfgang Altenhuber. Managing business processes as an information resource. IBM Systems Journal, 33(2):326–348, 1994. 241
B IBLIOGRAPHY [Lak95]
Charles Lakos. From coloured Petri nets to object Petri nets. Application and Theory of Petri Nets 1995, pages 278–297, 1995.
[Lan03]
Guy Lander. What is Sarbanes-Oxley? McGraw-Hill, 2003.
[lEE90]
lEEE. Std 610.12-1990 – IEEE Standard Glossary of Software Engineering Terminology, 1990.
[LK01]
A.M. Latva-Koivisto. Finding a complexity measure for business process models. Helsinki University of Technology, Systems Analysis Laboratory, 2001.
[LK06]
Beate List and Birgit Korherr. An evaluation of conceptual business process modelling languages. In Proceedings of the 2006 ACM symposium on Applied computing, pages 1532–1539. ACM, 2006.
[LL05]
Kenneth C. Laudon and Jane P. Laudon. Management Information Systems: Managing the Digital Firm. Prentice Hall, 9th edition, 2005.
[Lon04]
Antoine Lonjon. Business process modeling and standardization. Technical report, BPTrends, 2004. http://www.bptrends.com.
[LS97]
Y. Lei and M.P. Singh. A comparison of workflow metamodels. In Proceedings of the ER-97 Workshop on Behavioral Modeling and Design Transformations: Issues and Opportunities in Conceptual Modeling, 1997.
[LS00]
Sea Ling and Heinz Schmidt. Time Petri nets for workflow modelling and analysis. In Proceedings of the IEEE International Conference on Systems, Man, and Cybernetics, volume 4, pages 3039–3044. IEEE, 2000.
[LS07]
Ruopeng Lu and Shazia Sadiq. A Survey of Comparative Business Process Modeling Approaches Business Information Systems, volume 4439 of Lecture Notes in Computer Science, pages 82–94. Springer Berlin / Heidelberg, 2007.
[LSM12]
Henrik Leopold, Sergey Smirnov, and Jan Mendling. On the refactoring of activity labels in business process models. Information Systems, 37(5):443–459, 2012.
[LSS94]
Odd Ivar Lindland, Guttorm Sindre, and Arne Solvberg. Understanding Quality in Conceptual Modeling. IEEE Softw., 11(2):42–49, 1994.
[LSW98]
Peter Langner, Christoph Schneider, and Joachim Wehler. Petri Net Based Certification of Event-Driven Process Chains Application and Theory of Petri Nets 1998, volume 1420 of Lecture Notes in Computer Science edited by Desel, Jörg and Silva, Manuel, pages 286–305. Springer Berlin / Heidelberg, 1998. 242
B IBLIOGRAPHY [LvdA09]
K.B. Lassen and W.M.P. van der Aalst. Complexity metrics for Workflow nets. Information and Software Technology, 51(3):610–626, 2009.
[MADD04]
D.A. Menasce, V.A.F. Almeida, L.W. Dowdy, and L. Dowdy. Performance by design: computer capacity planning by example. Prentice Hall, 2004.
[MaP01]
N. Melão and M. Pidd. A conceptual framework for understanding business processes and business process modelling. Information systems journal, 10(2):105–129, 2001.
[Mar90]
M. Marsan. Stochastic Petri Nets: an elementary introduction. Advances in Petri Nets 1989, pages 1–29, 1990.
[May89]
Richard E Mayer. Models for understanding. Review of educational research, 59(1):43–64, 1989.
[MB02]
Stephen J. Mellor and Marc Balcer.
Executable UML. A Foundation
For Model-Driven Architecture. Addison Wesley, 2002. http://www. executableumlbook.com/. [MB10]
Marius Marusteri and Vladimir Bacarea. Comparing groups for statistical differences: how to choose the right statistical test? Biochemia Medica, 20(1):15–32, 2010.
[MCN92]
J. Mylopoulos, L. Chung, and B. Nixon. Representing and using nonfunctional requirements: A process-oriented approach. Software Engineering, IEEE Transactions on, 18(6):483–497, 1992.
[MCY99]
J. Mylopoulos, L. Chung, and E. Yu.
From object-oriented to goal-
oriented requirements analysis. Communications of the ACM, 42(1):31–37, 1999. [Men07]
J. Mendling. Detection and Prediction of Errors in EPC Business Process Models. PhD thesis, Vienna University of Economics and Business Administration, 2007.
[MGSA10]
G.M. Muketha, A.A.A. Ghani, M.H. Selamat, and R. Atan. A Survey of Business Process Complexity Metrics. Information Technology Journal, 9:1336–1344, 2010.
[MHO06]
R. Matuleviˇcius, P. Heymans, and A.L. Opdahl. Ontological analysis of KAOS using separation of reference. In Proceedings of the EMMSAD, volume 6, 2006.
[MHO07]
R. Matuleviˇcius, P. Heymans, and A. Opdahl.
Comparing GRL and
KAOS using the UEML Approach Enterprise Interoperability II, pages 77– 88. Springer London, 2007. 243
B IBLIOGRAPHY [Mil56]
G. A. Miller. The magical number seven, plus or minus two: Some limits on our capacity for processing information. Psychological Review, 63 (2):81–97, 1956.
[Mil99]
Robin Milner. Communicating and Mobile Systems: the π-Calculus. Cambridge University Press, 1999.
[MKC01]
John Mylopoulos, Manuel Kolp, and Jaelson Castro. UML for AgentOriented Software Development: The Tropos Proposal, volume 2185 of Lecture Notes in Computer Science, pages 422–441. Springer Berlin / Heidelberg, 2001.
[MM97a]
V. B. Misic and S. Moser. From formal metamodels to metrics: an objectoriented approach. In Proceedings of the Technology of Object-Oriented Languages (TOOLS 1997), pages 330–339. IEEE, 1997.
[MM97b]
S. Moser and V. B. Misic. Measuring class coupling and cohesion: a formal metamodel approach. In Proceedings of the Software Engineering Conference, 1997. Asia Pacific and International Computer Science Conference 1997. APSEC ’97 and ICSC ’97, pages 31–40, 1997.
[MN05]
Jan Mendling and Markus Nüttgens. EPC Markup Language (EPML) – An XML-Based Interchange Format for Event-Driven Process Chains (EPC). Technical report, Vienna University of Economics and Business Administration, March 2005.
[MNvdA07]
Jan Mendling, Gustaf Neumann, and Wil van der Aalst. Understanding the Occurrence of Errors in Process Models Based on Metrics. In Robert Meersman and Zahir Tari, editors, On the Move to Meaningful Internet Systems 2007: CoopIS, DOA, ODBASE, GADA, and IS, volume 4803 of Lecture Notes in Computer Science, pages 113–130. Springer Berlin / Heidelberg, 2007. 10.1007/978-3-540-76848-7 9.
[Moo05]
D.L. Moody. Theoretical and practical issues in evaluating the quality of conceptual models: current state and future directions. Data & Knowledge Engineering, 55(3):243–276, 2005.
[Mor71]
Charles William Morris. Writings on the General Theory of Signs. Mouton de Gruyter, The Hague, The Netherlands, 1971.
[MPSP+ 09]
Boris Motik, Peter F Patel-Schneider, Bijan Parsia, Conrad Bock, Achille Fokoue, Peter Haase, Rinke Hoekstra, Ian Horrocks, Alan Ruttenberg, Uli Sattler, et al. OWL 2 web ontology language: Structural specification and functional-style syntax. W3C recommendation, 27:17, 2009. http: //www.w3.org/TR/owl2-overview/. 244
B IBLIOGRAPHY [MR03]
Douglas C. Montgomery and George C. Runger. Applied Statistics and Probability for Engineers. John Wiley, third edition, 2003.
[MR08]
M. Muehlen and J. Recker. How much language is enough? Theoretical and practical use of the business process modeling notation. In Proceedings of the Advanced information systems engineering, pages 465–479. Springer, 2008.
[MRC07]
Jan Mendling, Hajo Reijers, and Jorge Cardoso. What Makes Process Models Understandable? Business Process Management, volume 4714 of Lecture Notes in Computer Science, pages 48–63. Springer Berlin / Heidelberg, 2007.
[MRvdA10]
J. Mendling, H.A. Reijers, and W.M.P. van der Aalst. Seven process modeling guidelines (7PMG). Information and Software Technology, 52(2):127– 136, 2010.
[MSBS03]
D. Moody, G. Sindre, T. Brasethvik, and A. Sølvberg. Evaluating the quality of process models: Empirical testing of a quality framework. Conceptual Modeling—ER 2002, pages 380–396, 2003.
[MSW10]
A. Meneely, B. Smith, and L. Williams. Software metrics validation criteria: a systematic literature review. North Carolina State University Department of Computer Science, Raleigh, NC, pages 27695–8206, 2010.
[MSW12]
Andrew Meneely, Ben Smith, and Laurie Williams. Validating software metrics: A spectrum of philosophies. ACM Transactions on Software Engineering and Methodology (TOSEM), 21(4):24, 2012.
[MTJ+ 10]
Hafedh Mili, Guy Tremblay, Guitta Bou Jaoude, Eric Lefebvre, Lamia Elabed, and Ghizlane El Boussaidi.
Business process modeling lan-
guages: Sorting through the alphabet soup. ACM Computing Surveys (CSUR), 43(1):4, 2010. [Mur89]
T. Murata. Petri nets: Properties, analysis and applications. Proceedings of the IEEE, 77(4):541–580, 1989.
[Myl98]
J. Mylopoulos. Information Modeling in the Time of the Revolution. Information Systems, 23(3):127–155, 1998.
[Nat11]
Christine Natschleger. Towards a BPMN 2.0 Ontology. Lecture Notes in Business Information Processing, 95:1–15, 2011.
[NBZ06]
Nachiappan Nagappan, Thomas Ball, and Andreas Zeller. Mining metrics to predict component failures. In Proceedings of the 28th international conference on Software engineering, ICSE ’06, pages 452–461, New York, 245
B IBLIOGRAPHY NY, USA, 2006. ACM. http://doi.acm.org/10.1145/1134285. 1134349. [OAS07]
OASIS. Web Services Business Process Execution Language Version 2.0, 11 April 2007 2007.
[OHNAEE+ 07] Javier Ortiz-Hernández, Erika M Nieto-Ariza, Hugo Estrada-Esquivel, Guillermo Rodríguez-Ortiz, and Azucena Montes-Rendon. A theoretical evaluation for assessing the relevance of modeling techniques in business process modeling. In Proceedings of the Fourth International Workshop on Software Quality Assurance: in conjunction with the 6th ESEC/FSE joint meeting, pages 102–107. ACM, 2007. [OM98]
Min Oh and II Moon. Framework of dynamic simulation for complex chemical processes. Korean Journal of Chemical Engineering, 15(3):231–242, 1998.
[OMG03a]
OMG. Common Warehouse Metamodel (CWM). Object Management Group, 2003. http://www.omg.org/spec/CWM/1.1.
[OMG03b]
OMG. MDA Guide Version 1.0.1. Object Management Group, 2003. http://www.omg.org/cgi-bin/doc?omg/03-06-01.
[OMG05]
OMG. UML Profile for Schedulability, Performance, and Time (v1.1). Object Management Group, January 2005.
[OMG06]
OMG. Object Constraint Language (OCL). Object Management Group, 2006.
[OMG07a]
OMG. UML-Unified Modeling Language (OMG UML), Infrastructure, V2.1.2. Object Management Group, 2007.
[OMG07b]
OMG. UML-Unified Modeling Language (OMG UML), Superstructure, V2.1.2. Object Management Group, 2007.
[OMG08a]
OMG. BPDM - Business Process Definition Metamodel. Object Management Group, November 2008. http://www.omg.org/spec/BPDM/ 1.0/volume1/PDF.
[OMG08b]
OMG. Software & Systems Process Engineering Metamodel Specification (SPEM) v2.0. Object Management Group, April 2008. http: //www.omg.org/spec/SPEM/2.0/.
[OMG09]
OMG. Ontology Definition Metamodel (ODM). Object Management Group, 2009. http://www.omg.org/spec/ODM/1.0/PDF. 246
B IBLIOGRAPHY [OMG11]
OMG.
MOF 2.0/XMI Mapping, Version 2.4.1.
Group, August 2011.
Object Management
http://www.omg.org/spec/XMI/2.4.1/
PDF. [OMG12a]
OMG. Semantics of Business Vocabulary and Business Rules (SBVR). Object Management Group, 2012.
http://www.omg.org/spec/
SBVR/1.1/index.htm. [OMG12b]
OMG.
System Modeling Language (SysML).
Object Management
Group, June 2012. http://www.omg.org/spec/SysML/1.3/. [OMG13]
OMG. Semantics of a Foundational Subset for Executable UML Models (FUML). Object Management Group, 2013. http://www.omg.org/ spec/FUML/1.1.
[Par72]
David Lorge Parnas. On the criteria to be used in decomposing systems into modules. Communications of the ACM, 15(12):1053–1058, 1972.
[PCCW93]
Mark C. Paulk, Bill Curtis, Mary Beth Chrissis, and Charles V. Weber. Capability Maturity Model for Software, Version 1.1. Technical report, SEI – Carnegie Mellon University, 1993.
[Per06]
James R. Persse. Process Improvement Essentials. O’Reilly Media, Inc., 2006.
[Pet62]
Carl A. Petri. Kommunikation mit Automaten. PhD thesis, Institut fur Instrumentelle Mathematik, 1962.
[Pet77]
James L. Peterson. Petri nets. ACM Computing Surveys (CSUR), 9(3):223– 252, 1977.
[Pet81]
J. L. Peterson. Petri Net Theory and the Modeling of Systems. Prentice Hall PTR, 1981.
[PFS10]
Elke Pulvermueller, Sven Feja, and Andreas Speck.
Developer-
friendly verification of process-based systems. Knowledge-Based Systems, 23(7):667–676, 2010. [Pha98]
Keith Thomas Phalp. The CAP framework for business process modelling. Information and Software Technology, 40(13):731–744, 1998.
[PI92]
R.S. Pressman and D. Ince. Software engineering: a practitioner’s approach, volume 5. McGraw-hill New York, 1992.
[Pop35]
Karl Popper. The Logic of Scientific Discovery. Taylor & Francis e-Library, 1935. 247
B IBLIOGRAPHY [PRP08]
Jose Manuel Perez, Francisco Ruiz, and Mario Piattini. MDE for BPM: a systematic review. In Software and Data Technologies, pages 127–135. Springer, 2008.
[PS08]
Viara Popova and Alexei Sharpanskykh. Process-oriented organisation modelling and analysis.
Enterprise Information Systems, 2(2):157–176,
2008. [PS09]
Viara Popova and Alexei Sharpanskykh. Constraint-based modelling and analysis of organisations. In Proceedings of the 2009 ACM symposium on Applied Computing, pages 283–284. ACM, 2009.
[PS10a]
Viara Popova and Alexei Sharpanskykh. Modeling organizational performance indicators. Information Systems, 35(4):505–527, 2010.
[PS10b]
Viara Popova and Alexei Sharpanskykh. Modeling organizational performance indicators. Inf. Syst., 35(4):505–527, 2010.
[PS11]
Viara Popova and Alexei Sharpanskykh. Formal modelling of organisational goals based on performance indicators.
Data Knowl. Eng.,
70(4):335–364, 2011. [PS13]
Susanne Patig and Manuela Stolz. A pattern-based approach for the verification of business process descriptions. Information and Software Technology, 55(1):58–87, 2013.
[PZ08]
C.J. Pavlovski and J. Zou. Non-functional requirements in business process modeling. In Proceedings of the fifth Asia-Pacific conference on Conceptual Modelling-Volume 79, pages 103–112. Australian Computer Society, Inc., 2008.
[RCG+ 09]
E. Rolón, J. Cardoso, F. García, F. Ruiz, and M. Piattini. Analysis and Validation of Control-Flow Complexity Measures with BPMN Process Models. Enterprise, Business-Process and Information Systems Modeling, 29:58–70, 2009.
[Rec07]
J. C. Recker. Understanding Quality in Process Modelling: towards a holistic perspective. Australasian Journal of Information Systems, 14(2):43– 63, 2007.
[REH11]
Mohamed Ramadan, Hicham G Elmongui, and Riham Hassan. BPMN Formalisation using Coloured Petri Nets. In Proceedings of the 2nd GSTF Annual International Conference on Software Engineering & Applications (SEA 2011), 2011. 248
B IBLIOGRAPHY [RG02]
Michael Rosemann and Peter Green.
Developing a meta model for
the Bunge-Wand-Weber ontological constructs.
Information Systems,
27(2):75–91, 2002. [RGI04]
M. Rosemann, P. Green, and M. Indulska. A reference methodology for conducting ontological analyses. Conceptual Modeling-ER 2004, pages 110–121, 2004.
[RI07]
J.C. Recker and M. Indulska. An ontology-based evaluation of process modeling with petri nets. IBIS-International Journal of Interoperability in Business Information Systems, 2(1):45–64, 2007.
[RIG07]
Jan Recker, Marta Indulska, and Peter Green. Extending Representational Analysis: BPMN User and Developer Perspectives - Business Process Management, volume 4714 of Lecture Notes in Computer Science, pages 384–399. Springer Berlin / Heidelberg, 2007.
[RIRG05]
J. Recker, M. Indulska, M. Rosemann, and P. Green. Do process modelling techniques get better?
A comparative ontological analysis of
BPMN. In B. Campbell, J. Underwood, and D. Bunker, editors, Proceedings of the 16th Australasian Conference on Information Systems, Sidney, Australia, 2005. [RIRG06]
J.C. Recker, M. Indulska, M. Rosemann, and P. Green. How good is BPMN really? Insights from theory and practice. In Proceedings of the European Conference on Information Systems, volume 14, pages 1–12. IT University of Gotteborg, 2006.
[RM98]
M. Roseman and M. Muehlen. Evaluation of workflow management systems-a meta model approach. Australian Journal of Information Systems, 6:103–116, 1998.
[RM06]
J.C. Recker and J. Mendling. On the translation between BPMN and BPEL: Conceptual mismatch between process modeling language. In Proceedings of the 18th International Conference on Advanced Information Systems Engineering, Workshops and Doctoral Consortium, pages 521–532. Namur University Press, 2006.
[RPD98]
John O. Rawlings, Sastry G. Pantula, and David A. Dickey. Applied Regression Analysis A Research Tool. Springer Texts in Statistics. SpringerVerlag New York, Inc., second edition, 1998.
[RRG+ 09]
L. Reynoso, E. Rolón, M. Genero, F. García, F. Ruiz, and M. Piattini. Formal definition of measures for BPMN models. Software Process and Product Measurement, 5891:285–306, 2009. 249
B IBLIOGRAPHY [RRGI09]
M. Rosemann, J. Recker, P.F. Green, and M. Indulska. Using ontology for the representational analysis of process modelling techniques. International Journal of Business Process Integration and Management, 4(4):251–265, 2009.
[RRIG09]
J.C. Recker, M. Rosemann, M. Indulska, and P. Green. Business process modeling: a comparative analysis. Journal of the Association for Information Systems, 10(4):333–363, 2009.
[RRK07]
J. Recker, M. Rosemann, and J. Krogstie. Ontology-versus pattern-based evaluation of process modeling languages: a comparison. Communications of the Association for Information Systems, 20(48):774–799, 2007.
[RW05]
G. Regev and A. Wegmann. Where do goals come from: the underlying principles of goal-oriented requirements engineering. In Proceedings of the 13th IEEE International Conference on Requirements Engineering, pages 353–362. IEEE, 2005.
[Sal04]
Mathias Sallé. IT Service Management and IT Governance: Review, Comparative Analysis and their Impact on Utility Computing. Technical report, Hewlett-Packard Research Labs, 2004.
[Sch06]
Douglas C Schmidt. Model-driven engineering. Computer-IEEE Computer Society, 39(2):25, 2006.
[SD97]
Graeme Shanks and Peta Darke. Quality in Conceptual Modelling: Linking Theory and Practice. In Proceedings of the PACIS 1997, volume Paper 76, 1997.
[SEI10a]
Software Engineering Institute SEI. CMMI for Acquisition, Version 1.3 CMMI-ACQ, V1.3. Technical report, SEI – Carnegie Mellon University, 2010.
[SEI10b]
Software Engineering Institute SEI. CMMI for Development,Version 1.3 - CMMI-DEV, V1.3. Technical report, SEI – Carnegie Mellon University, 2010.
[SEI10c]
Software Engineering Institute SEI. CMMI for Services, Version 1.3 CMMI-SVC, V1.3. Technical report, SEI – Carnegie Mellon University, 2010.
[SG05]
Andrew Stellman and Jennifer Greene. Applied Software Project Management. O’Reilly Media, 2005.
[Shu09]
Martyn Shuttleworth. Explorable. http://explorable.com/, 2009. 250
B IBLIOGRAPHY [Sil09]
Bruce Silver. BPMN Method and Style. Cody-Cassidy Press, Aptos, 1st edition, 2009.
[Sim96]
Herbert Simon. Sciences of the Artificial. The MIT Press, Cambridge, 3rd edn edition, 1996.
[Sin06]
G. Sindre. An analytical evaluation of BPMN using a semiotic quality framework. Advanced topics in database research, 5:94, 2006.
[SLT09]
M. Saunders, P. Lewis, and A. Thornhill. Research methods for business students. Financial Times Prentice Hall, 5th edition, 2009.
[Smi08]
David A. Smith. Implementing Metrics for IT Service Management. Van Haren Publishing, Zaltbommel, NL, 2008.
[SMJ00]
Rick Sturm, Wayne Morris, and Mary Jander. Foundations of Service Level Management. Sams Publishing, 1st edition (april 15, 2000) edition, 2000.
[SN00]
August-Wilhelm Scheer and Markus Nüttgens. ARIS Architecture and Reference Models for Business Process Management. In Proceedings of the Business Process Management, Models, Techniques, and Empirical Studies, pages 376–389, London, UK, UK, 2000. Springer-Verlag. http://dl. acm.org/citation.cfm?id=647778.734910.
[Spe81]
Paul Spector. Research Designs. SAGE Publications, 1981.
[SRD03]
Wasana Sedera, Michael Rosemann, and Gabriella Doebeli. A Process Modelling Success Model: Insights from a Case Study. In Proceedings of the 11th European Conference on Information Systems, pages 1–11, Naples, Italy, 2003. ECIS. http://eprints.qut.edu.au/11129/.
[SSB01]
Robert F Stärk, Joachim Schmid, and Egon Börger. Java and the Java Virtual Machine. Springer Heidelberg, 2001.
[STW03]
G. Shanks, E. Tansley, and R. Weber. Using ontology to validate conceptual models. Communications of the ACM, 46(10):85–89, 2003.
[Sup10]
Basel Committee on Banking Supervision. Basel III: A global regulatory framework for more resilient banks and banking systems, 2010.
[SWB+ 12]
Robert Shapiro, Stephen A. White, Conrad Bock, Nathaniel Palmer, Michael zur Muehlen, Marco Brambilla, and Denis Gagné. BPMN 2.0 Handbook. Future Strategies Inc., second edition edition, 2012.
[Tay11]
Frederick Winslow Taylor. The principles of scientific management. Harper & Brothers, New York, London, 1911. 251
B IBLIOGRAPHY [tHvdAAR09]
A.H.M. ter Hofstede, W.M.P. van der Aalst, M. Adams, and N. Russell. Modern Business Process Automation: YAWL and its support environment. Springer, 2009.
[Tro06]
William M.K. Trochim. Research Methods Knowledge Base. http:// www.socialresearchmethods.net/kb/, 2006.
[Tsc10]
Willi Tscheschner. Transformation from EPC to BPMN. Technical report, Oryx Research, 2010.
[UL06]
Mark Utting and Bruno Legeard. Practical Model-Based Testing: A Tools Approach. Morgan Kaufmann, 1rst edition, 2006.
[UoT12]
Canada University of Toronto. GRL - Goal-oriented Requirement Language. http://www.cs.toronto.edu/km/GRL/, 2012.
[VCM+ 07]
Irene Vanderfeesten, Jorge Cardoso, Jan Mendling, Hajo A. Reijers, and Wil van der Aalst. Quality Metrics for Business Process Models, pages 179– 190. Future Strategies Inc., FL, USA, 2007.
[VdA94]
W. M. P. Van der Aalst. Putting high-level Petri nets to work in industry. Computers in Industry, 25(1):45–54, 1994.
[vdA96]
Wil M. P. van der Aalst. Structural characterizations of sound workflow nets. Eindhoven University of Technology, Department of Mathematics and Computing Science, 1996.
[VdA97]
Wil M. P. Van der Aalst. Verification of workflow nets, pages 407–426. Springer, 1997.
[vdA98]
W.M.P. van der Aalst. The application of Petri nets to workflow management. Journal of circuits, systems, and computers, 8(01):21–66, 1998.
[vdA99]
W. M. P. van der Aalst. Formalization and verification of event-driven process chains. Information and Software Technology, 41(10):639–650, 1999.
[vDA00]
W. van Der Aalst. Workflow verification: Finding control-flow errors using petri-net-based techniques. Business Process Management, pages 161–183, 2000.
[vdABL08]
Wil M. P. van der Aalst and Kristian Bisgaard Lassen. Translating unstructured workflow processes to readable BPEL: Theory and implementation. Information and Software Technology, 50(3):131–159, 2008.
[VdAtHW03]
W. Van der Aalst, A. ter Hofstede, and M. Weske. Business process management: A survey. Business Process Management, pages 1019–1019, 2003. 252
B IBLIOGRAPHY [VdAVH96]
W. M. P. Van der Aalst and K. M. Van Hee. Business process redesign: a Petri-net-based approach. Computers in Industry, 29(1):15–26, 1996.
[vDvdAV05]
Boudewijn F van Dongen, Wil MP van der Aalst, and Henricus MW Verbeek. Verification of EPCs: Using reduction rules and Petri nets. In Proceedings of the Advanced Information Systems Engineering, pages 372–386. Springer, 2005.
[VL01]
Axel Van Lamsweerde. Goal-Oriented Requirements Engineering: A Guided Tour. In Proceedings of the Fifth IEEE International Symposium on Requirements Engineering (RE ’01), pages 249–262. IEEE, 2001.
[vL09]
Axel van Lamsweerde. Requirements Engineering. John Wiley & Sons Ltd, West Sussex, England, 2009.
[VRM+ 08]
Irene Vanderfeesten, Hajo Reijers, Jan Mendling, Wil van der Aalst, and Jorge Cardoso. On a Quest for Good Process Models: The Cross-Connectivity Metric Advanced Information Systems Engineering, volume 5074 of Lecture Notes in Computer Science, pages 480–494. Springer Berlin / Heidelberg, 2008.
[vvdAS11]
Wil van van der Aalst and Christian Stahl. Modeling Business Processes: A Petri Net-Oriented Approach. The MIT Press, 2011.
[Was04]
Larry Wasserman. All of Statistics: A Concise Course in Statistical Inference. Springer Texts in Statistics. Springer Science+Business Media, Inc., 2004.
[Was06]
Larry Wasserman. All of Nonparametric Statistics. Springer Texts in Statistics. Springer Science+Business Media, Inc., 2006.
[WDGW08]
Matthias Weidlich, Gero Decker, Alexander Großkopf, and Mathias Weske. BPEL to BPMN: The Myth of a Straight-Forward Mapping, 2008.
[Wed06]
Ian Wedgwood. Lean Sigma: A Practitioner’s Guide. Prentice Hall, 2006.
[Wes07]
Mathias Weske. Business Process Management - Concepts, Languages, Architectures. Springer-Verlag Berlin Heidelberg, 2007.
[Wey88]
E.J. Weyuker. Evaluating software complexity measures. Software Engineering, IEEE Transactions on, 14(9):1357–1365, 1988.
[WG08]
P. Wong and J. Gibbons. A process semantics for BPMN. Formal Methods and Software Engineering, pages 355–374, 2008.
[WG11a]
Peter YH Wong and Jeremy Gibbons. Formalisations and applications of BPMN. Science of Computer Programming, 76(8):633–650, 2011. 253
B IBLIOGRAPHY [WG11b]
Peter YH Wong and Jeremy Gibbons. Property specifications for workflow modelling. Science of Computer Programming, 76(10):942–967, 2011.
[Whi04]
Stephen A. White. Process Modeling Notations and Workflow Patterns. Technical report, OMG, March 2004.
[Whi05]
Stephen A. White. Using BPMN to Model a BPEL Process. Technical report, Business Process Trends, March 2005. http://w.bptrends. com/publicationfiles/03-05WPMappingBPMNtoBPEL-White. pdf.
[WHJC06]
Wang Wei, Ding Hongwei, Dong Jin, and Ren Changrui. A Comparison of Business Process Modeling Methods. In Proceedings of the IEEE International Conference on Service Operations and Logistics, and Informatics, SOLI ’06, pages 1136–1141, 2006.
[WM08]
Stephen A. White and Derek Miers. BPMN Modeling and Reference Guide: Understanding and Using BPMN.
Future Strategies, Inc., Lighthouse
Point, Florida, USA, 2008. [WP93]
W.D. Waltman and A. Presley. Reading & Critiquing an IDEF0 Model. Automation & Robotics Research. Institute, Texas, July 1993.
[WRH+ 00]
C. Wohlin, P. Runeson, M. Höst, M.C. Ohlsson, B. Regnell, and A. Wesslén. Experimentation in Software Engineering: An Introduction. Kluwer Academic Publishers, 2000.
[WW90a]
Y. Wand and R. Weber. An ontological model of an information system. IEEE Transactions on Software Engineering, 16(11):1282–1292, 1990.
[WW90b]
Y. Wand and R. Weber. Toward a theory of the deep structure of information systems. University of British Columbia, Faculty of Commerce and Business Administration, 1990.
[WW96]
Y. Wand and R.Y. Wang. Anchoring data quality dimensions in ontological foundations. Communications of the ACM, 39(11):86–95, 1996.
[YM94a]
E.S.K. Yu and J. Mylopoulos. Understanding ”why” in software process modelling, analysis, and design. In Proceedings of the 16th international conference on Software engineering, pages 159–168. IEEE Computer Society Press, 1994.
[YM94b]
E.S.K. Yu and J. Mylopoulos. Using goals, rules, and methods to support reasoning in business process reengineering. In Proceedings of the Twenty-Seventh Hawaii International Conference on System Sciences, volume 4, pages 234–243. IEEE, 1994. 254
B IBLIOGRAPHY [YM98]
E. Yu and J. Mylopoulos. Why goal-oriented requirements engineering. In Proceedings of the 4th International Workshop on Requirements Engineering: Foundations of Software Quality, pages 15–22, 1998.
[YML96]
E.S.K. Yu, J. Mylopoulos, and Y. Lespérance. AI models for business process reengineering. IEEE expert, 11(4):16–23, 1996.
[Yu97]
E.S.K. Yu. Towards modelling and reasoning support for early-phase requirements engineering. In Proceedings of the Third IEEE International Symposium on Requirements Engineering, pages 226–235. IEEE, 1997.
[ZJ08]
Li Zhang and Wei Jiang. Transforming business requirements into BPEL: A MDAa-based approach to web application development. In Proceedings of the IEEE International Workshop on Semantic Computing and Systems, WSCS’08, pages 61–66. IEEE, 2008.
[zM99]
M. zur Muhlen. Evaluation of workflow management systems using meta models. In Proceedings of the 32nd Annual Hawaii International Conference on System Sciences. HICSS-32, page 11 pp. IEEE, 1999.
[zMR08]
Michael zur Muehlen and Jan Recker. do you need.
How much BPMN
http://www.bpm-research.com/2008/03/03/
how-much-bpmn-do-you-need, 2008. [ZMRI07]
M. Zur Muehlen, J. Recker, and M. Indulska. Sometimes less is more: Are process modeling languages overly complex? In Proceedings of the Eleventh International IEEE EDOC Conference Workshop, EDOC’07, pages 197–204. IEEE, 2007.
255
[This page is intentionally blank]
Appendixes
257
Glossary
accessible population is the population that will be accessible to the researcher on the impossibility of accessing the overall population [Tro06]. 158 assignment by cutoff is the assignment to groups done by a pragmatic method. It is useful when those who allocate subjects may be subject to bias or favoritism [Tro06]. 159 boundedness A Petri net is bounded if, for a given initial marking, the number of tokens in any given place never exceeds a finite number k [MTJ+ 10]. 33 compensatory equalization occurs when different groups receive different treatments. So, the control group may receive some compensation due to the fact of not using the treatment being tested. One must be aware that if the compensation has an effect on the performance of the control group, this may jeopardize the the overall experiment. 196 compensatory rivalry occurs when subjects from the group not receiving a new treatment feel penalized. As reaction they could work harder than they normally would to counteract that effect. 196 confidence interval tells us, in statistical analysis, the reliability of the sample parameter as compared to the whole population parameter. It conveys an expect certain degree of error and uncertainty, which depends on a variety of conditions, like the number of subjects in the experiment and the way they represent the whole population [Shu09]. 173 convenience sample is a type of non-probability sampling which involves the sample being drawn from that part of the population which is close to hand. That is, a sample population selected because it is readily available and convenient. The researcher using such a sample cannot scientifically make generalizations about the total population from this sample because it would not be representative enough [Tro06]. 63, 158 259
Glossary data independence It refers to the insusceptibility of user applications to make changes in the structure of data. Furthermore, physical data independence concerns with hiding the details of the storage structure from user applications. [Cod70]. 12 data set corresponds to the contents of a single database table, or a single statistical data matrix, where each column of the table represents a particular variable, and each row corresponds to a given member of the data set in question. The data set lists values for each of the variables, for each member of the data set. Each value is known as a datum. The data set may comprise data for one or more members, corresponding to the number of rows. 165 deadlock A deadlock is a set of places such that every transition which outputs to one of the places in the deadlock also inputs from one of these places. This means that once all of the places in the deadlock become unmarked, the entire set of places will always be unmarked; no transition can place a token in the deadlock because there is no token in the deadlock to enable a transition which outputs to a place in the deadlock [Pet81]. 33, 71, 75, 79 deductive reasoning also known as deduction, it is a kind of reasoning in which specific examples are derived from general propositions. Deductive reasoning, starts with a general principle and deduces that it applies to a specific case . 149 dependent variable also called responding variable. This is the factor that is the outcome measure, i.e. the effect (or change). 101 descriptive research seeks to depict what already exists in a group or population. Descriptive studies do not seek to measure the effect of a variable; they seek only to describe [Tro06]. 159 empirical means information gained by experience, observation, or experiment. The central theme in scientific method is that all evidence must be empirical which means it is based on evidence. In scientific method the word empirical refers to the use of working hypothesis that can be tested using observation and experiment [Shu09]. 75, 151, 203 falsifiability or refutability is the belief that for any hypothesis to have credence, it must be inherently disprovable before it can become accepted as a scientific hypothesis or theory [Shu09]. 149, 172 independent variable also called experimental variable, this is the factor (treatment) the researcher wants to test, i.e. the cause (the condition or situation) that is altered in the experiment by the researcher. 101 Appendix
260
Glossary inductive reasoning also known as induction, is a kind of reasoning that constructs or evaluates general propositions that are derived from specific examples. Inductive reasoning is used to try to discover new information. whilst commonly used in science, is not logically valid, because it is not strictly accurate to assume that a general principle is correct . 69, 149 information hiding It is the ability to prevent certain aspects of a software component from being accessible to its clients, using for instance programming language features. The principle ensures a stable interface that protects the clients from changes in the provider’s implementation [Par72]. 12 kurtosis is a measure of the peakedness of the variable’s distribution. Higher kurtosis means that the variance in the sample is due to infrequent extreme deviations. A lower kurtosis corresponds to frequent extreme deviations. A distribution with a high peak is called leptokurtic (kurtosis > 0), a flat-topped curve is called platykurtic (kurtosis < 0), and the normal distribution is called mesokurtic (kurtosis = 0). 162 liveness A Petri net with some initial marking is live if every transition is firable/reachable from the initial marking [MTJ+ 10]. 33, 75, 79 non-equivalent group occurs when the researcher deliberately wants to work with different groups, sometimes because it is impractical to select groups randomly. The results of the treatment of the groups are expected to be different [Tro06]. 159 non-local semantics The execution behavior of a particular node within a model may depend on the state of other parts of the model, arbitrarily far away [Kin03]. 31 observation is some measurement that is recorded. This can be a simple activity, such as measuring somebody’s height or it can be the administration of a more complex instrument such as a whole battery of questions or a coherent test. Subscripts may be used to differentiate between observations, for example O1 , O32 , etc [Tro06]. 159 p-value conveys the probability that the randomness in sampling would lead to difference in sample means as large as observed, even if the populations have the same means. It is a measure of how much evidence we have against the null hypothesis, which is the hypothesis of no change or no difference. The smaller the p-value, the more evidence we have against the null hypothesis. The p-value should not be interpreted as the probability that the null hypothesis is true. An hypothesis is not a random event that can have a probability. We do not predict the happening of a hypothesis. Rather, we try to infer whether it is true or not. 162 precision is the fraction of retrieved instances that are relevant. 216 Appendix
261
Glossary qualitative research design is scientific technique with researchers qualitatively observing a domain them and trying to come up with answers which explained what they saw. 69 random assignment is the classic method by which subjects are assigned to groups randomly. This should lead to similar results being achieved from each group if the same treatment is applied. A typical experiment has two randomly assigned groups: the treatment group and the control group. When the results are compared across groups, then differences should be due to the treatment. [Tro06]. 159 raw data is data not prepared to be analyzed. 165 reachability The state of a Petri net is described by the contents of the different places (marking). A marking Mn is reachable from an initial marking M0 if there exist a number of transition firings that can lead to Mn from M0 [MTJ+ 10]. 33 recall is the fraction of relevant instances that are retrieved. 216 relational research is a study that investigates the connection between two or more variables. The variables that are compared, are generally already present in the group or population [Tro06]. 159 reliability yielding the same or compatible results in different experiments or statistical trials [Shu09]. 148, 149 resentful demoralization occurs when subjects from a group not receiving a new treatment feel penalized by the situation. So, they become less involved in the experiments compared with their counterparts. This situation is the opposite of compensatory rivalry. 196 reversibility and home state A Petri net is reversible if for each marking M that is reachable from some initial marking M0 , there exists a finite number of transitions that would take the net from M back to M0 (or some other state, referred to as the home state) [MTJ+ 10]. 33 sampling frame is the listing of the accessible population from which the researcher draws the actual sample [Tro06]. 158 separation of concerns A general accepted principle in computer science that became a rule of thumb for software development. The principle advocates that complexity of computer systems could be tackled by focusing the aim of specific part of the system dealing upon a single aspect. Using this principle, response to change would be facilitated and a mechanism for system’s flexibility would be intrinsically part of the architecture of computer applications, provided that subsystem’s interface remained stable [Dij82]. 12 Appendix
262
Glossary significance level is a value that specifies how much of the difference between the assumed value in the null hypothesis and the value observed from experiment is big enough to reject the possibility that the result was a purely chance process and reject the null hypothesis. Common levels used in statistical analysis are 5% and 1%. 162, 263 significance test is related to statistical hypothesis testing and is used to determine whether there is enough evidence to reject the null hypothesis. A significance test is always accompanied by a value of significance level. 172 skewness is a measure of the degree of asymmetry of a distribution. If the left tail is more pronounced than the right tail, the function is said to have negative skewness. If the reverse is true, it has positive skewness. If the two are equal, i.e. the cumulative density function is symmetrical, it has zero skewness. 162 statistical significance is the minimum level at which the null hypothesis can be rejected. Lower the significance level, higher the confidence. 172 test case is a compound of test programs and test data which are expected to produce certain expected results. The purpose of the test case is the verification of the accomplishment of some predefined system requirements, which can generate fail warnings or pass confirmations. 132 test scenario is a set of test cases that ensure that the automated process is tested from end to end. They may be independent tests or a series of tests that follow each other, each dependent on the output of the previous one. Sometimes, the terms test scenario and test case are used interchangeably. 134 test suite is the collection of test scenarios and/or test cases that are related or that cooperate with each other. 132 testability whenever a hypothesis is created to prove a part of a theory, it must be testable and analyzable with current technology [Shu09]. 149 testbed is an environment that is created for testing purposes. The concept of testbed describe a development environment that is protected from the jeopardies of using a production environment for testing purposes. By setting up of a testbed platform, it is possible the simulation of scenarios under conditions pretty close to the one found in actual working environments, to rigorously test theories, tools, and technologies, in a reproducible fashion. The notion of testbed can be generalized as a procedure for testing some kinds of artifacts (e.g. model) in an isolated manner. The testbed can function as a proof of concept, by which a new artifact is tested apart from the whole where it will be later appended. 134 Appendix
263
Glossary theoretical population is the group to which the researcher wishes to generalize the findings of the empirical study [Tro06]. 158 trap A trap is a set of places such that every transition which inputs from one of these places also outputs to one of these places. This means that once any of the places in a trap has a token, there will always be a token in one of the places of the trap. Firing transitions may move the token between places but cannot remove a token from the trap [Pet81]. 33 treatment is an action or intervention taken that change the situation in some way. These can range from a simple action such as giving the subject information to complex activities that may range from a whole set of actions to surgical operations. Subscripts may be used to differentiate between treatments, for example X1 , X32 , etc. A no-treatment control group may be identified with a particular notation, such as X0 or X-. Where X- is used to indicate the control group, X+ may be used to indicate the treatment group [Tro06]. 159 validity validity encompasses the entire experimental concept and establishes whether the results obtained meet all of the requirements of the scientific research method. Internal validity dictates how an experimental design is structured. External validity is the process of examining the results and questioning whether there are any other possible causal relationships [Shu09]. 148
Appendix
264
A Process Modeling Languages
A.1
Other Process Modeling Languages
• IDEF3 – http://www.idef.com/IDEF3.htm • Colored Petri Nets – http://cpntools.org/ • Workflow Nets – http://woped.ba-karlsruhe.de/index.php?id=7 • Role Activity Diagrams – http://www.eis.mdx.ac.uk/staffpages/geetha/BIS2000/RADs/rad.html • Resource-Event-Agent – http://reatechnology.com/what-is-rea.html • Business Process Modeling Language – http://www.omg.org/bpmn/Documents/BPML-2003.pdf • Business Process Definition Metamodel – http://www.omg.org/spec/BPDM/ • Proposed Interchange Formats (PIF) – http://ccs.mit.edu/pif7.html • Process Specification Language (PSL) – http://www.mel.nist.gov/psl/ • RosettaNet – http://www.rosettanet.org/ • ebXML – http://www.ebxml.org/ • BPEL4WS – http://www.ebpml.org/bpel4ws.htm • EDOC – http://www.omg.org/spec/EDOC/ • π-calculus [Mil99] 265
A.2. Formalizations of BPMN Verification
A.2
Formalizations of BPMN Verification
A.2.1
Communicating Sequential Processes
CSP is a formal language for describing patterns of interaction in concurrent systems [Hoa78, BHR84]. It is a member of the family of mathematical theories of concurrency known as process algebras, or process calculi [Hoa04]. Industrial application of CSP to software design has usually focused on dependable and safety-critical systems, namely to analyze models to confirm that their design is free of deadlock and livelock. CSP allows the description of systems in terms of component processes that operate independently, and interact with each other solely through message-passing communication. The relationships between different processes, and the way each process communicates with its environment, are described using various process algebraic operators. Using this algebraic approach, complex process can be easily constructed from a few primitive elements. There are two classes of primitives in its process algebra: events that represent communications or interactions, and primitive processes which represent fundamental behaviors. The syntax of the language of CSP according [WG11a] is presented next. P, Q ::= P ||| Q | P |[A]| Q | P |[ A|B ]| Q | P \ A | P M Q | P � Q | P u Q | P ., Q | e −→ P | Skip | Stop e ::= x | x.e – Process P ||| Q (interleaving) refers the interleaved parallel composition of processes P and Q. – Process P |[A]| Q (interface parallel) refers the partial interleaving of processes P and Q sharing events in set A. – Process P |[ A|B ]| Q refers parallel composition, in which P and Q can evolve independently but must synchronize on every event in the set A ∩ B; the set A is the alphabet of P and the set B is the alphabet of Q, and no event in A ∪ B can occur without the cooperation of P and Q respectively. ||| i : I • P(i) refer an indexed interleaving, |[A]| i : I • P(i) refer an partial interleaving, and || i : I • A(i) ◦ P(i) to refer parallel combination of processes P(i) for i ranging over I. – Process P \ A (hiding) is obtained by hiding all occurrences of events in set A from the environment of P. – Process P M Q (interrupt) refers a process initially behaving as P, but which may be interrupted by Q. – Process P � Q (external choice) refers the external choice between processes P and Q; the process is ready to behave as either P or Q. An external choice over a set of indexed processes is written � i : I • P(i). – Process P u Q (nondeterministic choice) refers the internal choice between processes P or Q, ready to behave as at least one of P and Q but not necessarily offer either of them. Similarly an internal choice over a set of indexed processes is written u i : I • P(i). Appendix
266
A.2. Formalizations of BPMN Verification – Process P ., Q (sequential composition) refers a process ready to behave as P; after P has successfully terminated, the process is ready to behave as Q. – Process e −→ P (prefixing) refers a process capable of performing event e, after which it will behave like process P. – The process Stop is a deadlocked process and – the process Skip is a successful termination.
A.2.2
Petri Nets
Petri Nets (P/N) [Pet62, DR98] was already introduced in section 2.5.2.4. As it was mentioned before, P/N have been extensively applied to the study of workflow [VdA94, VdAVH96]. We present next the formal definition of Petri nets according to [VdA97]. Definition A.1. Petri Net. A P/N is a triple N = (P, T, F) where: P is a finite set of places; T is a finite set of transitions (with P ∩ T = ∅); F ⊆ (P × T) ∪ (T × P) is a set of arcs (flow relation). Place p is called an input place of transition t if and only if there exists a directed arc (p, t) ∈ F from p to t. Place p is called an output place of transition t if and only if there exists a directed arc from t to p. The set •t refers the set of input places for transition t. The set t• refers the set of output places for transition t. The sets •p and p• hence have equivalent meanings concerning place p. A P/N is strongly connected if and only if, for every pair of nodes x, y ∈ P ∪ T, there is a directed path leading from x to y. During the execution of a P/N, each place holds zero or more tokens, and a state of a P/N, called a marking, is a function from each place in the net to a number of tokens it holds. In a given marking, a transition t is enabled if every input place in •t has at least one token; firing t removes a token from every input place in •t and adds a token to every output place in t•. The state of the P/N transitions from one to the next by firing any one of the enabled transitions. A marking of a P/N is dead if it does not enable any transition, and a transition in a P/N is dead if and only if the net has no marking that enables it.
A.2.3
Web Ontology Language
Web Ontology Language (OWL) is a family of knowledge representation languages for expressing ontologies. The languages are characterized by formal semantics and RDF serializations for the Semantic Web [MPSP+ 09]. The Semantic Web provides a common framework that allows data to be shared and reused across application, enterprise, and community boundaries. RDF is closely related to semantic networks, since it is a graphbased data model with labeled nodes and directed, labeled edges. This is a flexible model for representing data. The fundamental unit of RDF is the statement, which corresponds to an edge in the graph. An RDF statement has three components: a subject, a predicate, Appendix
267
A.2. Formalizations of BPMN Verification and an object. The subject is the source of the edge and must be a resource. In RDF, a resource can be anything that is uniquely identifiable via a Uniform Resource Identifier (URI). OWL has three variants with different levels of expressiveness: OWL Lite, OWL DL and OWL Full. Each of these sub-languages is a syntactic extension of its simpler predecessor. As an ontology language, OWL is primarily concerned with defining terminology that can be used in RDF documents, i.e., classes and properties. Most ontology languages have some mechanism for specifying a taxonomy of the classes. In OWL, you can specify taxonomies for both classes and properties. Semantically, OWL is based on Description Logics (DL). DL are a family of logics that are decidable fragments of first-order predicate logic. These logics focus on describing classes and roles, and have a set-theoretic semantics. Different description logics include different subsets of logical operators [Hef04]. Two of OWL’s sub-languages closely correspond to known description logics: OWL Lite corresponds to the description logic SHIF(D) and OWL DL corresponds to the description logic SHOIN(D) [HPSVH03]. A common property of ontologies and the OWL semantics is the so-called open-world assumption [HPSVH03], a form of partial description or under-specification as a means of abstraction, i.e., from the absence of statements, a deductive reasoner must not infer that the statement is false. In [Nat11] it is defined an ontology that formally represents the BPMN specification. (BPMN 2.0 Ontology) and can be used as a knowledge base. The description of an element is combined within the corresponding class and further explanations are provided in annotations. This is claimed to allow a much faster understanding of BPMN. In addition, the ontology is used as a syntax checker to validate concrete BPMN process models.
A.2.4
Abstract State Machines
Unlike natural language, the Abstract State Machines (ASM) method has precise semantics, i.e., there’s never any doubt about the meaning of an ASM. Abstraction is another important benefit of the ASM method. ASMs can be executed directly using various tools; this makes the transitions from designing to coding, and from designing to testing, much easier [HW02]. Based closely in [SSB01], we present next the main foundations of ASM. An ASM is a system of finitely many transition rules of form if Condition then Updates which transform abstract states. The Condition (so called guard) under which a rule is applied is an arbitrary first-order formula without free variables. Updates is a finite set of function updates (containing only variable free terms) of form f(t1 , . . . , tn ) := t whose execution is to be understood as changing (or defining, if there was none) the value of the (location represented by the) function f at the given parameters. Appendix
268
A.2. Formalizations of BPMN Verification The notion of ASM states is the classical notion of mathematical structures where data come as abstract objects, i.e., as elements of sets (domains, universes, one for each category of data) which are equipped with basic operations (partial functions) and predicates (attributes or relations). Without loss of generality one can treat predicates as characteristic functions. The notion of ASM run is the classical notion of computation of transition systems. An ASM computation step in a given state consists in executing simultaneously all updates of all transition rules whose guard is true in the state, if these updates are consistent. For the evaluation of terms and formulae in an ASM state, the standard interpretation of function symbols by the corresponding functions in that state is used. Simultaneous execution provides a convenient way to abstract from irrelevant sequentiality and to make use of synchronous parallelism. This mechanism is enhanced by the following concise notation for the simultaneous execution of an ASM rule R for each x satisfying a given condition ϕ: forall x with ϕ do R A priori no restriction is imposed neither on the abstraction level nor on the complexity nor on the means of definition of the functions used to compute the arguments ti and the new value t in function updates. The major distinction made in this connection for a given ASM M is between static functions – which never change during any run of M – and dynamic ones which typically do change as a consequence of updates by M or by the environment (i.e., by some other agent than M). The dynamic functions are further divided into four subclasses. • Controlled functions (for M) are dynamic functions which are directly updatable by and only by the rules of M, i.e., functions f which appear in a rule of M as leftmost function (namely in an update f(s) := t for some s,t) and are not updatable by the environment. • Monitored functions are dynamic functions which are directly updatable by and only by the environment, i.e., which are updatable but do not appear as leftmost function in updates of M. • Interaction functions are dynamic functions which are directly updatable by rules of M and by the environment. • Derived functions are dynamic functions which are not directly updatable neither by M nor by the environment but are nevertheless dynamic because defined (for example by an explicit or by an inductive definition) in terms of static and dynamic functions.
Appendix
269
[This page is intentionally blank]
B A Catalog of BPMN Patterns and Anti-Patterns (Sample)
B.1
A Top-Level Process can only be instantiated by a restricted set of Start Events types
Any container (process or subProcess) that does not have a parent container is considered a top-level Process [BPM11, page 238]. Top-level processes can have one of seven types of start events (see Figure 3.3, first column): none, message, timer, conditional, signal, multiple, and parallel [BPM11, page 112].
271
B.2. Outgoing Sequence Flow not allowed in an End Event.
Figure B.1: A Top-Level Process can only be instantiated by a restricted set of Start Events types Correct: A top-level process is instantiated by allowed types of start events (none and a message types) (top) Wrong: A top-level process is instantiated by an invalid type of start event (escalation type) (bottom)
B.2
Outgoing Sequence Flow not allowed in an End Event
The end event indicates where a process will end. In terms of sequence flows, the end event ends the flow of the process, and thus, will not have any outgoing sequence flows [BPM11, page 249].
Appendix
272
B.3. Outgoing Message Flow not allowed in a Catch Event.
Figure B.2: Outgoing Sequence Flow not allowed in an End Event Correct: End Event has no outgoing sequence flows (top) Wrong: End Event has an outgoing sequence flow (bottom)
B.3
Outgoing Message Flow not allowed in a Catch Event
A Start Event or a catching Intermediate Event cannot have outgoing message flows [BPM11, page 251].
Figure B.3: Outgoing Message Flow not allowed in a Catch Event Correct: Catch Events with incoming Message Flow (top) Wrong: Catch Events with outgoing Message Flow (bottom)
Appendix
273
B.4. A Catch Event with incoming Message Flow must have Message or Multiple type
B.4
A Catch Event with incoming Message Flow must have Message or Multiple type
A Start Event or a catching Intermediate Event with incoming Message Flow must be of type Message of Multiple [BPM11, pages 44, 271].
Figure B.4: A Catch Event with incoming Message Flow must have Message or Multiple type Correct: Catch Events with incoming Message Flow are Message or Multiple types (top) Wrong: A Start Event with incoming Message Flow cannot be of Timer type (middle) or untyped (bottom)
Appendix
274
B.5. Explicit Start/End Events do not allow Activities or Gateways without incoming/outgoing Sequence Flow
B.5
Explicit Start/End Events do not allow Activities or Gateways without incoming/outgoing Sequence Flow
Start Event and End event are optional [BPM11, page 238]. However, if there is at least one explicit Start/End Event in a container (Process or SubProcess), there must not be other flow nodes such as Activity and Gateway, without incoming/outgoing sequence flow [BPM11, pages 153, 289, 430]. There are some exceptions: Compensation Activity an Event SubProcess do not have incoming and outgoing Sequence Flows.
Figure B.5: Explicit Start/End Events do not allow Activities or Gateways without incoming/outgoing Sequence Flow Correct: A Start event and activities or gateways without incoming sequence flow Wrong: A Start event and an activity without incoming sequence flow
Appendix
275
B.6. A conditional Sequence Flow cannot be used if there is only one sequence flow out of the element
B.6
A conditional Sequence Flow cannot be used if there is only one sequence flow out of the element
Figure B.6: A conditional Sequence Flow cannot be used if there is only one sequence flow out of the element Correct: The sequence flow from Activity1 to Activity2 does not have any decorator since it is unique (top) Wrong: The sequence flow from Activity1 to Activity2 has a condition (bottom)
Appendix
276
B.7. A Boundary Event must have exactly one outgoing Sequence Flow (unless it has the Compensation type)
B.7
A Boundary Event must have exactly one outgoing Sequence Flow (unless it has the Compensation type)
A Boundary Event is attached to an Activity and an outgoing exception flow comes out from it, through a Sequence Flow. Exactly one Sequence Flow is allowed from a Boundary Event except in the case that it is of type Compensation. In this particular case an Association can replace or not the Sequence Flow [BPM11, pages 259, 440, 441].
Figure B.7: A Boundary Event must have exactly one outgoing Sequence Flow (unless it has the Compensation type) Correct: Only one sequence flow has as source a Boundary Event (top) Wrong: More than one sequence flow has as source a Boundary Event (bottom)
Appendix
277
B.8. Use a Timer Intermediate Event with an Event Gateway
B.8
Use a Timer Intermediate Event with an Event Gateway
One way for a modeler to ensure that the Process does not get stuck at an Event Based Exclusive Gateway is to use a Timer Intermediate Event as one of the options for the Gateway [WM08].
Figure B.8: Use a Timer Intermediate Event with an Event Gateway Correct: A Timer Intermediate Event in a set including an Event Gateway (top) Wrong: An Event Gateway without a Timer Intermediate Event(bottom)
Appendix
278
B.9. Use a Default Condition at an Exclusive Gateway
B.9
Use a Default Condition at an Exclusive Gateway
One way for the modeler to ensure that the Process does not get stuck at an Exclusive Gateway is to use a default condition for one of the outgoing Sequence Flow. This creates a Default Sequence Flow. The Default is chosen if all the other Sequence Flow conditions turn out to be false [WM08].
Figure B.9: Always use a Default Condition with an Exclusive Gateway Correct: Use of a Default Condition with an Exclusive Gateway (top) Wrong: An Exclusive Gateway without Default Condition (bottom)
Appendix
279
B.10. Two Activities in the same Process should not have the same name
B.10
Two Activities in the same Process should not have the same name
It is highly recommended that the activities’ names be unique. If it is required an activity to be reused in a process, a Global Activity should be used instead [Sil09].
Figure B.10: Activities on the same Process should have different names Correct: Two Activities in the same Process with different names but invoking the same Global Activity (top) Wrong: Two Activities in the same Process with the same name (bottom)
Appendix
280
C Data Collection for a Survey on Effectiveness of Current BPMN Tools on Detection of Rules Violations on Process Models
Figure C.1: 2.01.00.812)
Model-snippet implemented in Adonis Community Edition (Version:
281
Figure C.2: Model-snippet implemented in Aris Express (Version: 2.4)
Figure C.3: Model-snippet implemented in Bizagi (Version: 2.3.0.5)
Figure C.4: Model-snippet implemented in Enterprise Architect (Version: 9.0.908) Appendix
282
Figure C.5: Model-snippet implemented in eClarus (Version: 2.1.0.200904272037)
Figure C.6: Model-snippet implemented in iGrafx Process 2013 (Version: 15.0.1.1547)
Figure C.7: Model-snippet implemented in MagicDraw (Version: 17.0.3) Appendix
283
Figure C.8: Model-snippet implemented in Modelio (Version: 2.2.1)
Figure C.9: Model-snippet implemented in Signavio (Version: 6.2)
Appendix
284
Figure C.10: Model-snippet implemented in TIBCO (Version: 3.5.3.022)
Figure C.11: Model-snippet implemented in Visio & BPMN 2.0 Modeler (Versions: 14.0.6/3.1)
Appendix
285
[This page is intentionally blank]
D Sample of BPMN Process Models used in Empirical Validation
287
Table D.1: BPDs used in Empirical Validation Source
Name
BPMN Description
Trisotech
Accounts Payable
1.2
Trisotech
Acquisition following RFQ
1.2
Trisotech
Airline Check In
1.2
Trisotech
Bank Account Opening Book Writing and Publishing
1.2
Trisotech
BPI Web istration Moderator
Regwith
1.2
Trisotech
BPI Web Registration without Moderator Change of Address
1.2
Claims ing
1.2
Trisotech
Trisotech
Trisotech
Appendix
Process-
1.2
1.2
Accounts payable (AP) can be an area of finance where tremendous inefficiencies can occur. All companies are looking to: Reduce costs and eliminate errors with data entry; Maximize settlement discounts; Minimize late payment penalties; Eliminate lost invoices; Improve cash flow; Foster healthy vendor relationships. Acquisition process following Request for Quotation from selected suppliers (BPMN v1.2 Specification) Activities performed by a Airline agent responsible for checking in an airline passenger and its baggages. The sequence and the wording of few activities of banking organizations. This process presents a way to synchronize highly independent activities occuring during the writing of a book to be published. Process used in Stephen A. White and Derek Miers book "BPMN Modeling and Reference Guide". This process illustates the activities performed by a user and by Business Process Incubator (BPI) to handle a BPI membership request. This version includes the presence of a "Moderator" to review and approve teh registration. This process illustates the activities performed by a user and by Business Process Incubator (BPI) to handle a BPI membership request. Each year, 14% of the U.S. population will move resulting in over 120,000 change of address (COA) requests that need to be processed at Bigger Bank. Insurance company explored alternatives to improve an existing process and reduce operational costs.
288
BPDs used in Empirical Validation Source
Name
BPMN Description
Trisotech
Commercial Financing
1.2
Trisotech
Credit Review and Approval
1.2
Trisotech
Customer Quote Request
1.2
Trisotech
Email Voting
1.2
Trisotech
Employee Expence Reimbursement Request - Alternative 1 Employee Expence Reimbursement Request - Alternative 2
1.2
HR Employee On-boarding #1 HR Employee On-boarding #2
1.2
Trisotech
Incident Management as Detailed Collaboration
2.0
Trisotech
Insurance Claim Processing
1.2
Trisotech
LaserTec Production Process
1.2
Trisotech
Trisotech Trisotech
Appendix
1.2
1.2
Process activities performed by the financial institution personnel involved in the sales, analysis and approval of Commercial Loans. This process span the activities from the reception of a loan request to to dipursement of the fonds to the approved requester. High Level Credit Review Process with Start and End Events with and withou triggers, allowing this process to be used as a standalone process or a Reusable sub-process. This diagram correponds to the Figure 9.12 (page 61) of BPMN v1.2 Specifications. A Customer makes a request for a quote from a supplier befor confirming or infirming an formal order. It is a process for resolving issues through email votes. The email voting presented in the BPMN v1.2 Specifications. This process presents the activities required to accept, analyse, approve and pay an expense statement submitted by an employee. This proposed alternative assume that email sending to employees does not create process delays. This process presents the activities required to accept, analyse, approve and pay an expense statement submitted by an employee. This alternative remove the assumption that email sending to employees does not create process delays. HR needs to meet 45-day SLA to complete the on-boarding of an employee. With 300 - 400 employees joining and departing the company every two months, the HR organization is constantly recruiting, on-boarding, training, and relieving staff. Achieving SLAs was a challenge. This process illustates the ping-pong-game of account manager, support agents and software developer by switching from a single-poolmodel to a collaboration diagram. This process presents the high level activities used to handle an Insurance Claim. Only the Insurance company Private Process is shown in this example. Present an end to end process of the LaserTec production. Used by Alexander Grosskopf, Gero Decker and Mathias Weske in their book "The Process - Business Process Modeling using BPMN" 289
BPDs used in Empirical Validation Source
Name
BPMN Description
Trisotech
Loan Processing
1.2
Trisotech
Mortgage proval
1.2
Trisotech
New Car Sales
1.2
Trisotech
Order Fulfillment
2.0
Trisotech
Order fulfillment - BPMN v2.0 Specifications
2.0
Trisotech
Order Fulfillment and Procurement
2.0
Trisotech
Order Processing
1.2
Trisotech
Order Processing with Credit Card Authorization
1.2
Trisotech
Patient Treatment - Abstract Process
1.2
Trisotech
Patient Treatment - Collaboration
1.2
Appendix
Ap-
The bank used process simulation to assess the impact of upcoming marketing programs that were aimed at first-time auto buyers. This process illustrates the usage of Signal Events to coordinate the decisions of a Customer Service Representative and a Manager working in a Mortgage Approval Business Process. Process used in Stephen A. White and Derek Miers book "BPMN Modeling and Reference Guide". Present in the book "BPMN Method & Style" from Bruce Silver Present in the book "BPMN Method & Style" from Bruce Silver In this example, following an order, parts are retrieve (if available) and/or procured (if not available). If all parts are made available on time, the order is accepted, otherwise it is rejected. In both cases the customer is notified. This order fulfillment process starts after receiving an order message and continues to check whether the ordered article is available or not. An available article is shipped to the customer followed by a financial settlement, which is a collapsed sub-process in this diagram. In case that an article is not available, it has to be procured by calling the procurement subprocess. High level process presenting exclusively the normal flow of an order reception and fulfillment. This BPMN diagram is from the BPMN v1.2 Specifications Simple Collaboration process requiring Credit Card Authorization from a Financial Institution before a Supplier process an order and ship it. It is presented in the BPMN v1.2 Specifications Patient Illness Treatment Process used as example in the BPMN 1.2 Specifications. This diagram presents the Doctor’s Office Abstract Process, corresponding to Figure 7.2 (page 13) of BPMN v1.2 Specifications. Patient Illness Treatment Process used as example in the BPMN 1.2 Specifications. This diagram presents the Collaboration Business Process, showing Patient and Doctor Office activities and the message flows between them. It corresponds to Figure 7.3 (page 14) of BPMN v1.2 Specifications. 290
BPDs used in Empirical Validation Source
Name
BPMN Description
Trisotech
Pizza Co. Delivery Process
1.2
Trisotech
Property and Casualty Insurance Claim Processing
1.2
Trisotech
Shipment Process of a Hardware Retailer
2.0
Trisotech
Stock maintenance Process
2.0
Trisotech
The Nobel Prize
2.0
Trisotech
The Pizza Collaboration
2.0
Trisotech
Travel Booking
1.2
Trisotech
Travel Booking with Event Sub-processes
2.0
Appendix
This process is presented at a very high level in Paul Harmon book "Business Process Change A Guide for Business Managers and BPM and Six Sigma Professionals". It has been detailed by Trisotech to support its BPM - Biik of Knowledge material. This process outlines property and casualty insurance claim processing from the point of view of the insurance company. This MS Project Template was designed for automobile insurance, but can also be used for homeowner’s insurance. This process has only one pool and different lanes for the people involved in this process, which automatically means that it is blanked out the communication between those people: It is just assumed that they are communicating with each other somehow. If we had a process engine driving this process, that engine would assign user tasks and therefore be responsible for the communication between those people. This process deals with the case that an article is not available, it has to be procured by calling the procurement sub-process. The processe is slightly differ for each of the six prizes; the results are the same for each of the six categories. Following is the description for the Nobel Prize in Medicine. This example is about Business-To-BusinessCollaboration. It intends to model the interaction between a pizza customer and the vendor explicitly. The Travel booking process illustrates the usage of a transaction Sub-process. The process is presented in Bruce Silver book "BPMN Method and Style" The Travel booking process illustrates the usage of a transaction Sub-process. In this example flights and hotel reservation are made, however they can be reversed if some undesirable results or events occur. The process is presented in Bruce Silver book "BPMN Method and Style"
291
BPDs used in Empirical Validation Source
Name
BPMN Description
Bizagi
20-F SOX Management process
1.2
Bizagi
Access Management process
1.2
Bizagi
accounts payable process
1.2
Bizagi
Ad-Hoc Process
1.2
Bizagi
Change Management process
1.2
Bizagi
Offboarding process
1.2
Bizagi
Onboarding process
1.2
Appendix
Bizagi’s 20-F SOX Management template facilitates the preparation of the Form 20-F needed to comply with the Sarbanes Oxly Act. It covers the definition of tasks and responsibilities with the visibility, availability and traceability needed by auditors, ensuring transparency and control of activities. This template is based on the principals of ITIL practices to help guarantee the availability of information to the users that really need it. This template includes the creation of requests for activating or deactivating permissions over applications, modules, folders or services, as well as managing approvals and permission updates. The Accounts Payable process covers the various tasks involved in the invoices reception, their validation and approval, reducing process time and avoiding incorrect information. The Ad Hoc process template is a workflow pattern that allows handling unstructured processes rather than well predefined processes. With the Ad Hoc pattern you can create tasks at any time that can be allocated to anyone and can be performed in any order during the lifetime of a process. Change Management is based on the principals of ITIL V3 to guarantee a proper implementation of technological changes. It allows a complete planning, risk and impact assessment, and an appropriate communication, implementation and documentation. Offboarding Process helps the Human Resources Area to execute all activities needed for the departure of an employee. It automatizes and reduces the performing time in actions such as stopping payroll, benefits and security access, and collecting the company’s property. Onboarding process assists companies in the coordination of the activities required in the entry of new employees. It focuses on integrating new employees into the organization, preparing them to execute their functions properly and to quickly become productive members of the organization.
292
BPDs used in Empirical Validation Source
Name
BPMN Description
Bizagi
personal loans request process
1.2
Bizagi
Petitions, claims and complaints management process purchase request process
1.2
Bizagi
Recruitment and Selection process
1.2
Bizagi
Six sigma project management process
1.2
Bizagi
travel process
request
1.2
Bizagi
vacation leave request process vehicle insurance policy underwriting process
1.2
Bizagi
Bizagi
Appendix
1.2
1.2
This process covers the various tasks involved in the application/request for credit products, made by individuals through a bank or banking entity. This process template will help you to manage Petitions, Claims, Complaints and Suggestions through the definition and control of the necessary activities to solve them. This process handles the whole purchase process: purchase request, approval (approval limits), quotations, supplier selection, purchase order, invoice control. This template covers all the different activities performed to find a person to fill a vacancy. Companies can reduce the time it takes to hire a new employee and control activities such as scheduling and collecting the result of tests, assigning interviews, updating the list of candidates, etc. This process helps to perform and manage Six Sigma projects that use DMAIC methodology. The process reduces the task assignment time and improves the manner in which information is collected and the project is presented. This process handles travel requests (flight, hotel, cash advance) and approvals for employees. At the conclusion of the travel the process also handles the expense report. This process handles vacation leave requests and approvals for employees. This process handles the initial study of the vehicle, the generation of the insurance quotation, the study of the viability and risks, the inspection and, finally, the issue of the insurance policy itself.
293
[This page is intentionally blank]
E Well-formedness Rules for BPMN Metamodel
295
Id. 1 1.1 1.1.1 1.2 1.2.1 1.2.2 1.2.3 1.2.4 1.3 1.3.1 1.3.2 1.3.3 1.3.4 1.4 1.4.1 1.4.2 1.5 1.5.1 1.5.2 1.5.3 1.5.4 1.5.5 1.5.6 1.5.7 1.5.8 1.5.9 1.5.10
Table E.1: Preciseness Rules for BPMN Metamodel Description Complement the Metamodel with Flow Control Well-formedness Rules Collaboration Only one implicit pool can exist in a collaboration Process A Process is an abstraction of more detailed Process, if its normal flow is contained by the second Process’s normal flow A public Process may not be executable A Top-Level Process can only be instantiated by a restricted set of Start Events types A Call Activity must only call a Callable Element Sub-Process The messages flows interacting with a collapsed view of a sub-process must be the same as the exchanged in the detailed view of the same sub-process A Sub-Process can only have one None Start Event An Event Sub-Process can only have a single Start Event and it must be typed An Event Sub-Process must not have any incoming or outgoing Sequence Flows Flow Nodes If a container includes Start and End Events, as general rule, all Flow Nodes must have at least one incoming or one outgoing Sequence Flow A Flow Node, in a container that includes start and end events, must have at least one incoming or one outgoing sequence flow. Events Only some predefined types of Start, Intermediate and End Events are allowed in specific contexts Incoming Sequence Flow not allowed in a Start Event. Outgoing Sequence Flow not allowed in an End Event. A Catch Event with incoming Message Flow must have Message or Multiple type A Catch Event must have Multiple type if there are more than one incoming Message Flow Outgoing Message Flow not allowed in a Catch Event. A Throw Event with outgoing Message Flow must have Message or Multiple types. A Throw Event must have Multiple type if there are more than one outgoing Message Flow Incoming Message Flow not allowed in a Throw Event. A Catch Link Event must have an incoming Sequence Flow. A Throw Link Event must have outgoing Sequence Flow
Appendix
296
Preciseness Rules for BPMN Metamodel Id. 1.5.11 1.5.12 1.5.13 1.5.14
Description
Multiple Throw Link Events allowed, but only one Catch Link Event Source and target Link Events must have names. Throw and Catch Link Events names must match in the same container Intermediate Events used within normal flow require incoming and outgoing Sequence Flows 1.5.15 Explicit Start/End Events do not allow Activities or Gateways without incoming/outgoing Sequence Flow 1.5.16 Activities or Gateways without incoming Sequence Flow do not allow explicit Start Events 1.5.17 Implicit Start Events require implicit End Events, and vice versa 1.5.18 Non-interrupting Start Events are only allowed in Event SubProcess 1.5.19 Error intermediate events can only be attached to activity boundaries 1.5.20 Catch Error Event must trigger an exception flow 1.5.21 A Throw Error Event must have an unnamed Catch Error Event or a Catch Error Event with the same name 1.5.22 A catching Error Event name must match the name of a thrown Error Event or be unnamed 1.5.23 Unnamed and named Catch Error Events must not be mixed 1.5.24 A Throwing Error Event must be an End Event 1.5.25 Catch Escalation Events can only be attached to activity boundaries 1.5.26 Catch Escalation Event must trigger an exception flow 1.5.27 A Throw Escalation Event must have an unnamed Catch Escalation Event or a Catch Escalation Event with the same name 1.5.28 Named and unnamed Interrupting Catch Escalation Events must not be mixed 1.5.29 Unnamed and named Catch non-Interrupting Escalation Events must not be mixed 1.5.30 A Throwing Escalation End Event must be caught by an Interrupting Escalation Catch Event 1.5.31 A Throwing Escalation Intermediate Event must be caught by an nonInterrupting Escalation Catch Event 1.5.32 A Throw Escalation Event must have an unnamed Catch Escalation Event or a Catch Escalation Event with the same name 1.5.33 A Throw Signal Event must be caught by a Catch Signal Event with the same name or unnamed. 1.5.34 A named Catch Signal Event captures Signal Throw Event with the same name. 1.5.35 A catching Cancel Intermediate Event can only be used attached to the boundary of a Transaction Sub-Process. 1.5.36 The Cancel End Event must be contained within the Transaction Sub-Process or within a lower-level child Transaction Sub-Process 1.5.37 A Terminate End Event must exist in a Transaction if there are several types of End Events 1.5.38 A Compensation End or Intermediate Event can only be used in a SubProcess which is not a Transaction 1.5.39 Embedded Sub-Process can have Compensation Activities explicitly called or via Event Sub-Process 1.5.40 The name of the throwing Intermediate Compensation Event must match to Appendixthe name of canceled Activities. 297
Preciseness Rules for BPMN Metamodel Id.
Description
1.5.41
An exception flow originated by Interrupting Catch Events can merge the normal flow through an Exclusive Gateway An exception flow originated by Non-Interrupting Catch Events can merge the normal flow through an Inclusive Gateway A condition Expression must not be used if the Source of the Sequence Flow is an Event A Boundary Event must have exactly one outgoing Sequence Flow (unless it has the Compensation type) A Boundary Event must not have incoming Sequence Flow An Intermediate Event must have at least one incoming and outgoing Sequence Flow Gateway A Parallel Gateway joins only non-exclusive Sequence Flows A join Exclusive Gateway must merge only exclusive Sequence Flows A Data-Based Exclusive Gateway must have exclusive outgoing Sequence Flows A Gateway must have either multiple incoming Sequence Flow or multiple outgoing Sequence Flow (i.e., it must merge or split the flow). A Gateway with a gatewayDirection of converging must have multiple incoming Sequence Flow, but must not have multiple outgoing Sequence Flow. A Gateway with a gatewayDirection of diverging must have multiple outgoing Sequence Flow, but must not have multiple incoming Sequence Flow. An Event Gateway must have two or more outgoing Sequence Flow. A Conditional Sequence Flow must not be used if the source Gateway is of type Event-Based. A condition Expression must be defined if the Source of the Sequence Flow is an Exclusive or Inclusive Gateway. Target of the Event Based Gateway must be Receive Task or specific Intermediate Catch Event Receive Tasks used in an Event Based Gateway configuration must not have any attached Boundary Event. If Message Intermediate Catch Events are used as Target for the Gateway’s outgoing Sequence Flow, then Receive Tasks must not be used and vice versa. Target elements in an Event Gateway configuration must not have any additional incoming Sequence Flow (other than that from the Event Gateway). A Parallel or Complex Gateway must not have outgoing Conditional Sequence Flow. Activity An Activity with multiple Conditional Sequence Flows must have at least two outgoing Sequence Flows A Compensation Activity must not have any incoming or outgoing Sequence Flow A Compensation Activity must reside within the Process of the Activity that will be compensated A Receive Task must not have an outgoing Message Flow. A Send Task must not have an incoming Message Flow. A Script or Manual Task must not have an incoming or an outgoing Message Flow.
1.5.42 1.5.43 1.5.44 1.5.45 1.5.46 1.6 1.6.1 1.6.2 1.6.3 1.6.4 1.6.5 1.6.6 1.6.7 1.6.8 1.6.9 1.6.10 1.6.11 1.6.12 1.6.13 1.6.14 1.7 1.7.1 1.7.2 1.7.3 1.7.4 1.7.5 1.7.6
Appendix
298
Preciseness Rules for BPMN Metamodel Id.
Description
1.8 1.8.1
Sequence Flow A conditional Sequence Flow cannot be used if there is only one sequence flow out of the element. Sequence Flows cannot cross container boundaries. The source and target must not be the same. Message Flow A Message Flow can only have as source Message End or Intermediate Throw Event; Send, User, or Service Task; Subprocess; or “black box” pool. A Message Flow can only go to a Message Start or Intermediate Catch Event, Boundary Event; Receive, User, or Service Task; Subprocess; or “black box” pool. A Message Flow should not connect to the border of a "white Box" Pool. A Message must be attached to a Message Flow or must be connected to an Association connecting to a Message Flow, a Send Task or a Receive Task, or a Message Event Definition. Artifacts An Association that is connected to a Text Annotation should have a None Direction. An Association should not connect two Text Annotations. An Association must connect to a Text Annotation. Complement the Metamodel with Data Flow Well-formedness Rules A reusable SubProcess has only self-contained data A Data Object must have at least one connected Data Association. A Data Store must have at least one connected Data Association. Data Object References can only access Data Objects residing in the same container or their parents. Complement the Metamodel with Modeling Best-Practices Recommendations Process Use only 7 ± 2 Flow Nodes per diagram Event Use Send/Receive Task or Throw/Catch Message Intermediate Events (not both) Use explicitly Start Events and End Events It is recommended that only one Start Event be used. Use a Default Condition when using Conditional Sequence Flow Use a Timer Intermediate Event with an Event Gateway An event has at most one outgoing Sequence Flow A Start Event should have a name A Message Start Event should have an incoming Message Flow. A Catching Intermediate Message Event should have an incoming Message flow. A Throwing Intermediate Message Event should have an outgoing Message Flow. A Intermediate Event must have a name An end event should be labeled with the name of the end state. If a SubProcess is followed by a yes/no gateway, at least one end event of the SubProcess should be labeled to match the gateway label.
1.8.2 1.8.3 1.9 1.9.1 1.9.2
1.9.3 1.9.4
1.10 1.10.1 1.10.2 1.10.3 2 2.1.1 2.1.2 2.1.3 2.1.4 3 3.1 3.1.1 3.2 3.2.1 3.2.2 3.2.3 3.2.4 3.2.5 3.2.6 3.2.7 3.2.8 3.2.9 3.2.10 3.2.11 3.2.12 3.2.13
Appendix
299
Preciseness Rules for BPMN Metamodel Id.
Description
3.3 3.3.1 3.3.2 3.3.3
Gateway Use a Default Condition at an Exclusive Gateway Use a Default Condition at an Inclusive Gateway Match merging and splitting Sequence Flow in Parallel Gateways (if the desired behavior is to merge them again). Ensure that the number of incoming Sequence Flow is correct for a Parallel Gateway Match merging and splitting Inclusive Gateways Use a Gateway as mediator when merging exclusive paths Simultaneous merging and splitting gateway should be avoid An Exclusive or Event Gateway should have at most one unnamed outgoing Sequence Flow. An Inclusive Gateway should have all outgoing Sequence Flow named. If a SubProcess is followed by a yes/no Gateway, at least one End Event of the SubProcess should be named to match the Gateway name. Activity Activities should be named Two Activities in the same Process should not have the same name. A Send Task should have an outgoing Message Flow. A Receive task should have an incoming message flow. If a SubProcess is followed by a Gateway labeled as a question, it must have more than one End Event. Message Flow A Message Flow should be named with the name of the Message.
3.3.4 3.3.5 3.3.6 3.3.7 3.3.8 3.3.9 3.3.10 3.4 3.4.1 3.4.2 3.4.3 3.4.4 3.4.5 3.5 3.5.1
Appendix
300
F A Business Process of Financial Services Provisioning
F.1
Introduction
This document describes the business process implemented by financial institutions for providing financial self-services to customers, in public spaces. The business process is a compound of human and automated activities, supported by a computerized telecommunications device known as automated teller machine (ATM). With the implementation of this business process, the financial institutions have cost savings due to customers operating in self-service mode, i.e. without direct sup-port of an institution’s employees, and also by benefiting from institution’s brand exhibition, as well as the profits attained from advertising sold through ATMs. To access the services, a customer must have an account, at one of the banks associated to the ATM network, and use a magnetic card to interact with an ATM. Customers are able to do financial activities such as: to query their account balance, to withdraw cash (i.e., take money out of an account) and deposit funds (i.e., place cash or checks into an account). Beside those automatic activities, human activities must also be done, in the context of the business process to provide quality financial services to its customers. Among those activities we name a few such as cash replenishment, consumables (toner, paper) replacement, and deposit envelopes removal. Before the financial services is made available to customers, a critical task is the design and deploy of the business process, and the correspondent IT service, support-ed by the ATM. First of all, the venue of ATMs installation must be adequately planned. ATMs spots 301
F.1. Introduction might include, beside the own financial institutions facilities (i.e. branches), other locations such as shopping centers. Making deals with store owners and gas stations for the housing could be also an option. Busiest locations (that generate an average of 600 transactions a month) are preferable, which means spots that get good foot traffic and lot of people buying things. Less visited places should have a minimum around 300 transactions a month. When seeking for a location, the key is to find a place where the revenue will outweigh the installations and the ATM’s operation costs. The housing cost can amount, depending on how busy is the place, from 30 e to 400 e a month. Regarding revenues, from receipt coupons to multimedia ads, automated teller machines can draw profits, on average between 1,500 e and 3,000 e per ATM per month. The business process that provides the financial service must have certain quality attributes (also known as non-functional requirements such as performance1 , availability2 ). For instance, in terms of performance, the maximum acceptable response time by ATM’s operations must be 5 seconds. Regarding availability, the monetary cost of downtime, if a machine does 600 transactions a month, could be estimated in 60 e per day. Besides this tangible cost, there are less quantifiable costs such as the financial institution loss of customer loyalty and business reputation, since this financial service is a kind of billboard for the bank’s brand. So, the financial service would require an availability for instance of 99%, which would be equivalent to a non-functional requirement such as de following one: the service must be online every day from 00:00 to 24:00 with only one hour off for maintenance; this means that from 00:00 to 24:00 and outside the mentioned period of maintenance, in 365 days of the year only 0.01 of the time (83.95 hours in total and no more than 2 hours each time from 08:00 to 23:00) the financial service can be non-operational. For ensuring the above mentioned quality attributes of financial services, the business process must be carefully administered, by the service desk. This department of IT monitors the messages sent and received regarding the financial service. Those messages are related to its regular transactions as well as component malfunction, running out of paper or toner, the need for cash replenishment or deposits removal. In case of an incident (e.g. lack of paper or toner, lack of cash, deposits container full), either members of the financial institution (e.g. a bank branch on regular hours), or outsourcing partners (a security services company if the incident occurred out of office hours), are warned by service desk to solve the cause of the incident, within a period of say 2 hours, specified in the service level agreement (SLA) contract previously signed on. For accounting of resources usage (efficiency) the contract with the security ser-vices company costs 50 e per visit. One month of security service costs 200 e per ATM, since each ATM requires a minimum of four visits per month. Therefore, each ATM needs at 1
Performance is defined as the response time perceived by the end user, i.e., the interval between the instant at which an operator at a terminal enters a request for a response from a computer and the instant the response is received at a terminal. 2 Availability is the ratio of the total time a functional unit is capable of being used during a given interval to the length of the interval.
Appendix
302
F.2. The IT Service support of Business Process least 100 transactions a month just to pay for the security services company visit. For ATM parts fault, the outsourcers are the hardware suppliers, which beside the preventive maintenance, must also replace any malfunctioning ATM part. Four hours is admissible time between service desk notification and ATM recovery due to a malfunction. Each visit due to an emergency repair is charged at 100 e. The regular maintenance costs of each ATM are 50 e for each. All these costs must be taken in account when figuring global amount of operational costs.
F.2
The IT Service support of Business Process
The main IT support of the business process is the ATM system which communicates with the bank’s central computer over an appropriate communication link. The ATM system has the following peripheral devices attached: a magnetic stripe reader for reading the ATM card; a screen that displays messages to the user; a keypad that receives numeric input form the user; a deposit slot that receives deposit envelopes from the user; a cash dispenser that dispenses cash (in multiples of 5 e) to the user; a printer for printing customer receipts; and a key-operated switch to allow an operator to start or stop the machine. Each ATM services one customer at a time. The customer is required to insert an ATM card and enter a personal identification number (PIN) - both of which are sent to the bank’s computer for validation as part of each transaction. To authenticate a user and perform transactions, the sent information is compared with the bank’s ac-count database. For each bank account, the database stores an account number, a PIN and a balance indicating the amount of money in the account.
F.3 F.3.1
Main Activities of Business Process Startup
The business process is ready for providing financial services to customers after the supervisor switches on the ATM system, enters the amount of money currently in the cash dispenser, and a connection is established with the bank. A message is sent by the ATM system to the service desk control system stating the beginning of operations. The ATM maintains also an internal log of transactions to facilitate resolving ambiguities arising from a hardware failure in the middle of a transaction. Entries are made in the log when the ATM is started up and shut down, for each message sent to the bank (along with the response back, if one is expected), for the dispensing of cash, and for the receiving of a deposit or check. Log entries may contain card numbers and euro amounts, but for security will never contain a PIN. A copy of each message is also send to the service desk control system that can provide actions from outsourcers regarding cash or supplies replenishment as well as replacement of malfunction parts. Appendix
303
F.3. Main Activities of Business Process
Figure F.1: Business Process Model of Financial Services Provisioning
F.3.2
Open Financial Session
After the start up activity is finished, several financial sessions can happen. A financial session begins when a customer inserts a magnetic card into the card reader slot of the ATM machine that scans it. If the reader cannot read the card due to improper insertion or a damaged stripe, the card is ejected, an error screen is displayed, the session is aborted, the event is locally registered and a status code message is sent to the service desk control system. The customer is asked to enter his/her PIN, and is then allowed to perform a transaction, by choosing one of the possible types. If the customer wants to make another operation the menu is presented again allowing her/him to choose another transaction. If no more operations are desired, the customer can choose the exit option, to get the card ejected from the machine and the session ended. The customer may abort the session by pressing the Cancel key when entering a PIN or choosing a transaction type. An invalid PIN is detected within a transaction when the bank reports that the customer’s transaction is disapproved due to an invalid PIN. The customer is required to re-enter the PIN and the original request is sent to the bank again. If the bank now approves the transaction, or disapproves it for some other reason, the original request is continued; otherwise the process of re-entering the PIN is repeated. Once the PIN is successfully re-entered, it is used for both the current transaction and the next transactions in the session. If the customer fails three times to enter the correct PIN, the card is permanently retained, a screen is displayed informing the customer of this and suggesting he/she contact the bank, and the entire customer session is aborted. Appendix
304
F.3. Main Activities of Business Process The customer will then be able to perform several transactions. The card will be retained in the machine until the set of transactions ends, at which point it will be returned to the customer - except as noted above for invalid PIN. To summarize, the sequence of events are following: 1. The screen displays a welcome message and prompts the user to enter an account number. 2. The screen prompts the user to enter the PIN. 3. The user enters a five-digit PIN using the keypad. 4. If the user enters the correct PIN for the account, the screen displays the main menu. If the user enters an incorrect PIN, the screen displays an appropriate message, and then the ATM returns to Step 1 to restart the authentication process. The ATM is able to provide the following services to the customer, displayed as options of the main menu: • A customer is able to make a cash withdrawal from any suitable account linked to the card, in multiples of 5 e. Approval must be obtained from the bank before cash is dispensed; • A customer is able to make a cash deposit to any account linked to the card. After the amount of the deposit is entered into the ATM by the customer, the deposit is subject to currency recognition, acceptance, and recycling if it is cash. A manual verification by an operator is made in case of checks. The ATM counts the cash and gives a detailed receipt to confirm the deposited amount. • A customer is able to make a check deposit to any account linked to the card, in an envelope. After the amount of the deposit is entered into the ATM by the customer, a manual verification by an operator is made in case of checks. The ATM counts the cash and gives a detailed receipt to confirm the deposited amount. • A customer is able to make a transfer of money between any two accounts. • A customer is able to pay routine bills, fees, and taxes (utilities, phone bills, social security, legal fees, taxes, etc.), by entering data that identifies the document being paid, such as the entity that issued the invoice, the payment reference and the amount to be paid. • A customer is able to purchase services (e.g. train, concert, movie tickets, adding pre-paid cell phone / mobile phone credit, lottery tickets, etc.). • A customer is able to make a balance inquiry of any account linked to the card, and print bank statements. • A customer is able to abort a transaction in progress by pressing the Cancel key instead of responding to a request from the machine. • A customer is able to exit the system. Appendix
305
F.3. Main Activities of Business Process
F.3.3
Withdraw Cash
A withdrawal operation is started within a session when the customer chooses this specific transaction type from a menu of options. The withdrawal transaction asks the customer to choose a type of account to withdraw from a menu of possible accounts, and to choose an amount in euros from a menu of possible amounts. The system verifies that it has sufficient money on hand to satisfy the request before sending the transaction to the bank. (If not, the customer is informed and asked to enter a different amount). The withdrawal transaction will then be sent to the bank, along with information from the customer’s card and the PIN the customer entered. If the withdrawal is the operation the customer is doing and the bank reports that the customer’s PIN is invalid, the customer is required to re-enter the PIN and the original request is sent to the bank again. If the bank now approves the transaction, or disapproves it for some other reason, the original request is continued; otherwise the process of re-entering the PIN is repeated. Once the PIN is successfully re-entered, it is used for both the current transaction and the next transactions in the session. If the customer fails three times to enter the correct PIN, the card is permanently retained, a screen is displayed informing the customer of this and suggesting he/she contact the bank, and the entire customer session is aborted, and the customer will not be offered the option of doing another. If the transaction is approved by the bank, the appropriate amount of cash is dispensed by the machine before it issues a receipt. (The dispensing of cash is also recorded in the ATM’s log and service desk control system). Then the customer will be asked whether he/she wishes to do another transaction. If a withdrawal transaction is canceled by the customer, or fails for any reason other than repeated entries of an invalid PIN, a screen will be displayed informing the customer of the reason for the failure of the transaction, and then the customer will be offered the opportunity to do another transaction. All messages to the bank and responses back are recorded in the ATM’s log and also send to the service desk control system. The following steps describe in detail the actions that occur when the user enters the option make a withdrawal: 1. The screen displays a menu containing standard withdrawal amounts: 20 e (option 1), 40 e (option 2), 60 e (option 3), 100 e (option 4) and 200 e (option 5). The menu also contains an option to allow the user to cancel the transaction (option 6). 2. The user inputs a menu selection using the keypad. 3. If the withdrawal amount chosen is greater than the user’s account balance, the screen displays a message stating this and telling the user to choose a smaller amount. The ATM then returns to Step 1. If the withdrawal amount chosen is less than or equal to the user’s account balance (i.e., an acceptable amount), the ATM Appendix
306
F.3. Main Activities of Business Process proceeds to Step 4. If the user chooses to cancel the transaction (option 6), the ATM displays the main menu and waits for user input. 4. If the cash dispenser contains enough cash to satisfy the request, the ATM proceeds to Step 5. Otherwise, the screen displays a message indicating the problem and telling the user to choose a smaller withdrawal amount. The ATM then re-turns to Step 1. 5. The ATM debits the withdrawal amount from the user’s account in the bank’s database (i.e., subtracts the withdrawal amount from the user’s account balance). 6. The cash dispenser dispenses the desired amount of money to the user. 7. The screen displays a message reminding the user to take the money.
F.3.4
Deposit Cash
A deposit cash operation is started within a session when the customer chooses this specific transaction type from a menu of options. A deposit transaction asks the customer to choose a type of account to deposit the money from a menu of possible accounts, and to type in a euro amount on the key-board. The transaction is initially sent to the bank to verify that the ATM can accept a deposit from this customer to this account. If the transaction is approved, the machine accepts the cash from the customer before it issues a receipt. Once the cash has been received, a second message is sent to the bank, to confirm that the bank can credit the customer’s account. (The receipt of an amount of cash is also recorded in the ATM’s log and service desk control system.) A deposit transaction can be canceled by the customer pressing the Cancel key any time prior to inserting the cash for deposit. The transaction is automatically can-celled if the customer fails to insert the bank notes within a period of 2 minutes after being asked to do so. The following steps describe in more detail the actions that occur when the user makes a deposit: 1. The screen prompts the user to enter a deposit amount or cancel the transaction. 2. The user inputs a deposit amount or cancels using the keypad. 3. If the user specifies a deposit amount, the ATM proceeds to Step 4. If the user chooses to cancel the transaction, the ATM displays the main menu and waits for user input. 4. The screen displays a message telling the user to insert the bank notes into the deposit slot. Appendix
307
F.3. Main Activities of Business Process 5. If the deposit slot receives a deposit within two minutes, the ATM credits the deposit amount to the user’s account in the bank’s database (i.e., adds the deposit amount to the user’s account balance). [Note: The deposit will be rejected whether a false bank note is detected in the deposit or a discrepancy exists between the cash amount introduced by the customer and amount counted by the ATM system. When neither of these events occurs, the bank appropriately updates the user’s balance stored in its database and the money is recycled and immediately available for withdrawal.] If the deposit slot does not receive an amount to deposit within this time period, the screen displays a message that the system has canceled the transaction due to inactivity. The ATM then displays the main menu and waits for user input. 6. In the case of a valid deposit, a second message will be sent to the bank indicating that the customer has deposited a certain amount of cash. (If the customer fails to deposit the correct amount within the timeout period, or presses cancel in-stead, no second message will be sent to the bank and the deposit will not be credited to the customer.) 7. The ATM provides the customer with a printed receipt for the successful transaction, showing the date, time, machine location, type of transaction, deposit’s amount, and account balance.
F.3.5
Deposit Check
A check deposit operation is started within a session when the customer chooses this specific transaction type from a menu of options. A check deposit transaction asks the customer to choose a type of account to deposit to from a menu of possible accounts, and to type in a euro amount on the key-board. The transaction is initially sent to the bank to verify that the ATM can accept a deposit from this customer to this account. If the transaction is approved, the machine accepts an envelope from the customer containing checks before it issues a receipt. Once the envelope has been received, a second message is sent to the bank, to confirm that the bank can credit the customer’s account - contingent on manual verification of the deposit envelope contents by an operator later. (The receipt of an check envelope is also recorded in the ATM’s log and service desk control system.) A check deposit transaction can be canceled by the customer pressing the Cancel key any time prior to inserting the envelope containing the deposit. The transaction is automatically canceled if the customer fails to insert the envelope containing the deposit within two minutes after being asked to do so. The following steps describe in more detail the actions that occur when the user makes a deposit: 1. The screen prompts the user to enter a total check deposit amount or cancel the Appendix
308
F.3. Main Activities of Business Process transaction. 2. The user inputs a total check deposit amount or cancels using the keypad. 3. If the user specifies a check deposit amount, the ATM proceeds to Step 4. If the user chooses to cancel the transaction, the ATM displays the main menu and waits for user input. 4. The screen displays a message telling the user to insert a check deposit envelope into the deposit slot. 5. If the deposit slot receives a deposit envelope within two minutes, the ATM credits the deposit amount to the user’s account in the bank’s database (i.e., adds the deposit amount to the user’s account balance). [Note: This money is not immediately available for withdrawal by the customer. The bank first must physically verify the amount of cash in the deposit envelope, and any checks in the envelope must clear (i.e., money must be transferred from the check writer’s account to the check recipient’s account.) When either of these events occurs, the bank appropriately updates the user’s balance stored in its database. This occurs independently of the ATM system.] If the deposit slot does not receive a deposit envelope within this time period, the screen displays a message that the system has canceled the transaction due to inactivity. The ATM then displays the main menu and waits for user input. 6. In the case of a valid check deposit, a second message will be sent to the bank indicating that the customer has deposited a certain amount of checks. (If the customer fails to deposit within the timeout period, or presses cancel instead, no second message will be sent to the bank and the deposit will not be credited to the customer.) 7. The ATM provides the customer with a printed receipt for the successful transaction, showing the date, time, machine location, type of transaction, check’s amount, and account balance.
F.3.6
Transfer Amount
A transfer transaction asks the customer to enter the number of an account to transfer to, and to type in a euro amount on the keyboard. No further action is required once the transaction is approved by the bank before printing the receipt. A transfer transaction can be canceled by the customer pressing the Cancel key any time prior to entering a euro amount.
F.3.7
Query Balance
A query transaction asks first the customer to confirm the operation. In case of a positive answer the ATM retrieve the balance from the bank’s database. No further action is required once the transaction is approved by the bank before printing the receipt. An Appendix
309
F.3. Main Activities of Business Process inquiry transaction can be canceled by the customer pressing the Cancel key any time prior to confirm the account inquire.
F.3.8
Shutdown
The ATM machine can only be turned off when it is not servicing a customer. So, the supervisor must make sure that no customer is using the ATM system, and then he/she can turn the switch to the off position. The connection to the bank is then shut down. A status code message is sent to the service desk control system conveying the regular ATM’s shut down. The operator is now free to remove deposited checks, and make the replenishment of cash, toner, and blank receipts, or do any maintenance of spares.
F.3.9
Spares Replacement
If the ATM’s device reader cannot read the card, the card is ejected, an error screen is displayed, the session is aborted, the event is locally registered and a status code message is sent to the service desk control system.
F.3.10
Information Sources
1. Automated teller machine: http://en.wikipedia.org/wiki/Automated teller machine 2. Object-Oriented Software Development Course: http://math-cs.gordon.edu/courses/cs211/ATMExample/ 3. ATM Requirements Document:
http://www.qualityapps.com/Contents/Intranet/Projects/ATM/ATM Requirements Document.htm 4. ATM Placements: http://www.atmmachine.com/atm-placement.html 5. How to Operate ATM Machines for Profit: http://www.ehow.com/how 5108080 operate-atm-machines-profit.html#ixzz1fzjGuLkp 6. How Start Your Own Your Cutting Edge ATM Machine Business: http://www.ehow.com/how 5513587 start-edge-atm-machine-business.html#ixzz1fzipdaXj 7. The ABCs of ATMs: http://www.ehow.com/info 8068914 abcs-atms.html#ixzz1fzlG2WRQ 8. Reaching the ATM Customer With Intelligent Personalization: http://jimmarous.blogspot.com/2010/11/reaching-atm-customer-with-intelligent.html Appendix
310
F.3. Main Activities of Business Process 9. How to Make an ATM Deposit: http://www.ehow.com/how 2096617 make-atm-deposit.html
Appendix
311
[This page is intentionally blank]
G Business Process Modeling Example
Providing Financial Services via ATMs
G.1
Introduction
This modeling example describes a business process implemented by financial institutions for providing financial self-services to customers, in public spaces. The business process is a compound of human and automated activities, supported by a computerized telecommunications device known as automated teller machine (ATM). With the implementation of this business process, the financial institutions have cost savings due to customers operating in self-service mode, i.e. without direct sup-port of an institution’s employees, and also by benefiting from institution’s brand exhibition, as well as the profits attained from advertising sold through ATMs. To access the services, a customer must have an account, at one of the banks associated to the ATM network, and use a magnetic card to interact with an ATM. Customers are able to do financial activities such as: to query their account balance, to withdraw cash (i.e., take money out of an account) and deposit funds (i.e., place cash or checks into an account). Beside those automatic activities, human activities must also be done, in the context of the business process to provide quality financial services to its customers. Among those activities we name a few such as cash replenishment, consumables (toner, paper) replacement, and deposit envelopes removal. 313
G.2. Business Process Overview
G.2
Business Process Overview
The business process is ready for providing financial services to customers after the supervisor switches on the ATM system, enters the amount of money currently in the cash dispenser, and a connection is established with the bank. A message is sent by the ATM system to the service desk control system stating the beginning of operations. The ATM machine can only be turned off when it is not servicing a customer. So, the supervisor must make sure that no customer is using the ATM system, and then he/she can turn the switch to the off position. The connection to the bank is then shut down. A status code message is sent to the service desk control system conveying the regular ATM’s shut down (see Figure G.1).
Figure G.1: Overview of the Business Process for Providing Financial Services After the start up activity, a financial session begins after a customer inserts a magnetic card into the card reader slot of the ATM machine that scans it. If the reader cannot read the card due to improper insertion or a damaged stripe, the card is ejected, an error screen is displayed, the session is aborted, the event is locally registered and a status code message is sent to the service desk control system (see Fig. G.2). The customer is required to enter a personal identification number (PIN) - which is sent, as well as the information in the card, to the bank’s computer for validation as part of the first transaction. The customer is asked to perform a transaction, by choosing one of the possible types. To authenticate a user and perform transactions, the sent information is compared with the bank’s account database. For each bank account, the database stores an account number, a PIN and a balance indicating the amount of money in the account. The customer may abort the session by pressing the Cancel key when entering a PIN or choosing a transaction type. Appendix
314
G.2. Business Process Overview
Figure G.2: Detail of the Sub-Process Make Financial Operation
If the customer wants to make another operation the menu is presented again allowing her/him to choose another transaction. If no more operations are desired, the customer can choose the exit option, to get the card ejected from the machine and the session ended. In Figure G.3 are detailed the activities that are part of the Choose Operation subprocess. One of them is the sub-process Withdraw Cash, which is explained in more detail in next section.
Figure G.3: Detail of the Sub-Process Choose Operation
Appendix
315
G.2. Business Process Overview
G.2.1
Sub-Process Withdraw Cash
A withdrawal operation is started within a session when the customer chooses this specific transaction type from a menu of options. The customer is asked to choose a type of account to withdraw from a menu of possible accounts, and to choose an amount in euros from a menu of possible amounts. The system verifies that it has sufficient money on hand to satisfy the re-quest before sending the transaction to the bank. (If not, the customer is informed and asked to enter a different amount). The withdrawal transaction will then be sent to the bank, along with information from the customer’s card and the PIN the customer entered. If the bank reports that the customer’s PIN is invalid, the customer is required to reenter the PIN and the original request is sent to the bank again. If the bank now approves the transaction, or disapproves it for some other reason, the original request is continued; otherwise the process of re-entering the PIN is repeated. Once the PIN is successfully reentered, it is used for both the current transaction and the next transactions in the session. If the customer fails three times to enter the correct PIN, the card is permanently retained, a screen is displayed informing the customer of this and suggesting he/she contact the bank, and the entire customer session is aborted, and the customer will not be offered the option of doing another. If the transaction is approved by the bank, the appropriate amount of cash is dispensed by the machine before it issues a receipt. (The dispensing of cash is also recorded in the ATM’s log and service desk control system). Then the customer will be asked whether he/she wishes to do another transaction. If a withdrawal transaction is canceled by the customer, or fails for any reason other than repeated entries of an invalid PIN, a screen will be displayed informing the customer of the reason for the failure of the transaction, and then the customer will be offered the opportunity to do another transaction. All messages to the bank and responses back are recorded in the ATM’s log and also send to the service desk control system.
G.2.2
Required Modeling Work
The work required is that you make a BPMN model of the Withdraw Cash subprocess based upon the information above, using the tools and the instructions provided in more detail by the experience monitor.
G.2.3
Proposed Solution for the Modeling Case
Appendix
316
G.2. Business Process Overview
Figure G.4: Detail of the Sub-Process Withdraw Cash
Figure G.5: Detail of the Sub-Process Receive Withdraw Data
Figure G.6: Detail of the Sub-Process Handle Withdraw Approval
Appendix
317
G.2. Business Process Overview
Figure G.7: Detail of the Sub-Process Finalize Withdraw
Appendix
318
H A Process-Oriented Approach for BPMN modeling
In a world driven by quality where organizations are moving to quality frameworks such as Total Quality Management (TQM) or Six Sigma, we need to assess modeling processes quality, as also done with data quality [WW96], and software process quality [ISO04a, SEI10c, SEI10b, SEI10a]. Quality in processes is a multidimensional concept inherently perceived during process execution through processes’ outcomes1 . For measuring process qualities, thresholds need to be specified, against which quality conformance should be evaluated. The process’ quality is the degree to which the quality characteristics of the processes’ outcomes satisfies the stated and implied needs of its various stakeholders, and thus provide them the expected value. The choice of the relevant process quality properties2 is primarily based upon the domain where the process elicitation is done. For instance, in the realm of IT services [BPV05], some of the mentioned process execution quality characteristics (e.g. availability, responsiveness, security) [SMJ00] are specified and assessed through the ServiceLevel Management (SLM) process using suitable metrics [Smi08]. Having taking a product-oriented approach in the current dissertation, we intend as future work to pursuit a process-oriented approach to quality in BPMN modeling. The attention focus of the process-oriented approach is the definition and assessment of the set of quality attributes that processes’ outputs must attain. Therefore, alongside 1
In this context, the reference to processes quality, means processes’ outcomes quality characteristics either at process design-time or execution-time. 2 The qualities of a process are also known as constraints, quality attributes, quality characteristics [SG05], Non-Functional Requirements (NFRs), and softgoals [CNYM00].
319
information regarding the characteristics of outputs, the processes specification, according to this approach, should also contain information about the relevant domain dependent quality characteristics (e.g. response time, availability, accuracy) of the provided products and services. In line with the process-oriented approach, processes models, as outcome of process modeling, should also provide information regarding the value attained by the stakeholders, i.e., the beneficiaries of the processes. Current BPMN standard has a lopsided emphasis in the functional aspects (i.e. controlflow, data) of processes, without explicit mention both the goals to be achieved, and the quality characteristics of the provided outcomes, which is faced as technical issues left to be handled at the level of the supporting systems. To accomplish the aim of using BPMN for the specification and assessment of process quality characteristics, one must improve BPMN with additional meta-elements addressing the process context. Hence, BPMN models should be complemented with the intentional information [Myl98] (e.g., goals, quality characteristics, metrics, measurement units, etc.), that enables processes’ quality specification at design phase, as well as the subsequent assessment at run-time. The concept of goals is one of the concepts from the intentional dimension, which defines the process context, by establishing why the process is done and enabling to assess how good is the value delivered by the process [BPJ+ 10]. The verification of possible deficits of concepts in the BPMN regarding intentional dimension can be done through an ontological comparison. However, the BWW, one of the most used ontologies for conceptual modeling analysis, does not cover the intentional dimension. So, our first proposal is extending the BWW ontology to address the intentional dimension. The resulting extended BWW will be used to discover the constructs regarding processes’ quality not included in the BPMN metamodel. The derived eBWW ontology will be used as framework for comparison and analysis of modeling languages (process modeling languages are a particular case), namely regarding the coverage by the modeling language concerning constructs required to represent quality characteristics. Based on the ontological comparison, our second proposal will be a set of BPMN metamodel extensions, with meta-classes and meta-associations. The meta-classes will supplement the lack of constructs in BPMN that allow the specification and the follow up assessment of softgoals, such as the elapsed time between request and outcome delivery of a service (performance), the resources consumption for services delivered (efficiency), or the period of time the service must be accessible to the requester (availability). Some other examples of relationships that we need to take into account are: (1) if an activity has goals assigned, then the deliverables’ quality characteristics should be measurable and compared with the activity’s goals; (2) some quality characteristics may impact negatively with others (e.g. response time vs accuracy), so the trade-off among those characteristics must be established; (3) the correlation among resources and quality characteristics should be specified, to know the amount of resources to be used to achieve a certain level of a quality attribute. Appendix
320
The drawback of the inclusion of more symbols covering aspects such as quality, in a language with rich semantics such BPMN, would be more complex process diagrams, to the point that would make the modeling language unusable. So, the challenge is how to address quality characteristics concerning processes without increasing the essential complexity of BPMN models, thus jeopardizing its applicability. Since process models can frequently change, we need a representation that ensures the abstractness and usefulness of the processes descriptions from domain specification to systems implementation. This can be attained using a goals representation, which allows capturing the reason for a process, at the design phase from a business perspective, as well as, the requirements for process execution at run-time phase. Therefore, the use of goals structures enable a top-down approach that starts on high-level business goals and ends on operational goals, supported by low-level human or IT based activities. To build up an intentional dimension on BPMN we should look for the research done till now, regarding goals, in the discipline of Requirements Engineering (RE), because substantial work on RE emphasize the quality aspects besides functional requirements of software artifacts [YM98, VL01, Kav02, KL04, RW05]. Of particular interest is the perspective taken in Goal-Oriented Requirements Engineering (GORE), emphasizing goals role in the system design process [MCY99]. In GORE, real-world problems are largely non-functionally oriented (e.g., poor productivity, slow processing, high cost, low quality, and unhappy customer) [CL09]. GORE approaches with significant contributions include: the Goal-Based Requirements Analysis Method (GBRAM) [Ant96], the NFR Framework [MCN92, CN95, CNYM00, CL09], the Knowledge Acquisition in autOmated Specification (KAOS) methodology [DFL91, DvLF93, MHO06, vL09], the i* family, which includes: (1) the i* approach [YM94b, YM94a, YML96, Yu97]; (2) the Tropos [MKC01, GKMP04, BPG+ 04] [GMS05], and the extension Formal Tropos [FPMT01]; (3) the Goal Requirements Language (GRL) [UoT12, DHP05, MHO07]. By surveying GORE approaches, we expect to be able to assess the adaptation needed by methods from those approaches, to be used in the BPMN context [DSP09, DP11]. We found till now a main limitation in GORE approaches regarding how quantitative aspects of requirements are dealt with: the measurement of different contributions of low-level goals and their weighting on the computation and measurement of top goals. Hence, our third proposal is to derive a kind of graph based diagram, inspired by existing state-of-the-art GORE approaches, instantiated from the extended BPMN metamodel. We want to convey with the graph diagram the network of goals to be achieved, the problems or obstacles to be avoided, the synergistic and conflicting goals, alternative solutions to mitigate the problems, and the best alternative solution to be selected, as well as the interrelationships of goals and quality characteristics. An algorithm should be provided for computation of forecasted and actually reached values of some particular quality attribute. The difference between the two values (actual and estimated) can be seen as a measure of the nonconformity or the degree of violation of agreed contracts with stakeholders. The label propagation procedure to be used in our Appendix
321
approach, could be inspired although in a different way, from the one used in the NFR framework [CNYM00]. Our algorithm should be used both at the design phase for evaluation of process specification and at run time, for assessment of possible violations of predefined quality characteristics based on collected data regarding the organization’s operations. In our proposal, relations between goals and activities should be established. A similarity between Tropos [MKC01] and our approach is that the goal structures are graphs. An advantage of our proposal is that all used concepts (dynamic or intentional) are part of the BPMN language, so no other external language is needed for processes’ goals specification and assessment. For the sake of concreteness of our proposals we want to validate the results through an empirical study regarding IT services. These kind of services are built upon the technical infrastructure, as well as on systems and application software, to support processes. IT services can be depicted using BPMN models3 . The specification and assessment of goals and NFRs for IT services, we are particularly interested in, are usually part of Service-Level Agreements (SLA) contracts [Sal04] among customers and IT providers. The goals and NFRs specify thresholds that should be accomplished by the providers regarding certain quality characteristics of IT services (e.g. maximum time to recover or repair, response time, availability, accuracy, capacity and security). The SLA specification and assessment of IT services, can be seen in the context of our proposals, as an instance of the meta-problem of processes quality characteristics specification and assessment at design and execution phases of processes life cycle. The specification and the assessment of processes’ quality characteristics will be validated through a sample of five hundred thousand database records (BugZilla4 ) regarding tracking issues and bug reports of Mozilla Firefox browser downloaded from the Mozilla Foundation web site5 . We have been publishing to date some work on processes’ quality, mainly focused in its application to the realm of IT Services [FCBeA08, CBeA09, CBeA10a, CBeA10b, CBeAA11b, CBeAA11a].
3
See for instance http://en.it-processmaps.com/products/itil-process-map-visio.html http://www.bugzilla.org/ 5 http://www.mozilla.org/foundation/ 4
Appendix
322