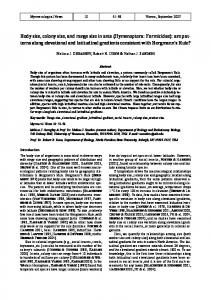
The Journal of Neuroscience, December 1, 2002, 22(23):10267–10276
Quantal Size and Variation Determined by Vesicle Size in Normal and Mutant Drosophila Glutamatergic Synapses Shanker Karunanithi,1 Leo Marin,1 Kar Wong,2 and Harold L. Atwood1 Departments of 1Physiology and 2Statistics, University of Toronto, Toronto, Ontario, Canada M5S 1A8
Quantal size and variation at chemical synapses could be determined presynaptically by the amount of neurotransmitter released from synaptic vesicles or postsynaptically by the number of receptors available for activation. We investigated these possibilities at Drosophila glutamatergic neuromuscular synapses formed by two separate motor neurons innervating the same muscle cell. At wild-type synapses of the two neurons we found a difference in quantal size corresponding to a difference in mean synaptic vesicle volume. The same finding applied to two mutants (dlg and lap) in which synaptic vesicle size was altered. Quantal variances at wild-type and mutant synapses
were similar and could be accounted for by variation in vesicular volume. The linear relationship between quantal size and vesicular volume for several different genotypes indicates that glutamate is regulated homeostatically to the same intravesicular concentration in all cases. Thus functional differences in synaptic strength among glutamatergic neurons of Drosophila result in part from intrinsic differences in vesicle size. Key words: neuromuscular junction; Drosophila; vesicle size; dlg mutant; quantal size; quantal variance; glutamate; tumor suppressor genes; synaptic transmission; synaptic strength; ultrastructure; lap mutant
Strength of synapses governs reliability and effectiveness of communication between neurons and target cells (Murthy et al., 1997). Synapses display a wide range of strength arising from presynaptic and postsynaptic variables that are not yet fully understood. Ultrastructural and molecular differences among synapses contribute to their functional diversity (Atwood et al., 1997; Schikorski and Stevens, 1997; Staple et al., 1997; Msghina et al., 1998; Walmsley et al., 1998; Thomson, 2000). In Drosophila we found ultrastructural features related to functional differences (quantal size and variance) between two glutamatergic motor inputs innervating the same muscle cell. Genetic modification of synaptic vesicle size affected quantal size, indicating that presynaptic mechanisms contribute to the production of different quantal sizes. When a synaptic vesicle discharges its content of transmitter onto the postsynaptic receptor patch at a fast chemical synapse, a small current is generated, which is termed the “quantal current.” The size of this quantal event varies among synapses and also at an individual synapse. Several studies have supported the hypothesis that quantal variation results from variation in synapse size and/or postsynaptic receptor number and density (Nusser et al., 1997; Oleskevich et al., 1999). Others have argued that variation in the amount of transmitter released by synaptic vesicles is the major determinant of quantal size and variance (Bekkers et al.,
1990; Liu et al., 1999; Engel et al., 2001; Hanse and Gustafsson, 2001; Ishikawa et al., 2002). Both presynaptic structures (synaptic vesicles) and postsynaptic structures (receptor-bearing postsynaptic membrane) could, in principle, affect quantal size; the amount of released neurotransmitter varies with vesicle volume (Bekkers et al., 1990; Frerking et al., 1995; Finnegan et al., 1996; Bruns et al., 2000; Colliver et al., 2000), whereas the postsynaptic response depends on the number of activated receptors, which varies with synapse size in many cases (Nusser et al., 1997; Oleskevich et al., 1999; Takumi et al., 1999). Defined glutamatergic synapses of Drosophila, in which ultrastructure can be modified genetically and the physiological consequences can be assessed, provide an advantageous experimental approach to this basic question [as demonstrated by Zhang et al. (1998)]. We examined whether differences in quantal size and variance are linked to differences in vesicle size or synaptic area. We used naturally occurring and genetically induced variations in vesicle size and synapse size in identified motor neurons of Drosophila to test these possibilities. Our evidence supports a presynaptic basis for quantal effectiveness. A preliminary report of these findings has been presented in abstract form (Atwood et al., 1999).
Received July 22, 2002; revised Sept. 23, 2002; accepted Sept. 23, 2002. This work was supported by a grant from the Natural Science and Engineering Council of Canada to H.L.A. We thank Sorana Ciura, Winnie Lam, Carolyn Li, and Alan Wong for help with electrical and ultrastructural data analysis; Tina Piper and Dougal Tervo for modifications to the IgorPro 3 analysis subroutines; Drs. Greg Macleod, Milton Charlton, Michael Jackson, William Van der Kloot, Bryan Stewart, Konrad Zinsmaier, and Bruce Walmsley for helpful discussions; Drs. Vivian Budnik and Michael Gorczyca (University of Massachusetts) for providing us with the dlgm52 Drosophila stocks; Dr. Bing Zhang (University of Texas, Austin, TX) for providing us with lap mutants; and Marianne Hegstro ¨m-Wojtowicz for help with the preparation of this manuscript. Correspondence should be addressed to Dr. S. Karunanithi, Department of Physiology, Medical Sciences Building, University of Toronto, 1 King’s College Circle, Toronto, Ontario, M5S 1A8, Canada. E-mail:
[email protected]. Copyright © 2002 Society for Neuroscience 0270-6474/02/2210267-10$15.00/0
MATERIALS AND METHODS Fl y stock s. C anton-S (C S) wandering third instar larvae were selected for initial analysis of glutamatergic nerve terminals on abdominal muscles 6 and 7. These larvae served as controls for discs-large, dlgm52 larvae (Lahey et al., 1994) selected for analysis of quantal synaptic events and ultrastructure. The dlgm52 allele has a deficiency in the region Df(1)N71(df) (deficiency stock was obtained from the Bloomington Stock C enter, Bloomington, I N). The dlgm52 females used in these studies were obtained by crossing Df(1)N71/ Y; Dp (1:2) v[65b]/⫹ ⫻ dlg/ FM7. The selected female wandering third instar larvae were found to have large tumors in the brain and imaginal discs (Lahey et al., 1994). dlg was driven in both nerve and muscle to rescue the mutant phenotype via the P[Gal-4] insertions, BG380 and BG487, respectively. Female larvae, dlgm52 BG380/ Df(1)N71; BG487/ UAS dlg⫹, with normal-looking brains were selected for analysis (Budnik et al., 1996). Analysis of quantal size also was performed in lap/df mutant larvae, selected as
Karunanithi et al. • Vesicle Size Determines Quantal Size
10268 J. Neurosci., December 1, 2002, 22(23):10267–10276
described by Z hang et al. (1998). Stocks were reared on cornmeal medium (at 25°C, 60 –70% relative humidity). Physiolog ical procedures. E xperiments were performed on muscle 6, abdominal segment 3 at room temperature. This muscle is innervated by two glutamatergic motor neurons with different physiological properties (Kurdyak et al., 1994; L nenicka and Keshishian, 2000). The preparation was bathed in hemolymph-like solution (HL3) of the following composition (in mM): 70 Na ⫹, 5 K ⫹, 1 C a 2⫹, 20 Mg 2⫹, 10 NaHC O3, 5 trehalose, 115 sucrose, and 5 N,N-bis(2-hydroxyethyl)-2-aminoethanesulfonic acid (BES) (Stewart et al., 1994). Nerve terminals were viewed live with an upright microscope (Optiphot-2, Nikon, Tokyo, Japan) by using a 40⫻ water immersion lens and Nomarski optics. Images were captured and displayed on a computer (Apple Macintosh 7500/100) with a low-light-intensity TV camera (Panasonic W V-BP310, Secaucus, NJ). Electrical recordings. Simultaneous intracellular and macropatch recordings of spontaneous quantal events were made with an Axoclamp-2A amplifier, as described previously (Wong et al., 1999). Impalements displaying resting membrane potentials more negative than –70 mV throughout the course of the experiment were chosen for analysis. The MacLab/4s data acquisition system (AD Instruments, Sydney, Australia) was used to capture and store data on the same computer used simultaneously for the visualization of nerve terminals. Focal macropatch electrodes (tip diameters of ⬃5 m) were filled with HL3 solution; electrodes of this size enclosed a single bouton. Well separated boutons were selected for recording after the preparation had been bathed in the mitochondrial dye 3,3⬘-diethyloxadicarbocyanine iodide [DiOC2(5)] at a concentration of 0.3 M in HL3 to aid visualization. The dye was applied for 45 sec, and then the preparation was rinsed thoroughly in HL3 solution before recording (Karunanithi et al., 1999). One bouton was recorded per larva; n represents the number of boutons from which recordings were made. The externally recorded quantal events represent voltage changes in the external solution, as described by del C astillo and Katz (1956). Changes in electrode size, relative to changes in bouton size and in amount of SSR included in the macropatch electrode, do not affect the recorded quantal size (Wong et al., 1999). Furthermore, there was no correlation between bouton surface area and quantal size for either type 1b (r ⫽ 0.28; p ⫽ 0.35; n ⫽ 13) or type 1s (r ⫽ 0.08; p ⫽ 0.78; n ⫽ 15) boutons. This held for boutons of the same muscle fiber and for those of different muscle fibers. Thus quantal size is not related to bouton size within a selected population of boutons. In this preparation macropatch electrodes enclosing a single bouton do not form a tight seal with the surface; seal (or contact) resistances of 0.05– 0.20 M⍀ were measured, which remained constant throughout the recording sessions. The sizes of the externally recorded quantal events were not related to the contact resistance, and the observed differences in quantal size appeared consistently in different recordings, providing a good comparison of relative quantal size among genotypes. Statistical procedures. The statistical procedures outlined here, which were designed to identif y spontaneous quantal events at boutons selected for recording, are modified from those described by Wong et al. (1999). Data were obtained from simultaneous measurements of miniature excitatory junctional currents (mEJC s) and miniature excitatory junction potentials (mEJPs). Because the data constituted a two-component Gaussian mixture of signals and contaminants, the following steps were undertaken: (1) reduce the bivariate data (mEJPi, mEJCi) of independent observations (i ⫽ 1. . . , N ) to one dimension by calculating the angles (␣1. . . , ␣N) the points subtend with the mEJC axis when plotted against one another; (2) classif y the angles (␣i) as signals or contaminants by using the Bayes decision rule. The posterior probability of an angle belonging to the signal group is given by the equation derived from Bayes rule:
P s共 ␣ 兲 ⫽
g s共 ␣ 兲 . g s共 ␣ 兲 ⫹ g c共 ␣ 兲
(1)
The Gaussians gS(␣) and gC(␣) can be described in the general form:
g j共 ␣ 兲 ⫽
1
冑2 j
exp
冋
册
⫺1 共␣ ⫺ j兲2 , 2j2
(2)
where j and j represent the mean and SD of the jth component. Because we assumed it is equally costly to misclassif y a signal or a contaminant, the probability of observations falling into either group can
be assigned the value 0.5. Observations are classified as signals when PS(␣) ⱖ 0.5. Furthermore, it is important to note that the choice of PS(␣) would have minimal effects when signals and contaminants are well separated (76% of our recordings), with the possible inclusion of a very few contaminants into the signal group at low PS(␣) values, or with the possible inclusion of a few signal values into the contaminant group at high PS(␣) values. Either way, the impact on our estimates of quantal size for the signal group will be negligible. Our choice of PS(␣) would have greater effects when signals and contaminants are not well separated (24% of our recordings). Using lower values of PS(␣) would include greater numbers of contaminants in the signal group; the opposite effect would apply for larger PS(␣) values. Therefore, the choice of PS(␣) ⫽ 0.5 is most appropriate for this small percentage of recordings. However, we believe this method works well in all cases because we find that contaminants are always significantly smaller and have longer rise times than signals, consistent with expectations (see Fig. 3). Data measurement and evaluation. MacLab data files were converted to IgorPro 3 (WaveMetrics, Lake Oswego, OR) for measurements and analysis with subroutines especially written for the software (Wong et al., 1999). Measurements of signal and noise voltage amplitudes were obtained as described previously [Redman (1990), his Fig. 1; Karunanithi et al. (1995); Bennett et al. (1996)]. We obtained the distribution of noise amplitudes for each experiment, from which we derived the mean and SD. The mean noise amplitude was zero and displayed a small SD. Because the signal-to-noise ratio (quantal amplitude/SD of the noise) was large, there was no necessity to perform deconvolution analysis to separate the true mEJC distribution from the noise distribution. For example, in measurements from 1b boutons, the mean SD of noise was 20 ⫾ 0.0 V (n ⫽ 11), and signal-to-noise ratios averaged 15.5; also, only 1.3% of the total mEJC variance was attributed to noise. Because the mEJC amplitudes were much larger than 1 SD of the noise, measurements of mEJC amplitudes were affected little by noise. Student t tests were used to assess significance between two groups as well as between nonoverlapping groups. The nonparametric tests, oneway ANOVA and the Kolmogorov– Smirnov (K– S) test, were used to assess statistical differences. In all cases, statistical significance was assessed when p ⬍ 0.05. The mean ⫾ SE are given where necessary. The K– S test was used to compare the shapes of standardized distributions. Distributions were standardized by subtracting the mean and then normalizing to 1 SD (Frerking et al., 1995). The coefficient of variation (C V) is obtained by dividing the SD of a population by its mean. It is expressed as a percentage throughout this paper. Electron microscopy. Larvae were fixed in a mixture of 2% glutaraldehyde and 2% formaldehyde in 0.1 M sodium cacodylate buffer, pH 7.4, for 2 hr, washed in buffer for 1 hr, and postfixed in 2% osmium tetroxide for 1 hr. After a brief wash in buffer, the tissue was dehydrated in ethyl alcohol and propylene oxide, infiltrated in Epon /Araldite, and embedded for 2 d at 60°C. The nerve terminals of motor neuron RP3 produce 1b boutons and nerve terminals of motor neuron 6/7b produce 1s boutons, and both motor neurons innervate muscle fibers 6 and 7 (Keshishian et al., 1993; L nenicka and Keshishian, 2000; Hoang and Chiba, 2001). Series of thin sections were cut from muscles 6 and 7, segment 3, with a diamond knife on a Reichert Ultracut Ultramicrotome and mounted on Formvar-coated slotted grids. Sections were stained in uranyl acetate and lead citrate and photographed on a Hitachi H-7000 transmission electron microscope. Nerve terminals and synapses were digitized and reconstructed with the use of a GTC O (Columbia, MD) digitizing tablet and H V EM threedimensional software (Young et al., 1987); synaptic areas were determined as described previously (Cooper et al., 1995). Synaptic vesicle measurements. The outside diameters of synaptic vesicles were measured at magnifications of 125,000⫻ to 200,000⫻. According to Fox (1988), 200 vesicle profiles suffice to obtain an adequate estimate of the mean size and distribution; we adopted this criterion. Vesicle profiles selected for analysis were circular with grayish translucent cores, were uniformly thick, and had well defined continuous membranes. C aps or ghosts of vesicles were excluded from the measurements. At least three series were used for analysis in each genotype except for the “dlg rescue” larvae, for which two series were used. The thickness of the sections cut for electron microscopy was 75 nm, and observed means of vesicle diameters ranged from 38.5 to 50.5 nm. Histograms of vesicle diameters showed a pronounced right-hand “shoulder” above the modal value in all cases, a clear indication of nonuniform vesicle sizes (see Fig. 1). Because some of the smaller vesicle profiles likely resulted from sections of vesicles cut at less than their diameters, corrections were
Karunanithi et al. • Vesicle Size Determines Quantal Size
J. Neurosci., December 1, 2002, 22(23):10267–10276 10269
Table 1. Observed and corrected synaptic vesicle outer diameters, volumes, and CV Genotype
Measured diameter (mm)
CV
Corrected diameter (mm)
CV
CS 1b CS 1s dlg 1h dlg 1s dlg 1b res. dlg 1s res.
38.5 ⫾ 0.3 45.0 ⫾ 0.4 44.5 ⫾ 0.5 50.5 ⫾ 0.5 36.7 ⫾ 0.2 41.7 ⫾ 0.4
9.6 12.6 14.2 15.5 10.3 16.3
40.5 ⫾ 0.3 (5.2%) 47.8 ⫾ 0.4 (6.2%) 47.2 ⫾ 0.5 (6.1%) 53.9 ⫾ 0.6 (6.7%) 38.5 ⫾ 0.2 (4.9%) 44.2 ⫾ 0.4 (6.0%)
10.0 (4.2%) 13.4 (6.4%) 15.1 (6.3%) 16.5 (6.5%) 10.9 (5.8%) 18.0 (10.4%)
Genotype CS 1b CS 1s dlg 1b dlg 1s dlg 1b res. dlg 1s res.
Calculated volume (ml) 30.7 ⫾ 0.7 50.1 ⫾ 1.3 48.9 ⫾ 1.6 72.2 ⫾ 2.2 26.7 ⫾ 0.5 41.6 ⫾ 1.3
CV 29.8 40.1 47.1 48.3 35.2 57.7
Corrected volume (ml) 35.9 ⫾ 0.8 (19.3%) 60.2 ⫾ 1.6 (20.2%) 58.8 ⫾ 2.0 (20.3%) 89 ⫾ 2.9 (23.3%) 31 ⫾ 0.6 (16.1%) 49.7 ⫾ 1.7 (19.5%)
CV 31.5 (5.7%) 43.0 (7.2%) 50.7 (7.6%) 51.8 (7.3%) 37.0 (5.1%) 62.2 (7.9%)
Corrected values were derived by using the correction of Froesch (1973). Percentage increases from observed values are shown in brackets.
Table 2. Inner diameters and volumes Genotype
Measured diameter (mm)
CV
Corrected diameter (mm)
CS 1b CS 1s dlg 1b dlg 1s dlg 1b res. dlg 1s res.
20.6 ⫾ 0.3 26.4 ⫾ 0.4 25.9 ⫾ 0.4 31.5 ⫾ 0.5 21.9 ⫾ 0.2 25.7 ⫾ 0.4
18 21.5 24.4 24.8 17.3 26.8
21.2 ⫾ 0.3 (2.9%) 27.4 ⫾ 0.3 (3.8%) 26.8 ⫾ 0.5 (3.5%) 32.9 ⫾ 0.5 (4.4%) 22.5 ⫾ 0.2 (3.5%) 26.6 ⫾ 0.4 (3.5%)
Genotype CS 1b CS 1s dlg 1b dlg 1s dlg 1b res. dlg 1s res.
Calculated volume (ml) 5.0 ⫾ 0.2 11.1 ⫾ 0.5 10.8 ⫾ 0.6 19.4 ⫾ 1.0 6.0 ⫾ 0.2 11.4 ⫾ 0.6
CV 56.7 69.9 84.5 76.6 62.5 97.3
Corrected volume (ml) 5.5 ⫾ 0.2 (10%) 12.4 ⫾ 0.6 (11.7%) 12.2 ⫾ 0.7 (13%) 22.5 ⫾ 1.2 (16%) 6.6 ⫾ 0.2 (20.2%) 12.5 ⫾ 0.7 (20.6%)
CV 18.5 (2.8%) 22.3 (3.7%) 25.3 (3.7%) 25.9 (4.4%) 17.9 (3.5%) 28.8 (7.5%) CV 58.7 (3.5%) 73.5 (5.2%) 89.4 (5.8%) 80.5 (5.1%) 69.5 (11.2%) 103.0 (5.9%)
Corrected values were derived by using the correction of Froesch (1973). Percentage increases from observed values are shown in brackets.
made to adjust for this sectioning artifact. We compared the corrections of Froesch (1973) and of Parsons et al. (1995), both of which increased the estimated means of the vesicle populations (see Fig. 1). The correction of Froesch (1973) consistently produced a smaller increase in the mean diameter and was preferred because it also could be used to correct the vesicle size distribution. The variance of vesicle diameter was not affected greatly by the corrections (see Fig. 1). In calculating the volumes of the vesicles, we used both outer diameters (Table 1) and inner diameters (outer diameter less twice the vesicle membrane thickness; Table 2). The average vesicle membrane thickness estimated from all genotypes was 9.2 ⫾ 0.2 nm (n ⫽ 120). In principle, the amount of transmitter in a vesicle should be related to its membranebound content (“inner volume”).
RESULTS Normal occurrence of synaptic vesicle size difference Although recent results from several studies have indicated that quantal size variation may be attributable to variation in the amount of neurotransmitter released from synaptic vesicles (Frerking and Wilson, 1996; Hanse and Gustafsson, 2001), a model of differential transmitter release has been lacking. Possibilities include differences in vesicle size and differences in duration of fusion pore opening or release efficiency (Choi et al., 2000; Elhamdani et al., 2001; Renger et al., 2001). Via ultrastructural
observations of Drosophila synapses, we observed vesicle size differences that could account for mean quantal size and variance. We measured quantal size and synaptic ultrastructural features in two identified Drosophila motor neurons to examine presynaptic and postsynaptic structural features related to quantal amplitude. The two neurons, designated RP3 and 6/7b (Keshishian et al., 1993), innervate the larval ventral longitudinal muscles 6 and 7 and supply synaptic boutons that differ structurally (Atwood et al., 1993; Lnenicka and Keshishian, 2000); the boutons of the RP3 neuron (type 1b) are, on average, larger and possess more synapses, active zones, and mitochondria than those of the common excitor neuron 6/7b (type 1s boutons). Also, the enveloping subsynaptic reticulum (SSR) is more voluminous around type 1b boutons (Atwood et al., 1993) (Fig. 2a). Both neurons use glutamate as their primary neurotransmitter substance (Johansen et al., 1989). In electron micrographs from CS larvae we discovered that synaptic vesicles differ significantly in size in the two bouton types, whereas synaptic contact areas do not (Figs. 2, 3). The two bouton types, embedded in the SSR, are found close together on the muscle fiber surface (Fig. 2); thus the conditions
10270 J. Neurosci., December 1, 2002, 22(23):10267–10276
Karunanithi et al. • Vesicle Size Determines Quantal Size
synaptic vesicles of different mean volume that could, in principle, influence quantal size.
Genetic influence on synaptic vesicle size in dlg mutant larvae
Figure 1. Synaptic vesicle measurements for CS type 1b boutons, illustrating the form of the distribution and the effect on the estimated mean diameter of applying two corrections: that of Froesch (1973)* and that of Parsons et al. (1995)**. For all samples the latter correction produced a larger displacement of the mean value. Note that a substantial fraction of the values appears to the right side of the median, indicating nonuniformity in synaptic vesicle size. Observed and corrected (Froesch, 1973) SDs also are indicated by the horizontal lines; the correction has a small effect on this value.
of fixation would be the same for both. We measured synaptic vesicle diameters (inner and outer) in paired boutons and calculated the corresponding vesicle volumes. Synaptic vesicles in 1s boutons were 18.0% larger in mean corrected outer diameter than those in 1b boutons ( p ⬍ 0.001) (Fig. 3, Table 1). This difference translates into a 67.7% difference in mean vesicle volume ( p ⬍ 0.001; Table 1). The measurements of uncorrected vesicle outer diameter in 1b boutons agree with values reported previously (Zhang et al., 1998). Thus the two neurons normally possess
We observed that synaptic vesicles of the dlg null mutant, dlgm52, known for its postsynaptic structural abnormalities (Lahey et al., 1994; Budnik et al., 1996), are larger than normal in diameter ( p ⬍ 0.001 for both 1b and 1s boutons) (Fig. 3, Tables 1, 2) and volume ( p ⬍ 0.001 for both 1b and 1s boutons; Tables 1, 2). Mutant rescues, in which dlg expression was driven both presynaptically and postsynaptically, exhibited reduced vesicle size in both 1b and 1s boutons (Fig. 3, Tables 1, 2). In fact, vesicles were slightly smaller than in controls ( p ⬍ 0.001 for both 1b and 1s boutons for both diameter and volume); this may relate to the dosage levels of dlg used to drive expression in nerve and muscle tissue. The difference in vesicle size between type 1b and 1s boutons is retained in controls, mutants, and rescues (Fig. 3, Tables 1, 2).
Synaptic contact areas in CS and dlg mutant larvae To assess whether postsynaptic morphological factors relate to quantal size differences, we made serial reconstructions of CS (Fig. 2e), dlgm52 (Fig. 2f ), and dlgm52 mutant rescue boutons, and we measured synaptic contact areas (Fig. 2g). In CS larvae the mean synaptic area is not significantly different between 1b and 1s boutons ( p ⫽ 0.101), in agreement with previous studies (Atwood et al., 1993; Stewart et al., 1996). Individual dlgm52 boutons exhibited unusual features, previously unreported; dlg synapses are significantly larger than in controls (1b, p ⫽ 0.048; 1s, p ⫽ 0.005) and often include “giant” synapses that envelop a larger than normal percentage of the surface area of the bouton (Fig. 2b,c,f ). These large synapses could represent separate synapses that have become fused and enlarged. Three reconstructed dlg 1b boutons and three of 10 dlg 1s boutons were enveloped by a single confluent synapse. At
Figure 2. Ultrastructure of synapses at CS, dlgm52 mutant, and rescued dlg neuromuscular junctions. a, Neuromuscular synapses formed by 1b and 1s boutons in CS larva. b, c, Synapses in a dlgm52 mutant larva (b, 1b; c, 1s). d, Synapses of 1b and 1s boutons in a mutant rescued larva (dlg res.). Synapses (SY ) are delimited by arrowheads; presynaptic dense bodies (active zone structures) are delimited by indicated arrows. Each synapse occurs in association with subsynaptic reticulum (SSR); synaptic vesicles (SV ) are plentiful in all terminals. Note that densely stained synaptic membranes are much more extensive and synaptic vesicles are larger in dlgm52 mutant boutons than in control (CS and dlg res.) counterparts. Scale bar: (in d) a–d, 1.0 m. e, f, Serial reconstructions of type 1b boutons from CS ( e) and dlg ( f) larvae to illustrate a major difference in synaptic structure. Boutons of dlg larvae have larger synaptic areas than controls (red regions); synapses are often confluent. The dense bars are shown in yellow. Scale bars, 1 m. g, Histogram of the size of synaptic areas in CS (1b, 129 synapses, 15 boutons; 1s, 61 synapses, 15 boutons), dlgm52 (1b, 3 synapses, 3 boutons; 1s, 37 synapses, 10 boutons), and dlg res. (1b, 10 synapses, 2 boutons; 1s, 4 synapses, 2 boutons). The estimated CV is presented for each bouton type at the top of the corresponding bar.
Karunanithi et al. • Vesicle Size Determines Quantal Size
J. Neurosci., December 1, 2002, 22(23):10267–10276 10271
Figure 3. The 1s boutons contain larger vesicles than 1b boutons, and dlgm52 mutants contain larger vesicles than controls. Electron micrographs show vesicles contained within 1b and 1s boutons in CS (1b, 198 vesicles; 1s, 254 vesicles), dlgm52 (1b, 215 vesicles; 1s, 247 vesicles), and dlg res. larvae (1b, 319 vesicles; 1s, 325 vesicles). Synaptic vesicles are larger on average in 1s boutons for all cases. Scale bar (for all micrographs), 0.1 m.
Drosophila neuromuscular junctions DLG has important effects on postsynaptic components: clustering of shaker K ⫹ channels and the cell adhesion molecule Fas II, and regulating the extent of the SSR (Koh et al., 2000). The enlargement of synaptic contacts represents an additional effect on synaptic structure. In mutant rescues the synaptic areas returned to near-control sizes for 1b boutons ( p ⫽ 0.97) but were smaller than controls for 1s boutons ( p ⫽ 0.016) (Fig. 2). Thus both presynaptic structures (synaptic vesicles) and postsynaptic structures (SSR and synaptic contact area) are influenced by the dlg gene. Relationships among synapse size, vesicle size, and quantal size can be tested experimentally for CS and dlg mutant synapses.
Definition of quantal events at individual boutons Using a focal macropatch electrode to record synaptic activity extracellularly, we compared quantal size at individual visualized boutons. Type 1b and 1s boutons were identified easily for selective recording (Fig. 4a). However, recording from identified, physically isolated boutons in this manner does not ensure complete electrical isolation, because the SSR in which the boutons are embedded often conducts contaminating signals from adjacent boutons (Wong et al., 1999). “Chemical isolation” of boutons by recording in a Ca 2⫹-free solution while retaining Ca 2⫹ in the macropatch pipette is not feasible, because spontaneous quantal events continue to occur in Ca 2⫹-free solutions. Accordingly, statistical procedures have been developed (Wong et al., 1999) to separate with good confidence the spontaneously occurring quantal signals at a selected bouton from contaminants generated at nearby boutons (Fig. 4b). Spontaneously occurring quantal current events (mEJCs) at individual boutons in CS and dlg mutant larvae were matched with their corresponding mEJPs recorded intracellularly. Plotting mEJC amplitudes against the corresponding mEJPs usually showed two classes of event. The bouton-specific mEJC signals display a quasi-linear covariation of amplitude with corresponding mEJPs (Fig. 4b, open circles); this covariation is absent in contaminants (Fig. 4b, filled circles). The two classes can be distinguished statistically when the observations are reduced to
Figure 4. Separation of quantal events recorded for 1s control bouton into signals and contaminants. a, String of 1b and 1s boutons viewed under DiOC2(5) fluorescence (left). The macropatch electrode is placed on the muscle surface to enclose the 1s bouton from which mEJCs were recorded, seen under Nomarski optics (right). The circle represents the 1s bouton from which recordings were made. Scale bar, 4 m. b, Distribution of observations separated into signals (open circles) and contaminants ( filled circles). Simultaneous records of quantal currents and their respective potentials were plotted, and contaminants were identified as described in Materials and Methods, using Ps ⫽ 0.5 as a cutoff for statistical definition. Inset, Representative mEJCs (top traces) and simultaneously recorded mEJPs (bottom traces). Vertical calibration, 0.4 mV for mEJCs and 3.0 mV for mEJPs; horizontal calibration, 10 msec. c, Angular distribution of the points shown in b. Signals (open bars) reside at shallower angles (66 ⫾ 0.9°; n ⫽ 63) than contaminants ( filled bars; 86.5 ⫾ 0.2°, n ⫽ 57). d, Amplitude–frequency distribution of mEJCs separated into signals (open bars; 0.49 ⫾ 0.04 mV; n ⫽ 63) and contaminants ( filled bars; 0.09 ⫾ 0.0 mV; n ⫽ 57). The distribution of signal amplitudes is skewed toward larger values. Frequency of occurrence of signals is lower after (0.046/sec) than before (0.087/sec) the separation of contaminants. e, Amplitude–frequency distribution of mEJPs belonging to the signal group (mean, 1.20 ⫾ 0.010 mV; n ⫽ 63). f, Plot of the rise times versus mEJC amplitudes for both signals (open circles) and contaminants ( filled circles). Contaminants are smaller in amplitude and possess longer rise times than signals. Inset, The percentage of cumulative frequency distribution of mEJC rise times belonging to signals (solid line; mean 0.89 ⫾ 0.03 msec; n ⫽ 63) and contaminants (dotted line; mean, 1.30 ⫾ 0.07 msec; n ⫽ 57). The K–S test indicates that the two distributions are significantly different; rise times of contaminants are slower than those of signals.
one dimension by calculating the angle (␣) each observation makes with the mEJC axis. Signals reside at shallower angles (Fig. 4c, open bars; 4b, open circles) than contaminants (Fig. 4c, hatched bars; 4b, filled circles). The amplitude–frequency distri-
10272 J. Neurosci., December 1, 2002, 22(23):10267–10276
Figure 5. Quantal size differs with input and phenotype, whereas variance is similar for all cases. a, Summary of the mean signal mEJC amplitude parameters from the five types of bouton that were investigated (1b, n ⫽ 10; 1s n ⫽ 11; dlg 1s, n ⫽ 10; dlg 1s res., n ⫽ 8; lap 1b, n ⫽ 7). A one-way ANOVA test revealed significant differences among the groups ( p ⬍ 0.0001). Pairwise comparisons of signals via a Student’s t test revealed significant differences in mean mEJC amplitudes between 1b and 1s boutons ( p ⫽ 0.020), 1b and dlg 1s boutons ( p ⬍ 0.001), 1s and dlg 1s boutons ( p ⫽ 0.021), 1b and dlg 1s res. ( p ⫽ 0.030), 1b and lap 1b ( p ⬍ 0.001), 1s and lap 1b ( p ⫽ 0.014), 1b and dlg 1s res. ( p ⫽ 0.030), and dlg 1s res. and lap 1b ( p ⫽ 0.0016). There was no significant difference between 1s and dlg 1s res. ( p ⫽ 0.49) and dlg 1s and lap 1b ( p ⫽ 0.73). b, The quantal variance of the mEJCs (CVmEJC). A one-way ANOVA test revealed no significant difference among the five bouton types ( p ⫽ 0.44). For all graphs, error bars indicate SEM.
bution of signal mEJCs (Fig. 4d, open bars) displays larger values than the contaminant mEJC distribution (Fig. 4d, filled bars). By matching mEJCs with their corresponding mEJPs, we also can generate an amplitude–frequency distribution of signal mEJPs (Fig. 4e). The rise times of mEJCs identified as signals (Fig. 4f, solid line, inset) are significantly faster than those of contaminants (Fig. 4f, broken line, inset). Plots of rise time against mEJC amplitude reveal that signals (Fig. 4f, open circles) generally combine larger amplitudes and faster rise times than contaminants (Fig. 4f, filled circles). Thus contaminants can be separated from signals because of their different properties. This method, which reduces the misclassification of contaminants as signals, avoids the variable underestimation of the mean amplitude of signal mEJCs that would result from the inclusion of contaminants. In the remainder of this paper the analysis will be confined to signals.
Accounting for quantal size and variance at 1b and 1s boutons Quantal size has not been compared previously for 1b and 1s boutons. In macropatch recordings of mEJCs from individual identified 1b and 1s boutons, quantal size is 53.1% larger for 1s boutons (0.47 ⫾ 0.06 mV) than for 1b boutons (0.3 ⫾ 0.02 mV) (Fig. 5a). We attempted to account for the factors that generated differences in quantal size between the two bouton types. Specifically, we asked whether quantal size is linked to differences in synapse or vesicle size. In recent studies the immunolabeling of mammalian synapses has shown that the postsynaptic receptor number is related linearly to synaptic area (Nusser et al., 1997; Mackenzie et al., 1999; Oleskevich et al., 1999; Takumi et al., 1999). If this were to hold true at 1b and 1s boutons, the difference in quantal size between the two bouton types could result from differences in the number of postsynaptic receptors available for activation. Alternatively, quantal size differences could result from differences in the amount of transmitter released at 1b and 1s synapses, possibly related to differences in vesicle volume. Synaptic areas were not significantly different between 1b and 1s boutons and therefore could not account for the quantal size
Karunanithi et al. • Vesicle Size Determines Quantal Size
differences if receptor density is similar for both types of synapse. However, in 1s boutons outer and inner vesicle volumes were greater than in 1b boutons (see Tables 1, 2) and therefore potentially could explain the quantal size differences. Another method of testing between the two possibilities was to determine whether variation in quantal amplitude at both bouton types corresponds with variation in synaptic areas or vesicle volume. The coefficient of variation (CV ⫽ SD/mean) for mEJC amplitude (or quantal variance, CVmEJC) has been used in previous studies to identify the locus of variation in quantal amplitude. When quantal variance is greater than the variance attributable to transmitter–receptor interactions (5–15%), postsynaptic receptors likely are unsaturated by a quantum of released transmitter (Faber et al., 1992; Frerking and Wilson, 1996; Liu et al., 1999; McAllister and Stevens, 2000). Quantal variances at 1b and 1s boutons were large, but not significantly different ( p ⫽ 0.31) (Fig. 5b), indicating that both bouton types share a similar source of quantal variability. We attempted to identify this source of variability and tested whether it resulted from variation in synapse size or vesicle volume. The standardized cumulative frequency distributions (Nusser et al., 1997) of mEJCs and synaptic areas (Fig. 6a,b) were compared by using the K–S statistical test. This test revealed a significant difference between the two distributions for 1s boutons, but not for 1b boutons. Thus the variation in mEJC amplitude probably is not determined by variation in synaptic areas at 1s boutons, although it could be at 1b boutons. If the variance arises from a common source, the very similar CVmEJC values of the two bouton types exclude synaptic area variation as the main factor. We next determined whether vesicle size distributions could account for the quantal variances at both bouton types, assuming that all vesicles contain the same concentration of glutamate. We compared the standardized cumulative frequency distributions of mEJC amplitudes and vesicle volumes (Bekkers et al., 1990). For both 1b and 1s synapses the K–S test revealed no significant difference between the two distributions (Fig. 6c,d). The observed CVmEJC values could be attributed to variation in transmitter content from individual synaptic vesicles related to vesicle volume. Thus the larger mean quantal size recorded at 1s boutons (Fig. 5a) correlates with their larger synaptic vesicles, whereas quantal variance matches that of the vesicle size distribution (Figs. 5b, 6c,d).
Variation in vesicle size could account for quantal variance in dlg mutants Records of mEJCs were analyzed for type 1s boutons of dlgm52 mutants. Type 1b boutons in dlg preparations were usually difficult to record from in our specimens, being sandwiched between muscles 6 and 7, so they were not included in this analysis. Mean quantal size of dlg 1s boutons was significantly larger (51.0%) than for CS 1s boutons (Fig. 5a). In dlg 1s boutons the synapses and corrected outer (inner) vesicle volumes were 258.3 and 47.8% (81.5%), respectively, larger than in CS 1s boutons. The increase in quantal size correlated well with the increase in vesicle volume, but not with that of synapse area, indicating that the amount of transmitter released is the more likely determinant of quantal size at dlg 1s boutons. Similar CVmEJC values were found for dlg 1s boutons and CS 1s boutons ( p ⫽ 0.95) (Fig. 5b), indicating a common source of variability. Standardized cumulative frequency histograms of mEJC amplitudes and vesicle volumes were com-
Karunanithi et al. • Vesicle Size Determines Quantal Size
J. Neurosci., December 1, 2002, 22(23):10267–10276 10273
Figure 7. A plot of mean quantal amplitude against the mean outer ( a) and inner ( b) vesicle volumes (calculated from both outer and inner vesicle diameters, respectively) for five bouton types. A linear fit is applied to the data points (uncorrected outer volumes: p ⫽ 0.0031, r ⫽ 0.98, slope ⫽ 0.01 mV/zL, filled circles; corrected outer volumes: p ⫽ 0.0057, r ⫽ 0.96, slope ⫽ 0.008 mV/zL, open circles; uncorrected inner volumes: p ⫽ 0.043, r ⫽ 0.86, slope ⫽ 0.041 mV/zL, filled squares; corrected inner volumes: p ⫽ 0.033, r ⫽ 0.88, slope ⫽ 0.035 mV/zL, open squares). The constant slopes imply that the concentration of transmitter is the same for all vesicles.
Figure 6. Quantal variance matched to variations in synaptic area and vesicle volume (inner and outer). Shown is a comparison of the amplitude distribution of mEJCs with the synaptic areas for 1b and 1s boutons (a, b) and with the distribution of the vesicle volumes for 1b, 1s, dlg 1s, and dlg res. 1s boutons (c–f ). a, b, The standardized distributions of mEJC amplitudes (solid lines) pooled from all experiments (1b, 423 events, 10 experiments; 1s, 484 events, 11 experiments) compared with the standardized distribution of synaptic areas ( gray line) for 1b boutons (a; n ⫽ 129) and 1s boutons (b; n ⫽ 61). The distributions were significantly different (K–S test) for 1s boutons, but not for 1b boutons. c–f, The standardized distributions of mEJC amplitudes (solid lines) pooled from all experiments (1b, 423 events, 10 experiments; 1s, 484 events, 11 experiments; dlg 1s, 376 events, 10 experiments; dlg 1s res., 687 events, 8 experiments) compared with the standardized distribution of outer ( gray lines) and inner (broken lines) vesicle volumes for each bouton type (1b, 198 vesicles; 1s, 254 vesicles; dlg 1s, 247 vesicles; dlg 1s res., 325 vesicles). The mEJC and vesicle volume distributions were not significantly different for any bouton type (K–S test).
pared. At dlg 1s boutons the K–S test revealed no significant difference between the two distributions (Fig. 6e). In dlg rescues (dlg res.) the quantal size was restored to control values (Fig. 5a). The K–S test revealed no significant difference between standardized cumulative frequency plots of quantal amplitude and vesicle volume (Fig. 6f ). Because CVmEJC values for CS Is, dlg 1s, and dlg 1s res. were similar (Fig. 5b), despite large differences in synapse area (Fig. 2g), the common source of variability most likely arises from variability in vesicle volume. Thus the larger vesicles of dlg 1s boutons and their size variation
can account for the larger quantal currents and their observed variation. These results indicate that the dlgm52 mutation most likely increases quantal size via an effect on the size of synaptic vesicles. To ascertain further whether vesicle size is the likely determinant of quantal size, we examined the lap mutant for which the 1b boutons contain vesicles similar in mean uncorrected outer diameter (49 nm) (Zhang et al., 1998) to those of dlg 1s boutons (lap 1b vesicles are ⬃14.7% smaller in uncorrected outer volume than dlg 1s vesicles). Quantal size in lap has been measured by Zhang et al. (1998) by using whole-cell voltage clamp, which does not distinguish the boutons from which mEJCs originate. In the present study we selected 1b boutons to compare their mEJCs with those of dlgm52 1s boutons. Quantal size (Fig. 5a) and variance ( p ⫽ 0.091) (Fig. 5b) were not significantly different for the two bouton types. Again, the similar CVmEJC values indicate that quantal variance is determined predominantly by variation in vesicle volume. Furthermore, if receptor subcomposition or number (Petersen et al., 1997) were different between 1b and 1s bouton types, similar-sized vesicles containing similar amounts of transmitter should produce different quantal sizes in the lap and dlgm52 comparisons; however, this is not the case. Thus quantal size and variance seem to be controlled by presynaptic factors, namely, vesicle size.
General relationship between quantal size and vesicle volume A linear relationship between vesicle volume and quantal amplitude appears when mean values for both measurements are plotted for all of the different genotypes of the present study (Fig. 7). This relationship further supports the hypothesis that quantal amplitude is determined to a large extent by synaptic vesicle volume and transmitter content. If quantal size indirectly represents the glutamate that has been released, the linear relationship in Figure 7 indicates that the concentration of glutamate (mol/ vol) in synaptic vesicles is constant. Because this relationship was established by recording from different inputs and genotypes, it further indicates that glutamate concentration is regulated ho-
10274 J. Neurosci., December 1, 2002, 22(23):10267–10276
meostatically to a constant value, although vesicle size varies among inputs.
DISCUSSION We have presented new evidence for normally occurring differences in quantal size at synapses of two glutamatergic neurons in Drosophila and for genetic regulation of quantal size by the tumor suppressor dlg gene, which alters synaptic morphology (Lahey et al., 1994) and neurotransmission (Budnik et al., 1996). The differences in quantal size correlate well with differences in synaptic vesicular volume and thus with transmitter content. The findings strengthen the case for presynaptic regulation of quantal size and reveal a novel mechanism for normal differentiation of synaptic physiological properties: vesicle size differences among synaptic inputs. The results fit a relatively simple model in which the amount of transmitter released by a vesicle is predicted by its size, with postsynaptic receptors normally not saturated by released transmitter (cf. Liu et al., 1999) and with no requirement for variable release efficiency or fusion pore opening.
Vesicle size and synaptic differentiation The normally occurring size difference between synaptic vesicles in two identified neurons constitutes a new feature of synaptic differentiation. Electron microscopic studies previously have revealed differences in size and shape between GABAergic and glutamatergic boutons in the mammalian CNS (Uchizono, 1965; Ha´mori et al., 1990) and in arthropod excitatory and inhibitory neurons (Uchizono, 1967; Atwood and Tse, 1993), but a vesicle size difference between two glutamatergic neurons innervating the same postsynaptic target cell has not been found previously. In Drosophila the functional outcome is a difference in quantal size; fewer quantal events would be needed to achieve a given level of excitation at 1s boutons, which in fact generate larger EJPs (Kurdyak et al., 1994; Lnenicka and Keshishian, 2000). Vesicle size has been found to respond to the level of synaptic activity in several instances. Inactivity was shown to cause an enlargement of synaptic vesicles in the electroreceptor afferents of gymnotid fish, which can be reversed by stimulation (Maler and Mathieson, 1985), whereas prolonged high-frequency stimulation produces a reduction in vesicle size in lamprey reticulospinal axons (Wickelgren et al., 1985) and in the electric organ of Torpedo (Zimmerman and Whittaker, 1974). By recording motor pattern discharge (fictive locomotion; Cattaert and Birman, 2001) from either 1b or 1s boutons, we found that almost all of the synaptic activity was generated by 1b boutons, which contain the smaller vesicles; very little activity was recorded from 1s boutons containing the larger vesicles (our unpublished observations). Probably 1s boutons participate in less frequent, more vigorous motor responses. Thus our preliminary observations are consistent with those of previous studies: synapses experiencing more electrical activity have smaller synaptic vesicles.
Accounting for quantal variance Synapse area and vesicle volume variations in control and dlg mutant boutons provided an opportunity to test whether quantal variance could be explained by either of these morphological features. Recent results for mammalian central synapses have not favored one alternative over the other consistently (Auger and Marty, 2000). The amplitude distribution of mEJCs correlates well with the third power of vesicle diameter (or vesicle volumes), as reported for hippocampal cultures and slices (Bekkers et al., 1990) and monoamine-secreting cells (Finnegan et al., 1996;
Karunanithi et al. • Vesicle Size Determines Quantal Size
Bruns et al., 2000). In contrast, Frerking et al. (1995) found that mIPSC amplitudes correlate with the sixth power of vesicle diameter distributions at dynapses in cultured amacrine cells; they concluded that variation in mIPSC amplitudes arises from variation in the amount of released transmitter and that the correlation with the sixth power of vesicle diameter relates to the requirement for two transmitter–receptor interactions for channel opening. At present, we are not able to account for the difference in the power dependence of GABAergic mIPSCs (Frerking et al., 1995) and glutamatergic EPSCs (Bekkers et al., 1990; this study). All of these studies support the implication that quantal amplitude variability arises from variation in the amount of glutamate released by a synaptic vesicle. For Drosophila the strong correlation between the distributions of mEJCs and vesicle volumes at all inputs and the linear relationship between quantal size and vesicle volume indicate that the vesicles empty their transmitter content abruptly during exocytosis; partial emptying of vesicles during exocytosis, as suggested at other synaptic types (Choi et al., 2000; Renger et al., 2001), may not contribute to the quantal variability at Drosophila synapses. The large and similar CVmEJC values recorded in all five types of synapse indicate that postsynaptic receptors of these synapses are not saturated. This is consistent with observations in other systems (Silver et al., 1996; McAllister and Stevens, 2000; Ishikawa et al., 2002) and is in accord with the type of model proposed by Bartol et al. (1991) in which receptors close to the point of vesicle exocytosis are activated strongly by released transmitter, whereas those further away are less likely to be activated but could be recruited if more transmitter is released by a vesicle. The alternative explanation, variation in number of receptors at individual synapses with saturation or near-saturation of available receptors, is less well supported by our data, although it has been proposed in studies of mammalian synapses (Tang et al., 1994; Harris and Sultan, 1995; Nusser et al., 1997; Lim et al., 1999). If postsynaptic receptors were saturated, quantal variance would be small, arising from stochastic receptor–transmitter interactions (Frerking and Wilson, 1996). The studies of Liu et al. (1999) and McAllister and Stevens (2000) conducted on individual, cultured glutamatergic hippocampal boutons (which display large quantal variations) indicate that only a fraction of the quantal variance (10%) arises from stochastic transmitter–receptor interactions, but the studies fail to account for the factors producing the bulk of the quantal variance. Our work on naturally formed glutamatergic synapses indicates that most of the quantal variance arises from variation in vesicular glutamate content. Our data do not suggest roles for “off-center” release (Uteshev and Pennefather, 1996) or structural variability of the cleft (Stiles et al., 2001) as significant contribution factors.
Glutamate concentration of synaptic vesicles For quantal amplitude to be proportional to vesicle volume (Fig. 7), the concentration of glutamate would have to be equal in all vesicles. Studies in other systems support this proposition; for example, monoamine-secreting vesicles of PC12 cells (Colliver et al., 2000) and 5-HT-containing vesicles of cultured leech Retzius cells (Bruns et al., 2000) contain uniform transmitter concentrations. However, in developing cholinergic neuromuscular junctions of Xenopus, the overexpression of a vesicular acetylcholine transporter increased quantal size (Song et al., 1997); whether this effect was accompanied by changes in vesicle size is not known. The present result indicates that constancy of vesicular transmitter concentration holds for normally formed glutamater-
Karunanithi et al. • Vesicle Size Determines Quantal Size
gic synapses. Probably glutamate concentration is regulated homeostatically in the same way at all inputs that have been examined in the present study. The genetic interventions (dlg and lap mutants) affect vesicle size, but probably not intravesicular glutamate concentration. The vesicular glutamate transporter may load vesicles to their maximal capacity, in which case larger vesicles would contain more glutamate (cf. Sulzer and Edwards, 2000), in accordance with a “set point” rather than a “steadystate” model of vesicle filling (Williams, 1997).
Genetic regulation of vesicle size Occurrence of larger synaptic vesicles in dlgm52 indicates regulation of vesicle size by the dlg gene, perhaps via a mechanism different from that involving lap and stoned genes, which affect vesicle retrieval and recycling steps (Zhang et al., 1999). DLG is known to be expressed both presynaptically and postsynaptically in Drosophila synapses and has effects on synaptic structure (Lahey et al., 1994; Budnik et al., 1996; Guan et al., 1996; Thomas et al., 1997). The present data indicate that DLG affects vesicle size, but it has not been found in association with clathrin coats or synaptic vesicle membranes, unlike LAP and Stoned proteins. Nevertheless, other tumor suppressor genes are shown to affect endocytosis in vivo (Krishnan et al., 2001). The mammalian homolog PSD-95, detected presynaptically as well as postsynaptically (Aoki et al., 2001), transiently associates with perinuclear vesicles during sorting in hippocampal neurons (El-Husseini et al., 2000). In Drosophila epithelial cells the dlg, lgl, and scribble tumor suppresser genes have been implicated in targeting of transport vesicles to cellular compartments and plasma membranes to maintain cell polarity (Bilder et al., 2000). Furthermore, the lgl gene product was reported to coat transport vesicles (Peifer, 2000). Thus products of the tumor suppressor genes are associated with vesicles and could influence their size.
Physiological implications Our work shows that quantal size differences are correlated with vesicle size among synaptic inputs. We postulate that larger vesicles release more transmitter and thereby provide greater weighting per stimulus in synaptic excitation of the postsynaptic cell. The shared source of quantal variation is postulated to be variation in transmitter content among vesicles as determined by vesicle volume. It is also possible that vesicle size may influence release probability, as indicated by theoretical studies (Glavinovic and Rabie, 2001). Probability of transmitter release is higher than normal in dlg mutants (Budnik et al., 1996) and higher at 1s synapses than at 1b synapses (Atwood et al., 1997); this order of release probabilities corresponds with the order of vesicle sizes.
REFERENCES Aoki C, Miko I, Oviedo H, Mikeladze-Dvali T, Alexandre L, Sweeney N, Bredt DS (2001) Electron microscopic immunocytochemical detection of PSD-95, PSD-93, SAP-102, and SAP-97 at postsynaptic, presynaptic, and nonsynaptic sites of adult and neonatal rat visual cortex. Synapse 40:239 –257. Atwood HL, Tse FW (1993) Physiological aspects of presynaptic inhibition. Adv Neural Sci 1:19 – 65. Atwood HL, Govind CK, Wu C-F (1993) Differential ultrastructure of synaptic terminals on ventral longitudinal abdominal muscles in Drosophila larvae. J Neurobiol 24:1008 –1024. Atwood HL, Karunanithi S, Georgiou J, Charlton MP (1997) Strength of synaptic transmission at neuromuscular junctions of crustaceans and insects in relation to calcium entry. Invert Neurosci 3:81– 87. Atwood HL, Karunanithi S, Wong K, Marin L, Stewart BA (1999) Determinants of quantal size at Drosophila synapses: bouton type, vesicle size, and the size of the postsynaptic receptor patch. Soc Neurosci Abstr 25:187.11.
J. Neurosci., December 1, 2002, 22(23):10267–10276 10275
Auger C, Marty A (2000) Quantal currents at single-site central synapses. J Physiol (Lond) 526[Pt 1]:3–11. Bartol TMJ, Land BR, Salpeter EE, Salpeter MM (1991) Monte Carlo simulation of miniature endplate current generation in the vertebrate neuromuscular junction. Biophys J 59:1290 –1307. Bekkers JM, Richerson GB, Stevens CF (1990) Origin of variability in quantal size in cultured hippocampal neurons and hippocampal slices. Proc Natl Acad Sci USA 87:5359 –5362. Bennett MR, Robinson J, Phipps MC, Karunanithi S, Lin YQ, Cottee L (1996) Quantal components of spontaneous excitatory junction potentials at visualized varicosities. J Auton Nerv Syst 56:161–174. Bilder D, Li M, Perrimon N (2000) Cooperative regulation of cell polarity and growth by Drosophila tumor suppressors. Science 289: 113–116. Bruns D, Riedel D, Klingauf J, Jahn R (2000) Quantal release of serotonin. Neuron 28:205–220. Budnik V, Koh Y-H, Guan B, Hartman B, Hough C, Woods D, Gorczyca M (1996) Regulation of synapse structure and function by the Drosophila tumor suppressor gene dlg. Neuron 17:627– 640. Cattaert D, Birman S (2001) Blockade of the central generator of locomotor rhythm by noncompetitive NMDA receptor antagonists in Drosophila larvae. J Neurobiol 48:58 –73. Choi S, Klingauf J, Tsien RW (2000) Postfusional regulation of cleft glutamate concentration during LTP at “silent synapses.” Nat Neurosci 3:330. Colliver TL, Pyott SJ, Achalabun M, Ewing AG (2000) VMATmediated changes in quantal size and vesicular volume. J Neurosci 20:5276 –5282. Cooper RL, Marin L, Atwood HL (1995) Synaptic differentiation of a single motor neuron: conjoint definition of transmitter release, presynaptic calcium signals, and ultrastructure. J Neurosci 15:4209 – 4222. del Castillo J, Katz B (1956) Localization of active spots within the neuromuscular junction of the frog. J Physiol (Lond) 132:630 – 649. Elhamdani A, Palfrey HC, Artalejo CR (2001) Quantal size is dependent on stimulation frequency and calcium entry in calf chromaffin cells. Neuron 31:819 – 830. El-Husseini AE, Craven SE, Chetkovich DM, Firestein BL, Schnell E, Aoki C, Bredt DS (2000) Dual palmitoylation of PSD-95 mediates its vesiculotubular sorting, postsynaptic targeting, and ion channel clustering. J Cell Biol 148:159 –171. Engel D, Pahner I, Schulze K, Frahm C, Jarry H, Ahnert-Hilger G, Draguhn A (2001) Plasticity of rat central inhibitory synapses through GABA metabolism. J Physiol (Lond) 535[Pt 2]:473– 482. Faber DS, Young WS, Legendre P, Korn H (1992) Intrinsic quantal variability due to stochastic properties of receptor–transmitter interactions. Science 258:1494 –1498. Finnegan JM, Pihel K, Cahill PS, Huang L, Zerby SE, Ewing AG, Kennedy RT, Wightman RM (1996) Vesicular quantal size measured by amperometry at chromaffin, mast, pheochromocytoma, and pancreatic -cells. J Neurochem 66:1914 –1923. Fox GO (1988) A morphometric analysis of synaptic vesicle distributions. Brain Res 475:103–117. Frerking M, Wilson M (1996) Saturation of postsynaptic receptors at central synapses. Curr Opin Neurobiol 6:395– 403. Frerking M, Borges S, Wilson M (1995) Variation in GABA mini amplitude is the consequence of variation in transmitter concentration. Neuron 327:885– 895. Froesch D (1973) A simple method to estimate the true diameter of synaptic vesicles. J Microsc 98:85– 89. Glavinovic MI, Rabie HR (2001) Monte Carlo evaluation of quantal analysis in the light of Ca 2⫹ dynamics and the geometry of secretion. Pflu ¨gers Arch 443:132–145. Guan B, Hartmann B, Kho YH, Gorczyca M, Budnik V (1996) The Drosophila tumor suppressor gene, dig, is involved in structural plasticity at a glutamatergic synapse. Curr Biol 6:695–706. Ha´mori J, Taka´cs J, Petrusz P (1990) Immunogold electron microscopic demonstration of glutamate and GABA in normal and deafferented cerebellar cortex: correlation between transmitter content and synaptic vesicle size. J Histochem Cytochem 38:1767–1777. Hanse E, Gustafsson B (2001) Quantal variability at glutamatergic synapses in area CA1 of the rat neonatal hippocampus. J Physiol (Lond) 531[Pt 2]:467– 480. Harris KM, Sultan P (1995) Variation in the number, location, and size of synaptic vesicles provides an anatomical basis for the nonuniform probability of release at hippocampal CA1 synapses. Neuropharmacology 34:1387–1395. Hoang B, Chiba A (2001) Single-cell analysis of Drosophila larval neuromuscular synapses. Dev Biol 229:55–70. Ishikawa T, Sahara Y, Takahashi T (2002) A single packet of transmitter does not saturate postsynaptic glutamate receptors. Neuron 34:613– 621. Johansen J, Halpern ME, Johansen KM, Keshishian H (1989) Stereotypic morphology of glutamatergic synapses on identified muscle cells of Drosophila larvae. J Neurosci 9:710 –725. Karunanithi S, Phipps MC, Robinson J, Bennett MR (1995) Statistics of
10276 J. Neurosci., December 1, 2002, 22(23):10267–10276
quantal secretion during long trains of sympathetic nerve impulses in mouse vas deferens. J Physiol (Lond) 489[Pt 1]:171–181. Karunanithi S, Barclay JW, Robertson RM, Brown IR, Atwood HL (1999) Neuroprotection at Drosophila synapses conferred by prior heat shock. J Neurosci 19:4360 – 4369. Keshishian H, Chiba A, Chang TN, Halfon MS, Harkins EW, Jarecki J, Wang L, Anderson M, Cash S, Halpern ME, Johansen J (1993) Cellular mechanisms governing synaptic development in Drosophila melanogaster. J Neurobiol 24:757–787. Koh YH, Gramates LS, Budnik V (2000) Drosophila larval neuromuscular junction: molecular components and mechanisms underlying synaptic plasticity. Microsc Res Tech 49:14 –25. Krishnan KS, Rikhy R, Rao S, Shivalkar M, Mosko M, Narayanan R, Etter P, Estes PS, Ramaswami M (2001) Nucleoside diphosphate kinase, a source of GTP, is required for dynamin-dependent synaptic vesicle recycling. Neuron 30:197–210. Kurdyak P, Atwood HL, Stewart BA, Wu C-F (1994) Differential physiology and morphology of motor axons to ventral longitudinal muscles in larval Drosophila. J Comp Neurol 350:463– 472. Lahey T, Gorczyca M, Jia X-X, Budnik V (1994) The Drosophila tumor suppressor gene dlg is required for normal synaptic bouton structure. Neuron 13:823– 835. Lim R, Alvarez FJ, Walmsley B (1999) Quantal size is correlated with receptor cluster area at glycinergic synapses in the rat brainstem. J Physiol (Lond) 516[Pt 2]:505–512. Liu GS, Choi SW, Tsien RW (1999) Variability of neurotransmitter concentration and nonsaturation of postsynaptic AMPA receptors at synapses in hippocampal cultures and slices. Neuron 22:395– 409. Lnenicka GA, Keshishian H (2000) Identified motor terminals in Drosophila larvae show distinct differences in morphology and physiology. J Neurobiol 43:186 –197. Mackenzie PJ, Kenner GS, Prange O, Shayan H, Umemiya M, Murphy TH (1999) Ultrastructure correlates of quantal synaptic function at single CNS synapses. J Neurosci 19:RC13(1–7). Maler L, Mathieson WB (1985) The effect of nerve activity on the distribution of synaptic vesicles. Cell Mol Neurobiol 5373. McAllister AK, Stevens CF (2000) Nonsaturation of AMPA and NMDA receptors at hippocampal synapses. Proc Natl Acad Sci USA 97:6173– 6178. Msghina M, Govind CK, Atwood HL (1998) Synaptic structure and transmitter release in crustacean phasic and tonic motor neurons. J Neurosci 18:1374 –1382. Murthy VN, Sejnowski TJ, Stevens CF (1997) Heterogeneous release properties of visualized individual hippocampal synapses. Neuron 18:599 – 612. Nusser Z, Cull-Candy S, Farrant M (1997) Differences in synaptic GABAA receptor number underlie variation in GABA mini amplitude. Neuron 19:697–709. Oleskevich S, Alvarez FJ, Walmsley B (1999) Glycinergic miniature synaptic currents and receptor cluster sizes differ between spinal cord interneurons. J Neurophysiol 82:312–319. Parsons TD, Coorssen JR, Horstmann H, Almers W (1995) Docked granules, the exocytic burst, and the need for ATP hydrolysis in endocrine cells. Neuron 15:1085–1096. Peifer M (2000) Travel bulletin—traffic jams cause tumors. Science 289:67– 69. Petersen SA, Fetter RD, Noordermeer JN, Goodman CS, DiAntonio A (1997) Genetic analysis of glutamate receptors in Drosophila reveals a retrograde signal regulating presynaptic transmitter release. Neuron 19:1237–1248. Redman S (1990) Quantal analysis of synaptic potentials in neurons of the central nervous system. Physiol Rev 70:165–198. Renger JJ, Egles C, Liu G (2001) A developmental switch in neurotransmitter flux enhances synaptic efficacy by affecting AMPA receptor activation. Neuron 29:469 – 484.
Karunanithi et al. • Vesicle Size Determines Quantal Size
Schikorski T, Stevens CF (1997) Quantitative ultrastructural analysis of hippocampal excitatory synapses. J Neurosci 17:5858 –5867. Silver RA, Cull-Candy SG, Takahashi T (1996) Non-NMDA glutamate receptor occupancy and open probability at a rat cerebellar synapse with single and multiple release sites. J Physiol (Lond) 494:231–250. Song HJ, Ming GL, Fon E, Bellocchio E, Edwards RH, Poo MM (1997) Expression of a putative vesicular acetylcholine transporter facilitates quantal transmitter packaging. Neuron 18:815– 826. Staple JK, Osen-Sand A, Benfenati F, Pich EM, Catsicas S (1997) Molecular and functional diversity at synapses of individual neurons in vitro. Eur J Neurosci 9:721–731. Stewart BA, Atwood HL, Renger JJ, Wang J, Wu C-F (1994) Improved stability of Drosophila larval neuromuscular preparations in haemolymph-like physiological solutions. J Comp Physiol [A] 175:179 –191. Stewart BA, Schuster CM, Goodman CS, Atwood HL (1996) Homeostasis of synaptic transmission in Drosophila with genetically altered nerve terminal morphology. J Neurosci 16:3877–3886. Stiles JR, Bartol TM, Salpeter MM, Salpeter EE, Sejnowski TJ (2001) Synaptic variability: new insights from reconstructions and Monte Carlo simulations with MCell. In: Synapses (Cowan WM, Su ¨dhof TC, Stevens CF, eds), pp 681–731. Baltimore: Johns Hopkins UP. Sulzer D, Edwards R (2000) Vesicles: equal in neurotransmitter concentration but not in volume. Neuron 28:5–7. Takumi Y, Ramı´rez-Leo ´n V, Laake P, Rinvik E, Ottersen OP (1999) Different modes of expression of AMPA and NMDA receptors in hippocampal synapses. Nat Neurosci 2:618 – 624. Tang C-M, Margulis M, Shi Q-Y, Fielding A (1994) Saturation of postsynaptic glutamate receptors after quantal release of transmitter. Neuron 13:1385–1393. Thomas U, Kim E, Kuhlendahl S, Koh YH, Gundelfinger ED, Sheng M, Garner CC, Budnik V (1997) Synaptic clustering of the cell adhesion molecule fasciclin II by discs-large and its role in the regulation of presynaptic structure. Neuron 19:787–799. Thomson AM (2000) Molecular frequency filters at central synapses. Prog Neurobiol 62:159 –196. Uchizono K (1965) Characteristics of excitatory and inhibitory synapses in the central nervous system of the cat. Nature 207:642. Uchizono K (1967) Inhibitory synapses on the stretch receptor neurone of the crayfish. Nature 214:833– 834. Uteshev VV, Pennefather PS (1996) A mathematical description of miniature postsynaptic current generation at central nervous system synapses. Biophys J 71:1256 –1266. Walmsley B, Alvarez FJ, Fyffe REW (1998) Diversity of structure and function at mammalian central synapses. Trends Neurosci 21:81– 88. Wickelgren WO, Leonard JP, Grimes MJ, Clark RD (1985) Ultrastructural correlates of transmitter release in presynaptic areas of lamprey reticulospinal axons. J Neurosci 5:1188 –1201. Williams J (1997) How does a vesicle know it is full? Neuron 18:683– 686. Wong K, Karunanithi S, Atwood HL (1999) Quantal unit populations at the Drosophila larval neuromuscular junction. J Neurophysiol 82:1497–1511. Young SJ, Royer SM, Groves PM, Kinnamon JC (1987) Threedimensional reconstructions from serial micrographs using the IBM PC. J Electron Microsc Tech 6:207–217. Zhang B, Koh YH, Beckstead RB, Budnik V, Ganetzky B, Bellen HJ (1998) Synaptic vesicle size and number are regulated by a clathrin adaptor protein required for endocytosis. Neuron 21:1465–1475. Zhang B, Ganetzky B, Bellen HJ, Murthy VN (1999) Tailoring uniform coats for synaptic vesicles during endocytosis. Neuron 23:419 – 422. Z immerman H, Whittaker V P (1974) Effect of electrical stimulation on the yield and composition of synaptic vesicles from the cholinergic synapses of the electric organ of Torpedo: a combined biochemical, electrophysiological, and morphological study. J Neurochem 22:435– 450.