Behavior Research Methods, Instruments, & Computers 2002, 34 (1), 6-18
Quantification of brain lesions using interactive automated software MILAN MAKALE H. M. Jackson Foundation, Bethesda, Maryland and National Institutes of Health, Bethesda, Maryland JEFFREY SOLOMON Sensor Systems Incorporated, Sterling, Virginia and National Institutes of Health, Bethesda, Maryland and NICHOLAS J. PATRONAS, ADRIAN DANEK, JOHN A. BUTMAN, and JORDAN GRAFMAN National Institutes of Health, Bethesda, Maryland We developed an interactive program, Analysis of Brain Lesions (ABLe) so that researchers studying the effects of brain lesions on cognition could have a user-friendly tool that could quantitatively characterize such lesions. The program was prepared in Tcl/Tk and will run on any UNIX or PC LINUX platform with the MEDx medical imaging software package. The ABLe is almost completely automated and determines the brain lesion size as well as which cytoarchitectonic brain regions (Brodmann areas) are contained within the boundaries of the lesion. Lesion data from multiple subjects can be grouped together and the degree of lesion overlap displayed. All images are analyzed and displayed within standard Talairachcoordinate space, and the precision of the match between the ABLe Brodmann area graphics and the subject/patient brain is easily confirmed. The program is the first easy-to-use software that contains these specific features and is available for interested researchers with a background in lesion analysis.
Currently, in the majority of neurologicaland neuropsychological research laboratories, an essential step in the analysis and grouping of patients that exhibit cognitive deficits due to focal brain lesions is to assess which cytoarchitectonic regions are included within the boundaries of the lesion. This is accomplishedby using magneticresonance imaging (MRI) and computed tomography (CT) scans that are viewed in film format using lightboxes or computer screens. The practitionermakes educated deductions about the areas involved or uses laborious tracing and other methods to define the lesion. This is time-consuming, cumbersome, fatiguing, and can impose considerable variation between measurements from patient to patient within and across research laboratories. An alternativeto this manual procedure would be to process the MRI and CT volumes digitally and to use automated software to standardize them according to a coordinate system, evaluate them quantitatively, and assign them to categories according to cytoarchitectonic areas contained within the boundaries of the lesion. There is great
interest among researchers for such software, but despite the existence of a variety of sophisticated general brain atlas programs and algorithms, to our knowledge there is no software available that performs the specific function of characterizing the brain areas affected by a lesion. Our goals were to create automated software that fulfills this particular function for MRI and for CT, to make it as easy as possible to use, and to render it readily available to interested researchers with experience in neuroanatomy and lesion analysis. The Analysis of Brain Lesions (ABLe) program is written in Tcl/Tk and is designed to operate within the MEDx medical imaging software environment (Sensor Systems, Inc., Sterling, VA) on various UNIX workstations, including Sun Solaris, Silicon Graphics, Hewlett-Packard, and DEC. MEDx and ABLe can also operate on Linux PC computers. DESIGN CONSIDERATIONS FOR BRAIN ATLAS SOFTWARE Subject Brain and Reference Atlas Variability The developmentof any brain atlas program is a major undertaking that includes technical challenges, and this may in part be the reason why the development of specific software like the ABLe has been lacking. The major difficulties are that human brain structure is complex and variable across subjects, and that the reference atlases that have
The authors thank Paolo Nichelli and Khalaf Bushara for helpful discussions relating to the preparation of this manuscript. Correspondence should be addressed to J. Grafman, Cognitive Neuroscience Section, National Institute for Neurological Disorders and Stroke, National Institutes of Health, Building 10, Room 5C205, MSC 1440, Bethesda, MD 20892-1440 (e-mail:
[email protected]).
6
QUANTIFICATION OF BRAIN LESIONS been developed over the past 130 years all differ in terms of scale and resolution and are based on different single brains taken as representative. Development of ABLe involved addressing these common technical issues. For ABLe, reference atlases and a coordinate system were selected in order to be able to compare different brains, and these had to be digitized and standardized. The choices of major reference systems that are in use today include Brodmann’s (1909) map of cytoarchitectonic regions in which cell type and distribution define various areas on the surface of the cortex. These regions were later associated with characteristic functions. Brodmann’s map has since been widely used even if its empirical basis, due to Brodmann’s premature death, was never fully published. Subsequent work on the anatomic parcellation of the cerebral cortex by authors such as von Economo and Koskinas, Sarkisov, and Braak have not superseded the Brodmann map (Braak, 1980). All these workers were faced with the limitation that they had to rely on histologicalmethods by which to distinguish cell types and identify cytoarchitectonic boundaries subjectively. Only recently has there been a systematic, yet still not completed,effort, which applies a variety of modern quantitativemethods such as quantitative cytoarchitectonics, immunohistochemistry, and statistical analysis of brain images, to remove the present uncertainties regarding cytoarchitectonic boundaries (Roland & Zilles, 199Britton et al., 19908). Other reference systems include the landmark works by Talairach and Szikla (1967) and Talairach and Tournoux (1988), in which a standardization scheme was developed to adapt human brains to a common coordinate system. Mazziotta’s visible man project (Mazziotta, Toga, Evans, Fox, & Lancaster, 1995) incorporates histological and cryosection data into a single, probabilisticatlas. Brainvox (Frank, Damasio, & Grabowski, 1997) is a powerful visualization and analysis package for neuroanatomical imaging, but does not yet have the facility to directly determine the Brodmann areas occupied by a lesion. A recent collaborative effort between Johns Hopkins University and the National University of Singapore has resulted in a comprehensive multimodal brain atlas that is a comprehensive teaching and reference tool (Nowinski et al., 1997). This work combines digitized and labeled general atlases with cortical and sulcal atlases, but unfortunately Brodmann areas cannot be precisely warped to match slices from a subject’s brain, and the intersection of a lesion with Brodmann areas cannot be done automaticallywithin a standard coordinate system. The Surefit/CARET cortical flattening software can reconstruct Brodmann areas via flattened surface based atlases (Joshi et al., 1999), but cortical extraction and flattening is a relatively lengthy, complex procedure, and the system does not automatically determine the Brodmann area intersections for an entire lesion. The freeware mri3dx (http://www.liv.ac.uk/ mariarc/mri3dX/mri3dX_shading.html) is very versatile and useful, and one of its functions allows users to view lesions or functional data, along with Brodmann areas, matched to the popular MNI template brain. However, mri3dx does not automatically determine Brodmann area
7
involvementfrom a lesion traced on multiple slices. Many of the more recent atlases described earlier are either not generally available, and therefore cannot be tested and used by interested researchers, or are nontrivial to use and do not contain all the options that a program for lesion analysis should have. The latter is at least in part because most of these atlases/programs are not specifically designed and optimized for automated characterization of lesions in terms of Brodmann areas, but are intendedfor some other purpose, such as cortical flattening or rendering of functional magnetic resonance imaging (fMRI) data. The Damasios (Damasio & Damasio, 1989) published a series of templates based on sections taken at a range of angles through fixed human brains (hereafter, Damasio templates). Drawings of these sections were labeled with markers for cytoarchitectonic regions after interpolation from Brodmann’s map. These templates are a widely accepted standard because they provide cytoarchitectonic information for slices. In contrast, Brodmann’s original map only shows cytoarchitectonic boundaries on an idealized cerebral surface. Given the lack of an ideal program for lesion analysis, we developed our own program and report on its utility and reliability below. METHOD Reference Atlases and Standardization The Damasio templates were selected as a reference for ABLe for the following two reasons. First, the Damasio slice templates denote Brodmann areas, and although the locations of Brodmann areas in these templates are approximate, they relate cortical surface areas with certain cognitive, sensory, and motor functions and thus represent a useful means by which to group brain lesions. This grouping can guide the assessment of the relationship between observed cognitive deficits and the position of the lesion. Second, the Damasio templates are in wide use in neuropsychology and neurology, and therefore any atlas that is based on a brain that is digitized, resliced, and labeled according to these templates would be readily accepted. Damasio and Damasio (1989) sliced human brains at various angles, and the brains that they sectioned in the transverse plane typically yielded 11 slices that were 10-mm thick. The slices were placed on a flat surface with their superior aspect facing up. A series of 11 templates was drawn from the slices from each brain, and the Damasios labeled the outer margins of these templates in terms of Brodmann’s cytoarchitectonic areas. The particular Damasio templates used as a reference for the ABLe were derived from brain slices taken at a 15º cranial angulation to the inferior orbitomeatal line (IOL). These templates were selected because they showed important structures clearly and the slice angle was relatively well defined. Furthermore, most MRI scans of patients’ brains are typically acquired at the 15º angle. A significant disadvantage in just using the Damasio templates to define a lesion is that they do not conform to any standard coordinate system. Thus, any new brain studied by an investigator would not correspond in terms of
8
MAKALE ET AL.
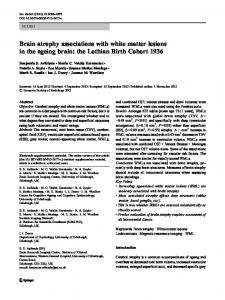
Figure 1. The ABLe main menu. To initiate any particular module, the user simply clicks on the labeled tabs along the top of the graphical interface or clicks “next” within each module.
shape and size to the Damasio templates. In addition, there would also be large between-subjects variation in brain size and shape. Therefore two issues needed to be addressed. First, the digitized brain selected as the reference brain for the ABLe had to be normalized to a coordinate system in addition to being labeled according to the Damasio templates. Second, related to subject-specific differences in the shape of the brain, subjects’ brains had to be processed to conform in shape and size to the ABLe reference brain. To address the coordinate system issue, the system of Talairach and Tournoux (1988) was selected, since this is the most widely used coordinate system in neurology and neuropsychology research. The method of Talairach and Tournoux has deficiencies in terms of matching sulcal shape and size between subjects, but at the present time there are no complete, superior alternatives that we could readily implement. Therefore, two structurallynormal brains were selected, one obtained from the MRI of a 27-year-old male, and the other from the CT of another27-year-old male, and interactively conformed to Talairach dimensions in MEDx using an affine 12-parameter transformation. The MRI reference volume was acquired using a T1-weighted 3-D MRI on a GE 1.5 Tesla scanner. The scanned volume had 124 contiguousslices of 1.5-mm thickness, the slice dimensionswere 256 3 256, and the field of view was 24 cm. The CT reference volume was obtained with a GE LightSpeed CT scanner operating in helical acquisition mode, and the data were reconstructed with a 3-mm overlapping slice thickness and a 1-mm interval. The data were reconstructed to yield 138 slices 1-mm thick. Both the MRI and the CT volumes had the skull and the scalp components removed using interactive modules in MEDx, and were registered to true Talairach coordinates in MEDx. The International Consortium of Brain Mapping (ICBM) tem-
plate used by functional neuroimagers, which is a close approximation of Talairach dimensions, was not used. For purposes of preparing computer graphics of Brodmann areas, the MRI brain volume was digitally resliced at various angles to determine which slice angle would yield axial sections that were anatomically and morphologically closest to the Damasio templates. The best slice angle was determined to be 17º relative to the IOL, and 11 slices that as closely as possible matched the Damasio transverse brain templates were selected from the total brain volume by a neuroradiologist(N.J.P.). The distance between the selected slices was 7–10 mm. The partitioning of the ABLe MRI and CT reference brain volumes into slices of 1-mm thickness improved the selection of 11 reference brain slices to match the 11 Damasio brain slices. After the highresolution MRI brain volume was transformed to Talairach dimensions, resliced, and the 11 slices were selected, each slice of the 11 slices was interactively labeled with Brodmann areas by referring to Damasio templates that were derived from brain slices taken at a 15º cranial angulation. Reference was also made to Damasio’s (1995) computerized brain images and to Duvernoy (1991) in order to confirm the shape, position, and identity of the brain sulci, since these were used as landmarks. The graphics preparation was performed by a neuroradiologist (N.J.P.). The final version of the labeled Brodmann areas was saved as a separate graphics file to be utilized by ABLe for both MRI and CT subject brain volumes normalized to Talairach dimensions. For the second issue, that of normalizing subject brains to the reference brain in Talairach dimensions, several options existed. There are several registration algorithms that can be used to conform one brain to another; these include 3-, 6-, and 9-order linear transformations, 12-order linear affine transformations, nonlinear transformations,
QUANTIFICATION OF BRAIN LESIONS and model-driven higher order deformations (Christensen, Rabbitt, & Miller, 1996; Collins, Peters, & Evans, 1994; Davatzikos, 1996; Thompson & Toga, 1996). The 3and 6-parameter linear transformations provide comparatively crude matching, and some of the software available in this general category requires the user to identify certain neuroanatomical landmarks. ABLe was intended to be as accurate and automated as possible, so it was necessary to implement higher order brain warping software that does not require user interaction. On the other hand, some of the model-driven higher order deformation packages could overwarp brains that have significant tissue loss due to trauma or surgery, resulting in the apparent filling in of areas missing tissue. Moreover, it has also been
9
suggested that given the fact that functional areas do not respect the same sulcal boundaries between individuals, that precise sulcal and gyral matching may not even be desirable (Ashburner & Friston, 1999). Therefore, a relatively conservative registration algorithm is the primary approach within ABLe, and this consists of a 12-parameter affine linear transformation using the AIR (automated image registration) software embedded within MEDx that can be accessed by the ABLe program (Woods, Cherry, & Mazziotta, 1992). The affine transformation allows for translation, rotation, scaling, and shearing. ABLe provides the user with the registration accuracy when the registration is complete, and if a superior registration is desired, the user may attempt to repeat the registration using
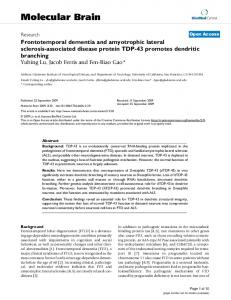
Figure 2. Lightbox display of patient brain slices. Note that the user has outlined areas of tissue loss.
10
MAKALE ET AL.
a nonlinear algorithm that is part of AIR and that estimates 30 different parameters. The user also has the option of including or not including the lesion voxels in the registration, since not including the lesion may in some cases improve registration accuracy (Brett, Leff, Rorden, & Ashburner, 2001). ABLe registers the subject’s brain to the MRI or CT reference brain, which is at 0º to the IOL, and then the registered subject brain is resliced at a 17º cranial angle to the IOL to match ABLe’s Brodmann area graphics. It should be noted that a copy of the MRI reference brain was resliced at 17º only during ABLe development, for the purpose of drawing the Brodmann area graphics. The ABLe brain was sliced at 17º instead of 15º to achieve the closest possible correspondence between the Damasio slices and the reference brain slices. The matching was evaluated visually by inspecting and comparing sulcal patterns and positions. The reference brain and the Damasio templates were found to not be identical at 15º, most likely because the Damasio brain is fixed material, while the ABLe brain is the MRI of a living brain supported by CSF. Interuser Agreement Two experienced clinicians, one a neuroradiologist (J.B.) and the other a neurologist with special expertise in neuroanatomy (A.D.), used ABLe to evaluate the CT and MRI volumes for 16 patients with a variety of lesions. This was a non-uniform group of patients that had lesions stemming from a variety of causes, including tumor excavation, stroke, trauma, and penetrating head injury, and the scans were either coronal or axial. Ten of the volumes
were MR scans and 10 were CT scans. Originally, 10 lesion volumes were obtained courtesy of Mathew Brett (MRC Cognition and Brain Sciences Unit, Cambridge, U.K.), and 10 were obtained from patients tested in the Cognitive Neurosciences Section at the National Institutes of Health. Four of the brain volumes were not included in the analysis, because in the opinion of the two clinicians conducting the analysis, the volumes represented brains in a physical state that precluded assessment for the Brodmann areas involved with a lesion. The two practitionersevaluated the brain volumes independently, using a manual method and using ABLe. For the manual approach, each clinician viewed the patients’ MR or CT scans in lightbox format on a computer screen while referring to the Damasio templates, and tabulated which Brodmann areas were involved with the lesion. For the ABLe evaluation, each clinician traced the boundary of each lesion interactively on the computer screen, and ABLe determined lesion size and which Brodmann areas were involved. The results from both methods were tabulated by two other individuals(J.S. and M.M.), who recorded the Brodmann areas listed by each clinician and whether there was agreement or disagreement—that is, whether the area was identified by only one user or by both. The percent agreement and the kappa statistic (k = Po - Pc /100 - Pc where Po = observed agreement and Pc = agreement due to chance alone) were determined for manual versus manual, ABLe versus ABLe, and manual versus ABLe for the first clinician, and manual versus ABLe for the second clinician. During the course of this study it was noted that, depending on exactly how the user traced the lesion, sometimes nonin-
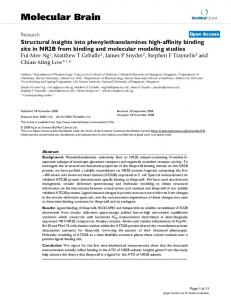
Figure 3. The registration module. The user may select MRI or CT registration, and may include or not include the lesion, and may select linear or higher order nonlinear warping.
QUANTIFICATION OF BRAIN LESIONS
11
FOLDER: Untitled –– VOLUME: FinalExtractedBinlmg Folder
Page Image Display Graphic
Help
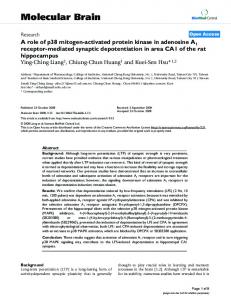
Figure 4. The map of Brodmann areas appears while the ABLe is determining which Brodmann areas are intersected by the lesion. In this figure the different Brodmann’s areas are shaded differently, but the ABLe displays the Brodmann graphics in color on the computer screen. The lesion appears as a solid white area.
volved Brodmann areas were reported as having a small percentage of involvement, usually less than 2%. In the opinion of the clinicians, this error was due to slight variations in manual tracing of the lesion. A very useful feature of ABLe is that it provides the percentage of each Brodmann area that is purported to be involved with the lesion, which allows the user to decide whether the identified Brodmann areas are involved to a significant extent or not. For the purposes of the manual versus ABLe comparisons, those brain volumes that were known to have only unilateral involvementwere compared using ABLe results from the involved hemisphere only. Tracing errors from the noninvolved side were few. THE ABLe MAIN MENU Preparing Subject Brain Volume, Normalization, and Lesion Analysis The ABLe main menu is depictedin Figure 1. Prior to initiating ABLe, users should remove the skull and scalp components of the MRI volume using an automated MEDx
module based on the BET algorithm (Smith, 2000). CT volumes can be cleared of skull and scalp components using an available Tcl/Tk script. Otherwise the accuracy of the normalization of subject brain volumes to Talairach dimensions will be compromised. The first step is to import into MEDx the original subject brain volume, and also the subject brain volume from which the scalp and skull components have been removed. The user may then launch ABLe. Figure 1 shows that the tabs (buttons) along the top of the ABLe main menu denote primary program functions. When these are clicked with the mouse cursor, the program function is displayed. The user then clicks on the button to initiate the function and waits for prompts and updates. When the process is complete, the user can click “next” to initialize the next program function or may elect to click on a program tab to open a function further downstream. When the user clicks on “select,” a dialog box appears, and the user selects the name of the subject brain volume, with skull present, and the program then displays the volume name in the entry field, as depicted in Figure 1. Next the user clicks on “Outline lesion and compute vol-
12
MAKALE ET AL.
Figure 5. The match of a normal MRI volume transformed to Talairach dimensions and the Brodmann graphics. This reveals how well the subject brain was registered to the reference ABLe brain. The 11 slices corresponding to the Damasio sections are shown. The correspondence between the Brodmann graphics and the subject brain margin is close throughout, with some mismatch with the straight gyrus (gyrus rectus) in the lowest slice. Brodmann graphics that do not match precisely can be adjusted in the slices where the mismatch occurs, and the intersection of the lesion with the Brodmann area(s) as reported by the program can be confirmed.
ume,” and the volume is displayed in lightbox format, as shown in Figure 2, and a dialog box appears, asking the user to outline the lesion in the relevant slices. The user may use the “zoom in” feature to enlarge a given slice, and after the lesion is outlined in that slice, may scroll to successive slices. The user outlines the lesion with the mouse and the screen cursor, which is used as a drawing tool. After the lesion is outlined in all the slices in which it is observed, the user clicks on “zoom out” and then clicks “OK” in a program pause icon. The program will then calculate the total lesion volume as well as percent of total brain volume, and display the results. In addition to lesion size determinations, ABLe may be used to find the volume of any anatomic structure or portion of the brain, with the brain displayed as axial, coronal, or orthogonal slices in lightbox format. After the volume has
been calculated, the user clicks “next” in the ABLe program main menu and selects either MRI registration or CT registratiÊÊon (Figure 3). The user may elect to include or exclude the lesion volume for the registration, since in some cases excluding the lesion volume may improve the registration. Also, higher order nonlinear warping, “Allow for nonlinear registration” (Figure 3), may be selected if the linear registration produces unsatisfactory results. The target brain volume is registered, or normalized, to a reference brain in Talairach dimensions, and then the program determines which Brodmann areas are involved with the lesion. The user may elect to just register the volume to Talairach space and forgo the Brodmann area determinations by clicking “Register to Talairach space only” (Figure 3). At the end of the registration process, the program calculates the reg-
QUANTIFICATION OF BRAIN LESIONS
13
Figure 6. ABLe main menu, the “Display Brodmann regions” module.
istration accuracy and displays the result. The registration accuracy is calculated by determining the number of voxels in the two images that do not correspond spatially to a voxel in the other volume, dividing this value by the total number of voxels in the reference image, and finally, dividing by two, so as to count misregistrations only once. The registration usually takes about 5 min with the linear algorithm and 25 min with warping, depending on workstation speed. The program automaticallyperforms the registration,reslices the registered brain volume at a 17º cranial angle, and selects the 11 slices that closely match those in the Damasio templates. ABLe then automaticallydetermines which Brodmann areas the lesion intersects. When this step is complete, an image appears like that in Figure 4, which shows the Brodmann areas as variously shaded lines and the lesion as a solid white area. In ABLe the Brodmann regions are depicted in color. Also, a text report is displayed indicating the lesion volume, its percentage of total brain volume, the Brodmann areas intersected by the lesion, and their percentage intersection. The MRI transformation typically yields superior results to the CT registration because MRI volumes are of a higher resolution. With CT, it is advisable to adjust the acquisition to obtain brain volumes with the highest available resolution in order to attain the best possible volume registration. However, the majority of users will use MRI, and the matching between a normalized subject brain and the Brodmann graphics, drawn on the Talairach normalized reference brain and appearing as bright lines, is depicted in Figure 5. The subject’s brain contains an 85-cc lesion, and despite the presence of this lesion, the fit along the brain slice margins is close, with discrepancies only in the top slice and in the straight gyrus (gyrus rectus) in the lowest slice. The 12parameter linear affine transformation yields a close match,
with few discrepant areas, although if the user is not satisfied with the result, the registration may be repeated by excluding the lesion and also utilizing the higher order warping, which may improve the registration. ABLe has features to enable the user to examine the Brodmann graphics fit (see next section Obtaining and Displaying Results), and in slices where an error in determining the intersection of a lesion with Brodmann areas may have occurred, the user can directly verify the accuracy of the reported intersections. Given the size of most lesions relative to the size of potential mismatches, errors are unlikely, but the user should always check that the Brodmann graphics fit is satisfactory in regions where the lesion resides. If the fit of the Brodmann graphics appears close, then the intersection results will be accurate. Obtaining and Displaying Results After the user reviews the reported results, the display can be closed and the “Display Brodmann Regions” module should be selected (Figure 6). After clicking on “Load Brodmann Atlas,” the user will see the 11 slices from the subject’s Talairach normalized MRI with the Brodmann regions superimposed as bright lines (Figure 5). By using the zoom feature and inspecting each slice, the user may visually determine whether the fit of the regions is satisfactory. A good fit indicates that the brain volume registration was successful. Any Brodmann graphic that matches imperfectly must be selected by clicking on it, and then it should be moved into the correct position. After adjusting the position of the graphic—ensuring that it is selected— the user should click on “Get Brodmann # from graphic.” The Brodmann area number is then displayed. Thus the intersection of the lesion with Brodmann areas in a given slice as reported by ABLe may be checked, although the
14
MAKALE ET AL.
Case Number: 99999 Type of Lesion: unilateral
Volume Loss: 85.52 cc Percentage Loss of Total Brain Volume: 3.80 Registration Accuracy: 94.64% Lesion Intersection Results per Slice:
Figure 7. HTML report showing lesion superimposed on outline of brain slice with Brodmann areas.
adjustment to the Brodmann graphic will not be reflected in the printout of the results. The user may return to “Generate report” in the main menu, and select “Generate HTML report.” A dialog box appears, asking for the subject’s case
number and type of lesion. A Netscape window will appear and display the lesion analysis results in text format, as well as the lesion on black-and-white brain template outlines. The text results may be edited to correct any er-
QUANTIFICATION OF BRAIN LESIONS
15
Figure 8. Markers placed on lightbox view of subject brain volume in Talairach space. The ABLe reports the Talairach coordinates of the markers and the Brodmann area(s) associated with marker location, as well as the tissue types and anatomical structures.
rors in Brodmann area reporting. An example of an HTML report is shown in Figure 7. Each brain slice is saved as a temporary f ile in the workstation/tmp directory, and the user may save these images elsewhere and print them. The results of this analysis may be saved by clicking on “Save measurements.” A dialog box appears asking for the directory path and location to which the user wishes to save the analysis results. These results can easily be read into Microsoft Excel. If the user wishes to obtain the Talairach coordinates of the lesion or any brain structure, “Talairach reporting” is selected. The subject brain volume, in Talairach dimensions, is displayed in lightbox format. The user may elect to use this representation or may select an orthogonal display, with sagittal, transverse, and coronal aspects. The user can then use the mouse to drop markers on any loci in the images as shown in Figure 8, and ABLe will access the Talairach Demon Interface and provide Talairach coordinates of the markers as well as the Brodmann areas involved.This database is derived from the Talairach Demon software of
Lancaster and colleagues (2000), and is distinct from the Damasio templates. This feature also allows the researcher to check the lesion Brodmann area involvementfor the entire brain, not just the Damasio slices. The user can exit Talairach mode by clicking “OK” in a script pause window. Lesion Image Manipulation A potentially very useful feature of ABLe is the ability to compare the location and spatial extent of lesions from different subjects. The user selects “Lesion manipulation” in the main menu and then “Save lesion image” to save the lesion as it appears in each slice to any desired directory path (Figure 9). The user can load one or more lesions and then click on “Display group of lesions.” A black-andwhite image will appear that displays the Brodmann areas and the lesions. Note from Figure 10 that the lesion area varies in terms of shading. This represents lesion overlap, with brighter areas representing greater overlap. If the user selects pixel reporting mode, any pixel within the lesion area can be selected, and the pixel intensity value dis-
16
MAKALE ET AL.
Figure 9. ABLe main menu, “Lesion manipulation” module.
played. If the pixel intensity is 1, then only one lesion is present at that pixel; if the intensity is 3, then three lesions overlap at that point. This provides a count of all the pixels that are common to all overlapping lesions. An HTML re-
port can be generated containing this image, which can be saved and printed. The lesion manipulation module can allow users to assess the degree of lesion overlap among patients exhibiting comparable cognitive deficits.
Figure 10. HTML report showing overlap of lesions from 2 subjects. Note that the top readout indicates that the cursor was over a pixel in which two lesions overlap. The light gray indicates maximum overlap. The greater the number of lesions that overlap in a given area, the brighter that area will appear.
QUANTIFICATION OF BRAIN LESIONS
17
Table 1 Registration Accuracy and Quality of Skull Stripping Modality (MR/CT)
Lesion Location
Registration Accuracy (%)
Skull Strip Quality
MR (abn1) MR (abn2) MR (abn 3) MR (abn5) MR (abn6) MR (ab7) MR (abn9) MR MR MR CT CT CT CT CT CT
left temporal right temporo-parietal left frontal right posterior right parietal right temporo-parietal right posterior frontal frontal frontal frontal frontal frontal frontal frontal frontal
94.6 93.4 90.6 90.9 94.6 91.3 93.4 93 90.4 93 86.9 77.1 84.5 94.1 94.2 93.5
good good good good good good good good good good poor poor poor good good good
Note—MR patient data tagged with ‘abn’ in the table is courtesy of Brett, Leff, Rorden, and Ashburner (2001).
Result of Agreement Test Table 1 shows the registration accuracy for the 16 brain volumes tested. In all cases, this was in excess of 90%, except for three CT brains in which the Tcl/Tk script incompletely removed the skull. This may have affected the registration somewhat, and possibly the accuracy of the ABLe. Table 2 shows that using the manual approach, the two clinicians agreed on 91.5% of the Brodmann areas, and when using ABLe, they agreed on 97.6% of the Brodmann areas. The kappa statistic, which takes into account the likelihood of agreement by chance, was different in the two methods, with kappa for the manual approach calculated as 0.63, which Everitt (1994) categorizes as “substantialagreement,” while kappa with ABLe was determined to be 0.9, which denotes“almost perfect agreement” (Everitt, 1994). Interestingly, with the manual method the agreement between the two practitioners for anterior brain areas was approximately 85%, while for posterior brain regions it was nearly 99%. The overall results show that the agreement between users evaluating lesions with ABLe was considerably better than when the manual approach was used. Despite the fact that the ABLe normalizes the subject brain volumes to Talairach dimensions, the agreement between the manual method and ABLe for each user was good, with 87.5%and 88% observed agreement,and a kappa, for both users, of 0.5, which denotes moderate agreement (Everitt, 1994). The discrepancy may have been due to two main causes. First, it was found that for three of the CT brains, the skull stripping was incomplete, and thereby may have affected registration accuracy. Second, ABLe normalizes brain volumes to Talairach dimensions, and it reslices the brains for comparison against axial template Brodmann graphics, while a manual user may refer to any of six different sets of templates. In any case, ABLe generated acceptable results. The volume loss due to the lesion was determined by ABLe and compared statistically be-
tween the two testers. A paired t test showed a nonsignificant difference between the measurements generated by the two users (t = 0.58, p = .57). CONCLUSIONS The ABLe software has been tested in our laboratory over the past year. The software has proven to be reliable, and is easy to use. Rudimentary UNIX workstation skills are all that is required of the user, and the program is intended to be useful and readily available to a broad range of professionals, including psychologists, neuroscientists, and clinical neurologists. The program is not intended to overcome a lack of neuroanatomical knowledge and therefore is designed with the assumption that users are familiar with brain lesion analysis and neuroanatomy. ABLe is intended to speed up and standardize the process of anatomical analysis, but it is important that users have experience in evaluating lesions represented in CT and MRI scans. The accuracy of ABLe depends to a large extent on how lesion margins are determined and outlined by the user. The other source of inaccuracy with ABLe is likely due to an imperfect volume registration to Talairach space and inexact matching between the Brodmann graphics and the margins of the subject’s brain slices. Registering brains with lesions with or without ventricular enlargement is a problem (Fiez, Damasio, & Grabowski, 2000) that still
Table 2 Level of Agreement Between Two Users of the ABLe Comparison
Practitioner
Observed Agreement
Kappa Value
Manual vs. manual ABLe vs. ABLe Manual vs. ABLe Manual vs. ABLe
1&2 1&2 1 2
91.5 97.6 87.5 88
0.63 (substantial) 0.90 (almost perfect) 0.5 (moderate) 0.5 (moderate)
18
MAKALE ET AL.
eludes an entirely satisfactory solution. ABLe uses a relatively conservative 12-parameter linear affine registration, with the option of either including or excluding the lesion from the registration. However, a comparison of registration accuracy with the lesion included versus the lesion excluded showed a nonsignificant difference between these two measurements [paired t test, t = 1.37, p = .2, mean (lesion included) = 90.98%, mean (lesion excluded) = 90.92%]. A higher order warping algorithm is available and may provide an improved registration in some cases, but users need to be aware that such algorithms can potentially result in excessive distortionof areas with tissue loss to match the reference brain. In later versions of the ABLe, it may be possible to use a higher order algorithm that would produce more exact sulcal matching and allow the user the ability to effectively constrain the extent of the warping to minimize excessive warping in areas of tissue loss or ventricular enlargement. The ABLe relies on spatial relationships between the lesion and Brodmann areas, while a neuroanatomist uses landmarks, such as the central gyrus and Sylvian fissure. It may be possible to add the option to use landmarks to guide the registration. In any case, the practitioner should have the habit of looking at the overlay of Brodmann graphics to verify the accuracy of the program’s findings. The ability of ABLe to determine the topography of brain lesions in terms of Brodmann’s cytoarchitectonic areas, and to determine lesion overlap between multiple subjects, are powerful features that should receive an enthusiastic reception from many potential users. The ability to print black-and-white brain slice outlines with lesions superimposed and with multiple lesions allows a user to easily prepare publication quality figures. ABLe is based on the Damasio templates, and while these templates are a widely accepted standard and represent an extremely important resource, they have unavoidable limitations in terms of accuracy. The Damasio templates were prepared by referring to Brodmann’s atlas (Brodmann, 1909) and other sources. Human brain material was sliced, and then drawings of the slices were marked according to Brodmann’s scheme. When and if a modern atlas of cytoarchitectonic areas based on histological work performed on several human brains becomes readily available, this can be incorporated into ABLe. For the present, however, the Damasio templates remain the best compromise, and ABLe is the only generally available, standardized, automated software package that can determine the extent of brain lesions in terms of cytoarchitectonicregions in Talairach space. This program represents a very considerable advance over manual methods of brain lesion analysis, and it contains powerful features that should substantially facilitate research in neurological and cognitive neuroscience laboratories.
REFERENCES Ashburner, J., & Friston, K. J. (1999). Nonlinear spatial normalization using basis functions. Human Brain Mapping, 7, 254-266. Braak, H. (1980). Architectonics of the human telencephalic cortex. New York: Springer-Verlag. Brett, M., Leff, A., Rorden, C., & Ashburner, J. (2001). Spatial normalisation of brain images with focal lesions using cost function masking. NeuroImage, 14, 486-500. Brodmann,K. (1909).Vergleichende Lokalisationslehre der Grosshirnrinde in ihren Prinzipien dargestellt auf grund des Zellenbaues. Leipzig: Barth. Christensen, G. E., Rabbitt, R. D., & Miller, M. I. (1996). Deformable templates using large deformation kinematics. IEEE Transactions on Image Processing, 5, 1435-1447. Collins, D. L., Peters, T. M., & Evans, A. C. (1994). An automated 3D non-linear image deformation procedure for determination of gross morphometric variability in the human brain. Proceedings on Visualization in Biomedical Computing (SPIE), 3, 180-190. Damasio, H. (1995). Brain anatomy in computerized images. New York: Oxford University Press. Damasio, H., & Damasio, A. R. (1989). Lesion analysis in neuropsychology. New York: Oxford University Press. Davatzikos, C. (1996). Spatial normalization of 3D brain images using deformable models. Journal of Computer Assisted Tomography, 20, 656-665. Duvernoy, H. (1991). The human brain: Surface three-dimensional sectional anatomy and MRI. New York: Springer-Verlag. Everitt, B. S. (1994). Statistical methods for medical investigators (2nd ed.). London: Edward Arnold. Fiez, J. C., Damasio, H., & Grabowski, T. J. (2000). Lesion segmentation and manual warping to a reference brain: Intra- and interobserver reliability. Human Brain Mapping, 9, 192-211. Frank, R. J., Damasio, H., & Grabowski, T. J. (1997). Brainvox: An interactive, multimodal visualization and analysis system for neuroanatomical imaging. NeuroImage, 5, 13-30. Joshi, M., Cui, J., Doolittle, K., Joshi, S., Van Essen, D., Wang, L., & Miller, M. I. (1999). Brain segmentation and the generation of cortical surfaces. NeuroImage, 9, 461-476. Lancaster, J. L., Woldoroff, M. G., Parsons, L. M., Liotti, M., Freitas, C. S., Rainey, L., Kochunov, D., Nickerson, D., Mikiten, S. A., & Fox, P. T. (2000). Automated Talairach atlas labels for functional brain mapping. Human Brain Mapping, 10, 120-131. Mazziotta, J. C., Toga, A.W., Evans, A. C., Fox, P., & Lancaster, J. (1995). A probabilistic atlas of the human brain: Theory and rationale for its development. NeuroImage, 2, 89-101. Nowinski, W. L., Fang, A., Nguyen, B. T., Raphel, J. K., Jagannathan, L., Raghavan, R., Bryan, R. N., & Miller, G. A. (1997). Multiple brain atlas database and atlas-based neuroimaging system. Computer Aided Surgery, 2, 42-66. Roland, P. E., & Zilles, K. (1998). Structural divisions and functional fields in the human cerebral cortex. Brain Research Reviews, 26, 87105. Smith, S. (2000). Robust automated brain extraction. In P. T. Fox & J. L. Lancaster (Eds.), Sixth International Conference on Functional Mapping of the Human Brain—Proceedings. San Diego: Academic Press. Talairach, J., & Szikla, G. (1967). Atlas d’anatomie stereotaxique du telencephale: Études anatomo–radiologiques. Paris: Masson et Cie. Talairach,J., & Tournoux, P. (1988). Co-planar stereotaxic atlas of the human brain. New York: Thiem. Thompson, P., & Toga, A. (1996). A surface based technique for warping three-dimensional images of the brain. IEEE Transactions on Medical Imaging, 15, 402-417. Woods, R. P., Cherry, S. R., & Mazziotta, J. C. (1992).Rapid automated algorithm for aligning and reslicing PET images. Journal of Computer Assisted Tomogaphy, 16, 620-633.
(Manuscript received June 12, 2000; revision accepted for publication May 16, 2001.)