Quantification of Condition Indicator Performance on a Split Torque Gearbox Eric Bechhoefer, Goodrich SIS, 100 Panton Rd, Vergennes, VT
[email protected] Ruoyu Li and Dr. David He, University of Illinois at Chicago The Department of Mechanical and Industrial Engineering
[email protected] ABSTRACT The requirement for higher energy density transmissions (lower weight) in helicopters has lead to the development of the Split Torque Gearbox (STG) to replace the traditionally planetary gearbox by the drive drain designer. This may pose a challenge for the current gear analysis methods used in Health and Monitoring Systems (HUMS). Gear analysis uses time synchronous averages to separates in frequency gears that are physically close to a sensor. The effect of a large number of synchronous components (gears or bearing) in close proximity may significantly reduce the fault signal (increase signal to noise) and therefore reduce the effectiveness of current gear analysis algorithms. In this study, we developed a STG for testing in order to generate a no fault and single gear fault date sets of vibration data. These vibration signatures are processed through the a number of gear analysis algorithms (see Table 1, 2 and 3) to quantify performance. The performance metric was separablity. Additionally, advance signal processing techniques where developed in order to potentially improve separability.
INTRODUCTION Helicopter performance, economy and development cost are a function of weight. The split torque gear (STG) box (ref[1]) is an alternative to traditional planetary gearbox design. Potentially, the STG saves weight, can be more reliable, have reduce transmission noise, and improved efficiency. These benefits have driven the helicopter manufacturing community to develop products using the STG. For example, the Comanche helicopter was designed with a STG, and the new Sikosky CH-53K will incorporate the STG design to transmit over 18,000 shp to the rotor blades. It is likely that STG will be incorporated into more designs in the future (ref [2]). Because of the limited experience in building helicopter with STG, there is no condition based monitoring data on this type of gear box. Studies have been conducted to model and analyze vibration dynamics of the STG (ref [3]), and analysis on gear loading has been conducted (ref [4]). Yet, these studies do not give insight into fault detection of gears on this type of design. Gear diagnostics use time synchronous averages to separates in frequency gears that are physically close. The effect of a large number of synchronous components (gears or bearing) in close proximity may significantly reduce the fault signal (increase signal to noise) and therefore reduce the effectiveness of current gear analysis algorithms In order to gain experience in performing HUMS types of analysis on STG, Goodrich working with the University Presented at the American Helicopter Society 65th Annual Forum, Grapevine, Texas, May 27-29, 2009. Copyright © 2009 by the American Helicopter Society International, Inc. All rights reserved.
of Illinois at Chicago (UIC) have build a test gearbox for the purpose of testing condition indicators (CI) used in HUMS and condition based maintenance practices. The primary design considerations where emulation of synchronous gear signals that would be found in a STG (see figures 1 & 2).
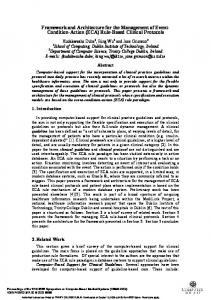
Figure 1 Input Drive Side of STG Test Rig The input spur gear is a 40-tooth gear, driving three, input spur idler gears of 72 teeth. The idler shafts drives three, 48tooth output spur idler which drives a single 64-tooth output spur gear. Accelerometers where mounted on the input drive pinion and on each output drive idler. The fault was characterized as removal of 20% of the gear tooth on one of the output drive idler. The location of each accelerometer
was placed such that: there was optimal fault detection, and that there would be some potential for sensor fusion (figrue 5).
•
Ageing induced defects such as pitting, spalling and increased surface roughness.
•
Assembly and/or wear resulting in misalignment, improper backlash or looseness.
•
Manufacturing error resulting in an eccentric gear or non-uniform gear tooth spacing.
•
Mesh impact/soft tooth due to gear tooth chipping, cracking of the gear tooth base.
Each fault could induce one or more CI to indicate an anomalous condition. While studies have been conducted to model gear fault dynamics (ref [5], ref [6]), no one CI is seen to be sensitive to all gear fault modes. Additionally, it is unlikely that, in the near future, any CI will denote an absolute level of damage.
Figure 2 Output Drive Side of the STG Test Rig The STG test rig is representative of an operational STG in the generation of synchronous tones test CBM/HUMS analysis gear analysis algorithm. The cost, size and power where driving considerations in the design of this STG, which was ultimately developed by SpecrtaQuest, Inc. A more representative gearbox design, such at seen in ref [4] from the Comanche STG is given in figure 3.
Implicit in absolute levels of damage is a probability of gear continuing to transmit torque over some period of time, e.g. a CI value of xx indicates that the gear will transmit torque for 100 hours with a probability of .95. However, both test stand and real world experience have shown that a number of CI values change relative to a level of damage. This suggests that a stochastic or hypothesis testing methodology can be used to indicate impending gear failure. In fact, most HUMS use statistical limits (e.g. mean plus 3 standard deviation, for example) to indicate when maintenance is appropriate. Given the literature of gear CI, in this study 20 gear/shaft based analysis and 38 gear analysis were conducted on nominal and faulted gear box, and a measure of seperability (ability to discern a statistically significant change) between the nominal and faulted gear was measured. Finally, non-traditional gear analysis was attempted using advance signal processing techniques. A formal developmental description and results will be given after the traditional gear analysis results. Gear Analysis Description The 58 gear analysis were all based on processing time domain vibration data into a synchronous average (SA). SA is a technique where gear and shaft vibration are resampled to remove variation is shaft RPM speed. This has two benefits: •
Each bin in the results Fourier transform (FFT) represents one shaft revolution. All the energy associated with a shaft order or a gear mesh is then just the FFT at the appropriate bin index + 1 (bin 1 is the DC component, and with an AC coupled system, should be zero. The first harmonic for a 40 tooth gear is bin 41).
•
Any spurious noise is average. In general, the noise reduction is 1/sqrt(number of revolutions). Each revolution is estimated by the product of the time between tachometer zero crossings (usually rising edge)
Figure 3 Comanche STG Showing Compact Size and High Gear Reduction Ratio GEAR ANALYSIS Gears are complicated dynamic structures with a number of failure modes. Any CBM/HUMS type of analysis needs to capture these damage modes to ensure appropriate maintenance can be conducted prior to failure. For example, gear damage can be characterized by:
fundamental amplitude. These algorithms can identify gears by the number of teeth (table 2).
and the shaft ratio from the shaft on which the tachometer signal is taken. A number of SA techniques have been developed (ref [7]). In this study, the optimal interpolation method was chosen. In this method, a linear-phase FIR filter is constructed that minimizes the weighted, integrated squared error between an ideal piecewise linear function and the magnitude response of the filter over a set of desired frequency bands. The generalized filter is (eq (1)):
h(t) =
sin(πt /T )
(πt /T )
×
cos(Rt /T )
(1− 4R t
2 2
/T 2 )
eq (1)
where R is the roll off factor and T is the symbol period. Essentailly, the filter h(t) interpolates n samples into N samples, where
N = 2 ceiling(log 2 (n ))
•
Gear algorithms based on statistics/features of the SA band passed filtered around the gear tooth mesh rate (e.g. narrow band signal analysis, table 3).
For a full description of the gear algorithms used see ref[5]. The measure of seperatbility was calculated using the pooled sample standard deviation. The sample size was 20 acquisitions per sample set, where the populations for the null set came from the nominal gear (no damage) and the alternative set came from the damage gear population. The test statistics is then:
T=
eq(2)
for radix 2 FFTs.
E [Y1] − E [Y2 ] Sp 2
eq(3)
n
The pseudo code for the SA is: where BT: average elapse time between tachometer impulses. N: number of points in the FFT Phi0: Initial shaft angle Phi: shaft angle Rev: number of revolutions in SA Rat: shaft ratio relative the tach signal Zct: zero crossing time Incr: shaft increment =1/N Isamp: interpolated sample Samp: time domain signal SR: sample rate; SA: synchronous average For r = 0 to r < Rev, Phi0 = Rat + r; For k = 0; k < N Phi = (Phi0 + k*Incr)/Rat; Dt = conv(h(t),zct(t)) Isample = conv(h(t),Samp(Dt*SR)) SA(k) = SA(K) + isamp; End End SA = SA/Rev The CI are features of the SA. There are typically three types of CI features that are derived from the SA: •
Shaft algorithms which detect fault on any gear associated with the shaft (e.g. if a gear is attached to either end of the shaft, it is not possible to identify which gear is faulted). These typically include statistics on the SA, or ratio of statistics on the SA (table 1).
•
Gear algorithms based on the ratio of gear mesh amplitudes or the ratio of gear mesh amplitude to shaft
Sp =
(n −1)S12 + (n −1)S22 2n − 2
eq(4)
A test statistic T greater than 3.58 is considered significant and would indicate that the CI could detect the fault (ref[8]). Table 1. Shaft Based Algorithm Results. Condition Indicator SO1 Amplitude SO2 Amplitude SO3 Amplitude SA Pk 2 Pk SA Crest Fact. SA Skewness SA Kurtosis SA RMS SA Phase Kurtosis Residual RMS
T .66 1.14 .84 4.0 2.55 1.4 3.4 3.0 .04 2.8
Condition Indicator Gear Dist. Fault Energy Operator CF EO Pk 2 Pk EO Skewness EO Kurtosis EO RMS Residual Skewness Residual Kurtosis Residual Pk 2 Pk Residual Crest Fact.
T 2.34 0.04 2.4 0.04 .005 3.5 1.0 0.65 2.75 1.24
The large statistical difference (T of 4) seen in the SA Peak to Peak suggests that the mesh tones are increased in the damage gear. Table 2. Gear Algorithm Based on Mesh Tones. Condition Indicator Mesh Rate Mesh 2nd Harmonic Mesh 3rd Harmonic G2 Rate G2 2nd Harmonic G2 3rd Harmonic SA RMS
T 2.6 3.1 0.55 4.3 1.4 1.88 3.0
Condition Indicator Sideband Mod 1 Sideband Mod 2 Sideband Mod 3 Gear Mesh 1 Gear Mesh 2 Gear Mesh 3
Table 3. Narrow Band Signal Analysis
T 4.3 4.2 2.5 1.44 2.8 3.8
Condition Indicator Narrow Band 6th M NB 5th Moment NB PK 2 PK NB Kurtosis NB Skewness NB CF NB RMS FM RMS FM CF FM Skewness FM Kurtosis
T 4.1 1.3 0.1 4.4 0.04 7.1 1.1 0.22 2.8 0.3 1.5
Condition Indicator Derivative FM RMS DFM Kurtosis AM RMS AM CF AM Skewness AM Kurtosis DAM RMS DAM CF DAM Skewness DAM Kurtosis
T 3.0 1.2 1.12 7.3 0.9 0.6 1.92 0.37 0.38 .19
It would be useful if a beam former could be used as a spatial filter that linearly combined the output of n accelerometers so that signals arriving from some particular directions are amplified, while signals from other directions are attenuated. Consider a sensor array consisting of two accelerometers, A and B (see figure 4).
There was a number of gear CIs that would indicate gear fault. This should not be considered an easy case to perform analysis. A number of observations come out of the study. Data was acquired at a number of torque (e.g. brake) levels. Essentially, no detection was possible at lower torque settings. This can be attributed to the nature of the STG, where the torque paths, and therefore loads, are split. Additionally, the gears relative to the driving loads, are large: the drive motor can supply only 3 HP. In other words, the gearbox was over designed for the loads present. What this shows is that those algorithms with a T > 3.58 are remarkable sensitive to gear fault. ADVANCE SIGNAL PROCESSING TECHNIQUES Test stands provide good opportunities to test new algorithms and techniques. Given this, three signal processing techniques where evaluated as potential new methodology for gear fault detection. The first technique, beam forming, would take advantage to n number of sensor to reject unwanted noise by “steering” the sensor array sensitivity to the desired signal source. The second techniques, linear prediction coding, models the periodic signals (e.g. shaft and gear mesh tones) and dynamically predicts the signal d steps in the future, removing them. This, in theory leaves only fault signatures or random noise. This technique is called narrowband interference cancellation. The third technique, empirical mode decomposition (EMD) would decompose the vibration signal into several intrinsic mode functions (IMF) and then the interested IMF component would be analyzed to reveal the gear fault. Beam Former Technology An accelerometer, hard mounted to the gearbox, will generally receive a number of undesired signals in addition to the signal of the component under analysis. These extraneous signals are of random phase, and tend to increase the noise of the system, masking signals of interest. This can be a more serious matter in STG where there are synchronous signals that differ only in phase and amplitude when reaching a sensor.
Figure 4 Example: Array of Two Accelerometers The signal s(n) = A cos(ωn) and v(n) = B *cos(ωn), arriving at angles 0 and Φ, with respect to the line perpendicular to the line combining A and B, which are the inputs to the array filter which consists of a phase-shifter and subtractor. The signal s(n) arrives at elements A and B at the same time, where the arrival times of signal v(n) at A and B are different. Thus,
sA (n ) = sB (n) = α cos(ωn ) v B (n ) = β cos(ωn )
eq(5)
v A (n ) = β cos(ωn − φ ) Where A and B are used to denote the signals picked up by accelerometers A and B, respectively, and phi is the phaseshift arising from the time delay of arrival of v(n) at element A with respect to its arrival at B. It is assumed that s(n) is the desired signal and v(n) is an interference, then by inspection we can find a phase shifter equal to f with which we can cancel out v(n). The desired signal reaches the filter output as A cos(ωn) - cos(ωn-Φ)), which is non-zero and still holding the information contained in a. The algorithm to do this is based on the leastmean-square (LMS) algorithm developed by Widron and Hoff (see ref [9]). Using two sensors from the STG, a beam-former to nulls signals that are not coming perpendicularly into the sensor was tested. The accelerometers where mounted parallel to each shaft, such that signatures that arrive off axis would be from a gear that are not of interest. Theoretically, this would improve the signal to noise of the gear under analysis, which has the benefit of increasing the discriminate capability of the gear algorithms.
Testing of the beam former showed no improvement gear fault discrimination. This was disappointing and, on further investigation, not surprising. In RADAR for example, each antenna element is a dipole, with sensitivity not a function of arrival angle. This is not the case of shear style accelerometer, which has sensitivity of, at most, 10o on axis. Due to the placement of the accelerometers (see figure, 5) there was very little signal interference from the adjacent gears.
s(n) is the signal of interest y(n) is the signal associated with gear mesh, shafts, e.g. interference. v(n) is random noise. The interference signal is typically large compared to the signal of interest. It is necessary to remove the interfering signal y(n) from x(n) while preserving the signal of interest s(n). Since the measured signal x(n) and the interference y(n) are correlated, one can estimate the interference using an optimal linear estimator:
yh(n ) = c t x(n − D ) Rc = d
[
]
R = E x(n − D )x t ( x − D )
d = [x(n − D ) y (n )]
eq(6)
where D is the delay operator. If yh(n) = y(n), the output of the filter is x(n)-yhat(n) = s(n)+v(n). This means we can completely remove the interference and only the desire signal and noise remains. In practice, signal y(n) is not available. One can use a minimum means square error D-step linear predictor, such that: e(n) = x(n) + atx(n-D) and Ra = -r, where r = E[x(n-D)x(n)]. Figure 5 Accelerometer Location
For this modeling assumptions to hold true:
Due to this limitation, additional accelerometer mounting bosses where machined into the gearbox shaft supports. This will allow future analysis of beam former techniques in the future.
•
Narrowband Interferance Canceller Most gear algorithms used in HUMS are based on measuring frequencies associated with gear mesh tones. For example, Mesh Analysis is the ratio of gear mesh harmonics to the base mesh tone. Similarly, G2 analysis is the ratio of the signal average peak to peak value and the gear mesh tone. Some analysis, such as demodulation analysis, measures change in gear mesh tone amplitude or frequency. However, none of these analyses measure the fundamental artifact of a soft or cracked gear tooth: a high frequency impulse due to the local fault. This type of fault is difficult to detect with current Fourier transforms (FFT) in that this transform measures sinusoids tones and is relatively insensitive to periodic impulse trains. Additionally, in a gear box, there are a number of narrow band tones and broad band noise which mask the desired impulse train. The system can be modeled as: x(n) = s(n) + y(n) + v(n) where
• • •
The signal of interest s(n) and the noise signal v(n) are uncorrelated The noise signal v(n) is white The signal of interest s(n) is wideband and has a short correlation length (e.g. its impulsive), r(l) = 0 for l > D. The interference signal y(n) has a long correlation length: its autocorrelation length takes significant values over the range 0