James Ford1, Heather Wishart2, Andrew Saykin2 ..... Mackin, G. A., Jolesz, F. A., Weiner, H. L.: Longitudinal MRI in Multiple-Sclerosis: Correlation between ...
Quantifying Evolving Processes in Multimodal 3D Medical Images Yuhang Wang1, Tilmann Steinberg1, Fillia Makedon1, James Ford1, Heather Wishart2, Andrew Saykin2 1
The Dartmouth Experimental Visualization Laboratory, Department of Computer Science, Dartmouth College Hanover, NH 03755, USA {wyh, tilmann, makedon, jford}@cs.dartmouth.edu 2 Brain Imaging Laboratory, Dartmouth Medical School, Dartmouth College, Hanover, NH 03755, USA {Wishart, Saykin}@dartmouth.edu
Abstract. Quantitative measurements of changes in evolving brain pathology, such as multiple sclerosis lesions and brain tumors, are important for clinicians to perform pertinent diagnoses and to help in patient follow-up. Lesions or tumors can vary over time in size, shape, location and composition because of natural pathological processes or the effect of a drug treatment or therapy. In the past, people have used as a quantitative measurement the change in total or regional lesion/tumor volume. In this paper we propose a new model to quantify changes in evolving processes in multimodal 3D medical images. We believe this model reflects changes in pathology more accurately because it simultaneously takes into account information in multiple imaging modalities and the location of lesion/tumor voxels. We demonstrate the effectiveness of this model with experiments on synthetic lesion data.
1
Introduction
The precise quantification of changes over time in evolving processes, such as multiple sclerosis (MS) lesions and brain tumors, is extremely important for several reasons, including: • for clinicians to perform pertinent diagnoses, e.g., to determine when a potentially invasive drug is to be given, or surgery is to be performed; • for clinical follow-up, e.g., to quantify the effects of medicine or surgery over time. The main source of in-vivo information about lesion/tumor growth is magnetic resonance imaging (MRI) [11]. Classical quantitative methods for quantifying lesion growth include measuring total lesion volume and regional lesion volume. The volume variation is an index of the lesion evolution. Total lesion volume is only an approximate correlate of clinical disease severity in part because it fails to take into account the fact that lesions in different regions of the brain may have different types and degrees of clinical impact.
Regional lesion volume takes location information into account, however both total and regional lesion measurements have typically relied on a single imaging modality at a time. There is evidence to suggest that multispectral approaches will yield a better correspondence between imaging findings and clinical symptoms [5]. In this paper we introduce a new method of quantifying regional changes in evolving lesions/tumors in multimodal 3D medical images. The main idea is to use the weighted sum of the distances of feature vectors for each voxel between two different time points. Voxels will be weighted differently depending on their location. To demonstrate the effectiveness of a lesion/tumor analysis metric for predicting clinical status, it is customary to correlate the metric with clinical status scales. In studies of MS, for example, the Expanded Disability Status Scale (EDSS) is often used as an indication of clinical status. Neuropsychological tests provide a useful metric when the goal is to predict cognitive symptoms based on MRI data. A high correlation indicates that the metric accurately reflects clinically relevant changes in pathology. We model the problem of finding the optimal weights to maximize this correlation as a constraint optimization problem and discuss algorithms to solve this problem. This paper is organized as follows: Section 2 reviews related work on quantitative lesion/tumor analysis. Section 3 gives the proposed Weighted Sum of the Vector Distances (WSVD) approach. Section 4 discusses weights optimization algorithms. Section 5 presents preliminary experimental results using synthetic lesion data. Section 6 lists the conclusions and directions for future work.
2
Background and Related Work
Previous quantitative lesion tracking research [2, 3, 8] used total lesion volume and regional lesion volume to quantify lesion growth using one or two MRI modalities. Total lesion volume disregards location information and both approaches are limited to using one imaging modality. Thirion et al. [9] examined explicitly the quantitative measurement of volume variations over time. However, they measured global change in lesion volumes, not local changes. Recently, Mainero et al. [5] reported that composite MR scores computed using multivariate linear regression models were strongly correlated with EDSS scores in patients with MS, while the correlations between EDSS score and each of the MR quantities (T2 lesion volume, T1 lesion volume, brain magnetization transfer ratio, etc.) taken in isolation were not significant. Tzika et al. [10] also demonstrated that using multiple MRI modalities can enhance assessment of brain tumors in children. These studies demonstrated the usefulness of multispectral approaches, but did not address the importance of lesion location. Our proposed approach is longitudinal, multispectral, and takes location information into account.
Table 1. MS Pathology Tracking Database. All scans registered to the spoiled grasse (SPGR) sequence, with “voxel” referring to SPGR voxel. The SPGR scan is registered to the standard brain atlas
Voxel Coordinates (x,y,z)
DTI
FLAI R
Post Gad
SPGR blackholes
1,1,1
1
1
1
1
1,1,2
1
0
0
0
1,1,3 1,1,4 …
1 0 …
1 1 …
0 1 …
0 0 …
Interpretation Severe, currently active pathology, with possible cell death Change in normal-appearing brain tissue with no evidence of defined lesion or bloodbrain barrier breakdown Chronic, nonactive pathology Active pathology …
This work is a natural extension of the In-vivo Pathology Tracking (IPT) approach proposed in [6]. The IPT system is a low-level database that can be used to analyze different MR modalities using different approaches. In the IPT system, voxels in each type of MR scans are coded for the presence or absence of pathology for each subject and entered in a database along with the location of the voxel in standard threedimensional atlas space (xyz coordinates). Scans are assessed independently, after which the various combinations of normalcy or pathology on the different imaging techniques yield different characterizations of and prognoses for each voxel (Table 1). This approach lends itself to the use of combined imaging modalities in clinical practice, and to research applications involving the correlation of symptoms and brain activity patterns with disease-related structural brain abnormalities.
3
Weighted Sum of the Vector Distances (WSVD)
To quantify lesion/tumor changes in multimodal medical images, we propose a new approach called Weighted Sum of the Vector Distances (WSVD). As the name indicates, the WSVD method models the lesion/tumor change from time point t1 and t2 as the weighted sum of the vector distances between voxels at time point t1 and t2 in the IPT database. Suppose the voxels are labeled vijk, where i, j and k are integers labeling the voxels along the x, y and z axes respectively. Suppose we use n imaging modalities M1 through Mn. Let Mm(ijk, t) denote the scalar for voxel vijk at time point t in imaging modality Mm. The value of Mm(ijk, t) is either 1 or 0 depending on whether it is labeled as a lesion/tumor voxel or not:
(a)
(b)
(c)
(d)
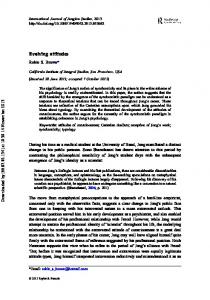
Fig. 1. (a) and (b) show lesions with potentially different clinical implications. (a) shows a lesion in the centrum semiovale proximal to cortical association regions, important for higher cognitive functioning. (b) shows a lesion of similar size and intensity in a smaller anterior corticofugal white matter bundle with possible implications for motor functioning. In general, given the size of the two lesions relative to the respective white matter regions in which they are located, the second could be hypothesized to have greater impact on clinical status as it is essentially occupying the pathway in which it is located. (c) and (d) show lesions at different time points. Despite the depicted differences in these lesions, they are located in the same region and are of approximately the same volume. Because our WSVD method examines changes in the lesion voxels in standard space, it is capable of quantifying the differences in (a) vs (b) and in (c) vs (d)
1, if voxel vijk is labled as a lesion/tumor voxel M m (ijk , t ) = at time point t in imaging modality M m . 0, otherwise.
(1 )
Let
! vijk ,t = ( M 1 (ijk , t ), M 2 (ijk , t ),..., M n (ijk , t ))
(2 )
denote the feature vector for voxel vijk at time point t. For example, the voxel data at time point t illustrated in Table 1 becomes ! ! v111,t = (1,1,1,1) and v112,t = (1, 0, 0, 0) , etc. Let D(t1, t2) denote the lesion/tumor change from time point t1 and t2. We define D(t1, t2) as follows.
D(t1 , t2 ) =
∑w
ijk∈S
ijk
! ! d (vijk ,t1 , vijk ,t2 )
(3 )
where
wijk ∈ [1, +∞) is the weight assigned to voxel vijk based on its location in the brain; S = {ijk | vijk is a lesion/tumor voxel at some time point in some imaging modality}; ! ! ! ! d (vijk ,t1 , vijk ,t2 ) is the vector distance between vijk ,t1 and vijk ,t2 . We then assign the weights using the following two approaches:
1. Voxel-based approach In this approach, we use an independent weight variable for each voxel. So if the scans have resolution 256x256x48, there will be 3.15x10⁶ different weight variables. 2. Atlas-based approach In this approach, we use an independent weight variable for each brain structure. Let Wh be the weight assigned to brain structure H. We define
wijk = ∑ Wh ⋅ P(vijk ∈ H )
(4 )
where P (vijk ∈ H ) is the probability that voxel vijk belongs to brain structure H.
!
!
To compute the vector distance d (vijk ,t1 , vijk ,t2 ) , we can use two approaches. 1. Apply a distance measure For example, we can use the generalized Minkowski metric (Lr metric):
d ( x, y ) =
p
r
∑ | xi − yi |r
(5 )
i =1
Three special cases of Lr metric are of particular interest, namely, r = 1(Manhattan distance), r = 2(Euclidean distance), and r = ∞. 2. User-specified distance matrix Due to the complex nature of pathological changes, a distance matrix filled with empirical values chosen by the user may be more suitable than distance functions. In the distance matrix, the rows and columns represent all the possible feature vectors of length n. The value of the matrix element aij represents whether the observed change from the vector represented by row i to the vector represented by column j reflects deterioration or improvement in tissue integrity. If we have n=4 imaging modalities, the distance matrix is of size 2 × 2 . This WSVD model is more general than lesion/tumor volume. In fact, if we have only one imaging modality and assign weights of 1 to all the voxels, we get the change of lesion volume. 4
4
4
Weights Optimization
Suppose we have scans taken at time point t1 through tn for k patients. We also have patient performance tests taken for each patient at time point t1 through tn. We then have k×n scores represented as s(1,1), s(1,2),…s(k,1), s(k,2), …, s(k,n). The weights are the central part of this model. We want to find the optimal weights Ws such that the correlation between Dl(ti, ti+1) for patient l and the changes of patient test score yl,i = s(l, i) – s(l, i+1). We want to maximize the correlation coefficient defined by
k
r=
n −1
∑∑ ( x l =1 i =1
l ,i
(6 )
− x )( yl ,i − y )
k n −1 k n −1 2 x − x ( ) ( yl ,i − y ) 2 ∑∑ ∑∑ l , i l =1 i =1 l =1 i =1
Where
x=
xl ,i = Dl (ti , ti +1 )
(7 )
yl ,i = s (l , i ) − s (l , i + 1)
(8 )
k n −1 k n −1 1 1 xl ,i , y = yl ,i ∑∑ ∑∑ k (n − 1) l =1 i =1 k (n − 1) l =1 i =1
(9 )
subject to Wh
≥1
(10)
We solve this problem using the quasi-Newton method (see [7]). The quasiNewton method is a popular general-purpose algorithm for constrained optimization. Then we normalize the resulting weights by dividing all the weights by the first weight W1. This step is necessary because the algorithm may converge at equivalent but different weights depending on the initialization.
5
Experiments
105 104 103 102 101 100
21,992.0 32.5 1.0 W1
W2
1.0 W3
1.2 W4
1.0 W5
1.0 W6
W7
1.0 W8
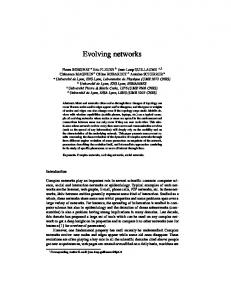
Fig. 2. Optimal weights for each of the 8 brain regions are computed. The weight for the frontal lobes is W2 , which is greater than other weights
To test the effectiveness of the proposed approach, we experimented with synthetic MS lesion data. A series of synthetic Fluid Attenuated Inversion Recovery (FLAIR) lesion scans, simulating scans taken at 12 time points, were generated using the SDC Morphology Toolbox for MATLAB V1.2. [1]. Synthetic lesions were generated by applying mathematical morphological operators on a segmented FLAIR lesion scan. We artificially divided the whole brain into 8 regions and grew lesions only in the
region designated as frontal lobes. For other regions, lesion volumes were generated randomly. We also generated corresponding synthetic Trail Making Test, Part B scores for each of the 12 time points. The Trail Making Test, Part B is a standardized measure of executive ability thought to correlate at least in part with frontal system functioning [4]. The score on this test is the time to complete (in seconds) and can range from 0 to 300 seconds. The synthetic scores on this test are generated based on the lesion volume in the frontal lobes. We also added 30% noise to the synthetic scores. Through this experiment, we investigated whether our method can assign weights optimally and obtain strong correlation between lesion data and cognitive tests. The weights are initially set to 1, and the optimal weights as output are shown in Fig. 2. As expected, the weight for region 2 (the region designated as the frontal lobes) is significantly bigger than weights for other region. As shown in Table 2, with these weights, the correlation coefficient computed using formula (6) is –0.9237, which is greater than the correlation coefficient (–0.7505) computed using total lesion volume. Therefore, our method shows a stronger correlation than the traditional lesion load metric. The computed weights also reveal the underlying principle used to generated the synthetic data, that is, that the frontal lobes are more important than other regions in terms of executive functioning. Table 2. Correlation coefficients computed with and without weights
Correlation coeffiecent
6
With computed optimal weights –0.9273
Without weights (all weights set to 1) –0.7505
Discussion and Future Work
In this paper, we completed a preliminary test of our proposed WSVD method for quantifying lesion/tumor changes. This new method: • takes into account lesion/tumor location information; • is capable of using multiple modality information; • finds optimal weights automatically. Our system is also an open data fusion framework that integrates disparate data streams, and can incorporate other MR modalities, such as Diffusion Tensor Imaging (DTI). Our current implementation combines both voxel-based and atlas-based approaches. The weights are based on a standard brain atlas, but the changes are computed at the voxel level. This is advantageous because, if we assign an independent weight variable to each voxel, there would be too many weight variables (the total number of voxels is about 3×10⁶) and would require a huge dataset to produce meaningful results. However, it would be interesting to investigate the feasibility of a purely voxel-based approach, where we can apply dimensionality reduction techniques, such as independent component analysis, to reduce the number of weight variables. It is also possible to extend our method to optimize weights for correlation with multiple test scores.
This paper represents the first test of our proposed WSVD method for predicting the clinical relevance of MRI changes over time. For this initial work, we used a simplified case with one imaging modality, FLAIR. It is unlikely that frontal MS lesion volume would grow steadily while the lesion changes in other regions were random. The synthetic data were used only for testing the capability of the system to find optimal weights. The WSVD method is designed to work with multiple MRI modalities and application to multispectral data is in progress, as is clinical validation. Other future work includes visualization of changes in MS lesions over time, and development of similarity search algorithms based on the WSVD model to search for similar series of MRI lesion scans in the IPT database.
References 1. SDC Information Systems: SDC Morphology Toolbox for MATLAB V1.2. http://www.mmorph.com (2002) 2. Guttmann, C. R. G., Kikinis, R., Anderson, M. C., Jakab, M., Warfield, S. K., Killiany, R. J., Weiner, H. L., Jolesz, F. A.: Quantitative Follow-up of Patients with Multiple Sclerosis using MRI: Reproducibility. Journal of Magnetic Resonance Imaging 9 (1999) 509–518 3. Khoury, S. J., Guttmann, C. R. G., Orav, E. J., Hohol, M. J., Ahn, S. S., Hsu, L., Kikinis, R., Mackin, G. A., Jolesz, F. A., Weiner, H. L.: Longitudinal MRI in Multiple-Sclerosis: Correlation between Disability and Lesion Burden. Neurology 44 (1994) 2120–2124 4. Lezak, M. D.: Neuropsychological Assessment. Oxford University Press, New York (1983) 5. Mainero, C., De Stefano, N., Iannucci, G., Sormani, M. P., Guidi, L., Federico, A., Bartolozzi, M. L., Comi, G., Filippi, M.: Correlates of MS Disability Assessed In Vivo using Aggregates of MR Quantities. Neurology 56 (2001) 1331–1334 6. Makedon, F., Wang, Y., Steinberg, T., Wishart, H., Saykin, A., Ford, J., Ye, S., Shen, L.: A System Framework for the Integration and Analysis of Multi-modal Spatiotemporal Data Streams: A Case Study in MS Lesion Analysis. First International IEEE EMBS Neural Engineering Conference (2003) 7. Nocedal, J., Wright, S. J.: Numerical Optimization. Springer Verlag, Berlin Heidelberg New York (1999) 8. Sperling, R. A., Guttmann, C. R. G., Hohol, M. J., Warfield, S. K., Jakab, M., Parente, M., Diamond, E. L., Daffner, K. R., Olek, M. J., Orav, E. J., Kikinis, R., Jolesz, F. A., Weiner, H. L.: Regional Magnetic Resonance Imaging Lesion Burden and Cognitive Function in Multiple Sclerosis - A Longitudinal Study. Archives of Neurology 58 (2001) 115–121 9. Thirion, J.-P., Calmon, G.: Deformation Analysis to Detect and Quantify Active Lesions in Three-Dimensional Medical Image Sequences. IEEE Transactions on Medical Imaging 18 (1999) 429–441 10.Tzika, A. A., Astrakas, L. G., Zarifi, M. K., Petridou, N., Poussaint, T. Y., Goumnerova, L., Zurakowski, D., Anthony, D. C., Black, P. M.: Multiparametric MR Assessment of Pediatric Brain Tumors. Neuroradiology 45 (2003) 1–10 11.Wallace, C. J., Seland, T. P., Fong, T. C.: Multiple-Sclerosis: The Impact of MR Imaging. American Journal of Roentgenology 158 (1992) 849–857