May 8, 2015 - GA] 8 May 2015. Quantifying the gas inside dust cavities in transitional disks: implications for young planets. E.F. van Dishoeck,1,2 N. van der ...
arXiv:1505.01947v1 [astro-ph.GA] 8 May 2015
Quantifying the gas inside dust cavities in transitional disks: implications for young planets E.F. van Dishoeck,1,2 N. van der Marel,1 S. Bruderer,2 , and P. Pinilla1 1 Leiden
Observatory, Leiden University, the Netherlands;
ewine@ strw.leidenuniv.nl 2 Max
Planck Institute for Extraterrestrial Physics, Garching, Germany
Abstract. ALMA observations of a small sample of transitional disks with large dust cavities observed in Cycle 0 and 1 are summarized. The gas and dust surface density structures are inferred from the continuum and 12 CO, 13 CO and C18 O line data using the DALI physical-chemical code. Thanks to its ability to self-shield, CO can survive inside dust cavities in spite of being exposed to intense UV radiation and can thus be used as a probe of the gas structure. Modeling of the existing data shows that gas is present inside the dust cavities in all cases, but at a reduced level compared with the gas surface density profile of the outer disk. The gas density decrease inside the dust cavity radius by factors of up to 104 suggests clearing by one or more planetary-mass companions. The accompanying pressure bumps naturally lead to trapping of the mmsized dust grains observed in the ALMA images.
1.
Introduction
Transitional disks with large inner dust cavities are excellent laboratories for studying disk evolution during the planet-forming stage (Brown et al. 2007, Andrews et al. 2011, Espaillat et al. 2014). Little is known about the cold molecular gas inside dust cavities, yet this gas significantly affects planet formation through gas-grain dynamics and planetary migration whereas its chemistry controls the composition of gas-giant atmospheres. Moreover, the gas surface density structure puts constraints on the origin of the cavity, in particular whether grain growth or photoevaporation can explain the data or whether a companion is needed. With its tremendous sensitivity, ALMA has opened up the possibility to directly detect and characterize the colder molecular gas inside dust cavities. In this paper, we briefly summarize the results on the gas and dust structures from our ALMA Cycle 0 and 1 observations of 4 transitional disks: Oph IRS 48 observed in Band 9 (van der Marel et al. 2013, hereafter vdM13), and SR21, HD 135344B and DoAr 44 taken in Band 7 (van der Marel et al., in prep. (vdM15b)). The spatial resolution is typically 0.20–0.25′′ , corresponding to 15 AU in radius at the distance of Ophiuchus (125 pc). We also use archival Band 9 data for the latter three sources from Pérez et al. (2014, P14), summarized in van der Marel et al. (2015; vdM15a). Data on 12 CO, 13 CO and C18 O J=6–5 and/or 3–2 isotopologs are available. These sources have been studied with CO ro-vibrational lines at infrared wavelengths as well, providing independent information of gas inside the dust gap (Pontoppidan et al. 2008). 1
2
van Dishoeck et al.
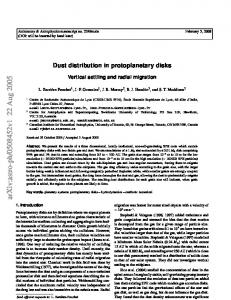
Figure 1. ALMA continuum images of 8 transitional disks; the colors are scaled to the peak emission in each image but the azimuthal contrast varies greatly from disk to disk (see text). Top: SR 21 (B9; P14), HD 135344B (B9; P14), DoAr44 (B7; vdM15b), LkCa15 (B9; vdM15a); Bottom: IRS 48 (B9; vdM15b), HD 142527 (B7; Cassasus et al. 2013), SR 24S (B9; vdM15a), J1604-2130 (B7, Zhang et al. 2014). The horizontal white bar indicates a 30 AU scale.
2.
Dust: images and models
Figure 1 presents a gallery of the millimeter-sized dust emission from a number of transitional disks to put our four sources in context. It is clear that there is a wide variety of dust structures: some souces such as DoAr44 and J1604-2130 show very symmetric (inclined) dust rings with only a ∼20% variation in brightness across the ring. Other sources such as HD 135344B and SR 21 have lopsided structures with a factor of ∼2 variation. The most extreme cases are Oph IRS 48 and HD 142527 which show highly asymmetric dust continuum emission with azimuthal contrasts of >100 and ∼30, respectively. In contrast, the small micron-sized dust grains are distributed much more symmetrically along the IRS 48 ring (Geers et al. 2007, vdM13). In general, these dust structures are well modeled by dust traps caused by a gas pressure bump in which the dust particles accumulate and grow (e.g., Barge & Sommeria 1995, Klahr & Henning 1997, Pinilla et al. 2012). One exciting possibility is that the pressure bumps are the result of planet-disk interactions and thus allow characterization of the unseen planets: the efficiency of the dust trapping (largest grain size produced) and the location of the dust depend on the orbit and mass of the companion, as well as on the turbulence in the disk. However, alternative models such as pressure bumps triggered by instabilities at the edges of dead zones have also been invoked and dust images alone cannot readily distinguish between these options (e.g., Regály et al. 2013, Flock et al. 2015). The strong azimuthal asymmetries for IRS 48 and HD 142527 can be explained by the presence of a long-lived (∼ 105 yr) vortex caused by a Rossby wave shearing instability at the steep gas density edges (e.g., Ataiee et al. 2013). Such vortices develop only under certain conditions and require low disk viscosity. Which particles get trapped in the vortices depends on their Stokes number, which in turn is tied to the local gas density.
Gas in transitional disks
3
Figure 2. Comparison of Band 7 dust (left) and gas (13 CO J=3-2, middle) images for HD135344B, together with the inferred dust and gas surface density profiles (vdM15a,vdM15b).
3.
Gas: images and models
In contrast with the dust, the gas distribution is generally much more symmetric along the ring, even for sources with extreme dust traps (Fig. 2). Moreover, gas is clearly detected inside the hole, demonstrating that gas and dust have very different distributions in these disks (e.g., Bruderer et al. 2014, P14, Zhang et al. 2014, Perez et al. 2015, vdM15a). To quantify the gas surface density, the thermo-chemical code DALI developed by Bruderer et al. (2012, 2013) is used. This code computes the dust temperature at each position in the disk through full continuum radiative transfer from UV to centimeter wavelengths, as well as the heating-cooling balance of the gas together with the chemistry. The non-LTE molecular excitation and line radiative transfer is then calculated using the gas temperature and molecular abundances as inputs and finally ray-traced to compute line images for the disk’s inclination. The baseline model assumes a parametric gas density model cf. Andrews et al. (2011), which has a small inner dust disk and a dust cavity out to rcav but no break in the gas distribution. Grain growth and settling are taken into account through a simple parametrization of the dust properties. Subsequently the amount of gas inside the dust cavity is lowered by factors of 10x , with x = 1 − 6, indicated by the parameter δgas . As shown by Bruderer (2013), CO can survive inside the dust cavities in spite of being exposed to very strong UV radiation thanks to its ability to self-shield. The modeling demonstrates that a large dynamic range in gas masses can be probed by CO with ALMA, from 10 Jupiter masses down to an Earth mass. To quantify the amount of gas, it is best to use a mix of optically thin and thick CO isotopologs. As an example of the model results, Figure 2 illustrates the best fit models for the HD 135344B disk, fitting both the gas and dust images as well as the spectral energy distribution. The gas surface density profile is inferred to drop by 4 orders of magnitude at a cavity radius rcav,gas =30 AU, which is somewhat smaller than the dust cavity radius at 40 AU. The dust density drops by an even larger factor of > 104 at 40 AU. With the current spatial resolution, there is some model degeneracy between gas cavity size and value of δgas : a larger gas cavity size would imply a shallower drop.
4
van Dishoeck et al.
Similar results are found for the other disks in our sample: in all cases a drop in the gas density of a factor of 10–100 is found based on 12 CO data (vdM15a) and a deeper drop is inferred from the CO isotopologs (vdM15b). The fact that gas is still present inside the gaps but at a lower level rules out photoevaporation and grain growth as the main mechanisms for producing the dust cavities and point to clearing of the cavity by one or more Jovian mass companions. The large gas drops are also incompatible with pressure bumps due to instabilities at dead zone edges as the only cause of the observed dust traps (Lyra et al. 2015). Modest gas density drops of a factor of 10–100 would suggest that any embedded planets are unlikely to be more massive than 1–2 Jupiter masses, and then only for a high disk viscosity (Pinilla et al. 2012, vdM15a). The deeper drops inferred from the CO isotopologs do not allow to put strong constraints on the characteristics of the embedded planets unless independent information on the disk viscosity is available. The deep drop inferred for IRS 48 together with the vortex scenario for the azimuthal dust trap (which requires low viscosity) points to a massive 10–15 MJup planet in this case. These data and analyses illustrate the diversity of transitional disk systems and the potential of ALMA data to infer the characteristics of embedded planets. While none of the models are unique, the combination of gas and dust data can rule out certain scenarios. Higher angular resolution ALMA data at ∼ 0.05′′ resolution of CO isotopologs are clearly needed to spatially resolve the gaps and quantify the location, depth and sharpness of the gas drops, which will be a crucial step to further pin down the models. Acknowledgments. The authors are grateful to K. Dullemond, T. Birnstiel, T. van Kempen, L. Pérez, A. Isella, J. Brown, K. Pontoppidan, V. Geers, G. Herczeg, G. Mathews and S. Andrews for collaborations on these sources. This work is supported by A-ERC grant 291141 CHEMPLAN, the KNAW and NOVA. References Andrews, S.M., et al. 2011, ApJ, 732, 42 Ataiee, S., et al. 2013, A&A, 553, L3 Barge, P., Sommeria, J. 1995, A&A, 295, L1 Brown, J.M., et al. 2007, ApJ, 664, L107 Bruderer, S. 2013, A&A, 559, A46 Bruderer, S., et al. 2012, A&A, 541, A91 Bruderer, S., et al. 2014, A&A, 562, A26 Cassasus, S., et al. 2013, Nature, 493, 191 Espaillat, C., et al. 2014, Protostars & Planets VI, p. 497 Flock, M., et al. 2015, A&A, 574, A68 Geers, V.C., et al. 2007, A&A, 469, L35 Klahr, H., Henning, Th. 1997, Icarus, 128, 213 Lyra, W., Turner, N.J., McNally, C.P. 2015, A&A, 574, A10 Pérez, L., et al. 2014, ApJ, 783, L13 Perez, S., et al. 2015, ApJ, 798, 85 Pinilla, P., et al. 2012, A&A, 545, A81 Pontoppidan, K.M., et al. 2008, ApJ, 684, 1323 Regály, Zs., et al. 2013, MNRAS, 433, 2626 van der Marel, N., et al. 2013, Science, 340, 1199 van der Marel, N., et al. 2015a, A&A, in press van der Marel, N., et al. 2015b, in prep. Zhang, K., et al. 2014, ApJ, 791, 42