Quantifying the robustness of optimal reservoir operation for the. Xinanjiang-Fuchunjiang Reservoir Cascade. E. Vonk*, Y.P. Xu**, M.J. Booij***, D.C.M. ...
Quantifying the robustness of optimal reservoir operation for the Xinanjiang-Fuchunjiang Reservoir Cascade E. Vonk*, Y.P. Xu**, M.J. Booij***, D.C.M. Augustijn*** * ** ***
KWR Watercycle Research Institute, P.O. Box 1072, 3430 BB, Nieuwegein, The Netherlands Institute of Hydrology and Water Resources, Zhejiang University, Hangzhou 310058, China Twente Water Centre, University of Twente, P.O. Box 217, 7522 NB, Enschede, The Netherlands
Abstract: In this research we investigate the robustness of the common Implicit Stochastic Optimization (ISO) method for dam reoperation. As a case study, we focus on the XinanjiangFuchunjiang reservoir cascade, for which adapted operating rules were proposed as a means to reduce the impact of climate change and socio-economic developments. The optimizations were based on five different water supply and demand scenarios for the future period from 2011 to 2040. Main uncertainties in the optimization can be traced back to correctness of the assumed supply and demand scenarios and the quality and tuning of the applied optimization algorithm. To investigate the robustness of proposed operation rules, we (1) compare cross-scenario performance of all obtained Pareto-optimal rulesets and (2) investigate whether different metaheuristic optimization algorithms lead to the same results. For the latter we compare the originally used genetic algorithm (NSGA-II) with a particle swarm optimization algorithm (MOPSO). Reservoir performance was measured using the Shortage Index (SI) and Mean Annual Energy Production (MAEP) as main indicators. It is found that optimal operating rules, tailored to a specific scenario, deliver at most 2.4% less hydropower when applied to a different scenario, while the SI increases at most with 0.28. NSGA-II and MOPSO are shown to yield approximately the same Pareto-front for all scenarios, even though small differences can be observed. Keywords: multireservoir operation; scenario analysis; optimization; robustness; MOPSO; NSGA-II
Introduction There is currently a lot of attention from the scientific community to explore new methods for optimizing the long-term operation of reservoir systems (Labadie, 2004). Optimization of reservoirs (and in particular multireservoir systems) is traditionally a complicated process with high computational requirements. However, recent developments have led to computationally efficient Metaheuristic Algorithms (MAs) that are able to optimize multireservoir systems in an integrated way. These algorithms have been applied successfully to reservoir systems with various configurations, often resulting in better operating rules than the ones currently being used (Rani and Moreira, 2010; Reddy and Kumar, 2007). However, despite large attention of the scientific community towards the development of efficient optimization algorithms, relatively little is known about the actual robustness of optimization results and methodologies. Labadie (2004) argued for example that many optimization models are currently not conducive to incorporating the involved risks and uncertainties and that the enormous range and varieties of optimization methods create confusion as to which to select for a particular application. Furthermore, the commonly used Implicit Stochastic Optimization (ISO) methodology, which is actually a deterministic technique using long representative time series to account for variability in supply and demand (Rani and Moreira, 2010), yields only optimal results for the period considered in the optimization. Whenever the so called ISO methodology is used for reservoir optimization, its outcomes are typically subjected to two major sources of uncertainty. A first source is the long-term inflow and demand records that are typically used as input for the
optimization process. Using such records requires the assumption of hydrological and socio-economic stationarity, or at least assumes a certain development trajectory for future inflow patterns and water demand. The question arises how optimized operating rules perform in cases where the real inflow and demand patterns appear to deviate from the assumed patterns used for optimization. A second source of uncertainty is related to the quality of the MA that is being used for the optimization. Despite the great potential of metaheuristics reported in literature, many authors mention the risks of premature convergence and termination of such algorithms in local optima (Chang and Chang, 2001; Fu et al, 2011). In this study we attempt to gain more insight in the robustness aspect of ISO dam reoperation methods, thereby considering the following questions: 1. How sensitive are optimized operating rules with respect to unexpected deviations from the projected reservoir inflow and water demand? 2. How sensitive are optimization results to the type of optimization algorithm? We investigate these two questions for the Xinanjiang-Fuchunjiang reservoir cascade, a multireservoir system located in Hangzhou Region, China. In a previous study (Vonk et al., 2014) we have studied the adjustment of reservoir operating rules as an adaptation strategy for future socio-economic developments and climate change in this region. Here, we will specifically focus on the robustness of the obtained results. Case study Hangzhou Region is located in Zhejiang Province (eastern China). It is a region covering about 16,850 km2, containing a metropolitan area, commonly referred to as the Hangzhou urban districts, and 5 other districts: Fuyang City, Tonglu County, Lin’an City, Jiande City and Chun’an County. The investigated part of Hangzhou Region is located in the Qiantang River Basin.
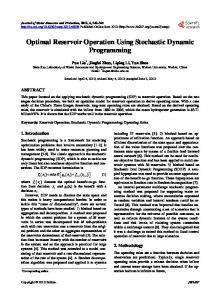
Figure 1 Water system diagram of Hangzhou Region. The five demand districts are represented by a circle. Lin’an City is not included as it does not obtain its water from the river system.
Qiantang River has several large tributaries. The largest upstream branches, Xin’an River and Lan River, confluence in the center of the catchment and continue as Fuchun River (Figure 1). At the mouth of the river, in Hangzhou Bay, the average discharge is 1043 m3s−1. The discharge regime is characterized by a high flow period between April and July and low flows in the remaining months.
Hangzhou Region predominantly relies on surface water from Qiantang River for its supply. Water is abstracted directly from the river through various intakes. Only exception is the district Lin’an City, where groundwater is used. Two cascaded reservoirs regulate the water supply: Xinanjiang Reservoir upstream and Fuchunjiang Reservoir further downstream (Figure 2). The water supply purpose of these reservoirs competes with the currently higher prioritized flood control and hydropower generation purposes. The reservoir system is particularly suitable for our study as the surrounding region currently faces rapid population growth and economic development. These developments, in combination with climate change effects, cause an increasing stress on the water availability. Furthermore, all data relevant for this study have been monitored for an extensive period and are available for analysis.
Figure 2 Xinanjiang Reservoir (left) and Fuchunjiang Reservoir (right).
Material and Methods We used a scenario-based approach to explore the effects of various likely degrees of water stress for the future period between 2011 and 2040. Water demand was estimated by considering three underlying socio-economic drivers: rural and urban population growth, industrial production and changing land use. Climate change is considered as underlying process influencing the supply side. Projected streamflows for the future period were simulated using the GR4J rainfall-runoff model (Perrin et al., 2003). We obtained input for the hydrological simulations by dynamic downscaling of global climate simulations. The HadRM3P Regional Climate Model was employed, driven by the HadCM3 Global Circulation Model (Gordon et al., 2000). We evaluated the A2, A1B and B2 SRES greenhouse gas emission scenarios, resulting in a small, medium and large decrease of inflow to the study area, respectively. The inflow projections were combined with low, moderate and high socio-economic growth projections for water demand, resulting in five water stress scenarios: Low (L), Moderate 1 (M1), Average (A), Moderate 2 (M2) and High (H). Scenario impacts were simulated with the WEAP water allocation model (SEI, 2014). This model was calibrated on 10-day historical storage volumes of Xinanjiang Reservoir, 10-day releases of Fuchunjiang Reservoir and monthly hydropower production of both reservoirs for the period 1981–1990. The period 1991–2000 was selected for validation. Calibration parameters were the coefficients of the hydropower production rules. The Nash Sutcliffe Model Efficiency (NSE) for the discharge downstream of Fuchunjiang Reservoir was 0.98 for the calibration period and 0.93 for the validation period. The NSE for the reservoir storage was 0.81 and 0.93 for calibration and validation, respectively. The relative error between the observed and simulated Mean Annual Energy Production (MAEP) for the calibration period was +0.5% and for the validation period +5.4%.
To derive optimal operating rules that are adapted to the various scenarios, the WEAP model was interlinked with an external optimization module (Figure 3). In the first step of this research, the Nondominated Sorting Genetic Algorithm II (NSGA-II), as proposed by Deb et al. (2002), was employed as optimization module. As this is a multiobjective optimization algorithm, it yields a set of Pareto-optimal operating rules for each scenario. Like other genetic algorithms, NSGA-II uses crossovers and mutations to improve candidate solutions iteratively. The algorithm features a so called crowding distance operator to obtain an equal spreading of solutions along the Pareto-front. NSGA-II also maintains an external repository (the elitist archive) in which the fittest candidate solutions of each iteration are stored and directly injected into the next one. We used binary tournament selection, Gaussian mutation and intermediate crossover as main settings. A real-coded scheme was used, with a mutation rate of 0.05 and crossover probability of 0.85, as recommended by Li and Wei (2008). The population size was set to 100 individuals, with 100 iterations as stopping criterion. Decision variables for optimization were the coefficients of proposed linear hydropower production rules for each of the two reservoirs in the cascade, discriminating between four seasons (in total 24 target parameters). Reservoir performance was optimized by minimizing the Shortage Index (SI), as defined by the US Army Corps of Engineers (1997), and maximizing the Mean Annual Energy Production (MAEP). In mathematical form the optimization problem can be stated as: min( ) = min
Subject to:
max(
〈 , ,
100
) = max 〉=
1
(1) (
)
(2)
( , ,
)
(3)
In these equations is the number of years in the considered study period, is the total shortage (deficit) in the th year (water demand minus actual volume supplied) and is the total demand in the th year. The Mean Annual Energy Production ( ) and Annual Energy Production ( ) are both in GWh. The indicators are subject to the constraints included in the WEAP model, which simulates with a 10day timestep . This model is based on three inputs: , , and being the water demand, inflow and operating rules in the th 10-day period, respectively. After deriving a front of Pareto-optimal solutions for each scenario using NSGA-II, we investigated the sensitivity of optimized rulesets by evaluating their cross-scenario performance. We have taken the Pareto-optimal ruleset of each scenario and evaluated how it performed in the other four scenarios. By computing the average and maximum performance difference between the cross-tested rulesets and the Paretooptimal ruleset for each scenario, we get an indication of the sensitivity of rulesets to the water demand and inflow projections. To identify possible variations in the results due to inefficiencies of the optimization algorithm, we also applied a Multi-Objective Particle Swarm Optimization (MOPSO) algorithm (Coello Coello et al., 2004) to the same problem and compared the results to those originally obtained with NSGA-II. Particle Swarm Optimization (PSO) is inspired by the movement of social groups such as birds and fish. This social behaviour is modelled in PSO to guide a population of particles (the swarm) towards the most promising regions of the search space. As
such, each particle is the representation of a candidate solution in the form of a row vector with decision variables. Each particle within a swarm is characterized by (a) its current position in the search space (determined by the solution it currently represents), (b) its velocity (position change) and (c) its personal best position visited so far (pBest).The position of each particle is updated by changing its velocity according to its own experience and that of its neighbours (Reyes-Sierra & Coello Coello, 2006). The updating involves three tuneable parameters: the inertia weight (which controls the influence of a particle’s previous velocity), a cognitive learning factor (representing the attraction that a particle has towards its own success) and a social learning factor (representing the attraction that a particle has towards the success of its neighbours). The MOPSO algorithm maintains an external repository to store all nondominated solutions discovered so far in the optimization process. MOPSO has already been applied to the Three Gorges cascade reservoirs by Yang et al. (2009), who showed that the algorithm found solutions with good diversity and consistent convergence. To investigate how MOPSO compares to NSGA-II in terms of quality of the obtained results, we also apply this algorithm to the XinanjiangFuchunjiang reservoir system. Similar to the settings of NSGA-II, a swarm size of 100 particles is used, with 100 iterations as stopping criterion. Following Reddy & Kumar (2007), an inertia weight of 1.0 was used, with a personal learning coefficient of 1.0, global learning coefficient of 0.5 and the constriction coefficient set at 0.9.
Figure 3 General setup of the ISO methodology. The optimization algorithms are interlinked with a water allocation model (WEAP), which in turn depends on the outcomes of a scenario analysis for long-term water supply and demand time series.
Results and Discussion For the investigated Xinanjiang-Fuchunjiang reservoir cascade, a re-optimization of the long-term operating rules appeared to be an effective strategy for reducing the potential impacts of climate change and regional socio-economic developments. As described in Vonk et al. (2014), adapted operating rules on average reduce the SI from 0.36 to 0.06 and increase the MAEP with 6.4% (compared to the projected future performance of conventional operation). Cross-scenario performance of the derived solutions is shown in Table 1 and Table 2. It becomes clear that the hydropower production (MAEP) is not very sensitive to
deviations from projected inflow and demand. A wrong assumption for future reservoir inflow and demand patterns would in the worst case result in 2.4% less energy production (which occurs when the Pareto-optimal ruleset of scenario M2 is applied to scenario L). Interestingly, in many cases the overall energy production of cross-tested rulesets is higher than the applicable Pareto-optimal set. In each of these cases, the high energy production goes hand in hand with more severe water shortages (higher mean SI), indicating that these rules force releasing of water that should actually be preserved for periods of drought. The largest observed increase in SI is 0.28 (occurring when the rulesets optimized to scenario M2 are applied to scenario H). Yet, in all cases the cross-tested rulesets are still performing better than the conventional operating rules. Figure 4a illustrates the obtained results for scenario H. The reason why the operating rules can be considered rather insensitive to the supply and demand projections may be due to the one part that all scenarios have in common: each combination of socio-economic developments and climate change results in a future trend of increasing water demand and decreasing water availability. The main difference between the scenarios is the specific magnitude of this trend. Table 1 Performance of Pareto-optimal rulesets and conventional operation in alternative scenarios, in terms of water shortages. The cross-scenario performance is determined by taking both the average and worst SI of all solutions in the evaluated ruleset. Absolute differences with the Pareto-optimal ruleset for each scenario are shown between parentheses. Mean and worst cross-performance in scenario (SI, dimensionless): L
M1
A
M2
H
0.00 0.00
0.06 (+0.05) 0.16 (+0.13)
0.06 (+0.06) 0.12 (+0.09)
0.14 (+0.06) 0.21 (+0.02)
0.36 (+0.18) 0.57 (+0.27)
0.00 (0) 0.01 (+0.01) 0.00 (0) 0.00 (0)
0.01 0.03 0.02 (+0.01) 0.02 (-0.01)
0.04 (+0.04) 0.07 (+0.04) 0.00 0.03
0.13 (+0.05) 0.18 (+0.00) 0.09 (+0.01) 0.12 (-0.06)
0.28 (+0.10) 0.36 (+0.06)
0.00 (0) 0.01 (0.01) 0.01 (+0.01) 0.02 (+0.02)
0.05 (+0.04) 0.18 (+0.15) 0.02 (+0.01) 0.05 (+0.02)
0.04 (+0.04) 0.11 (+0.08) 0.05 (+0.05) 0.13 (+0.10)
0.08 0.18 0.11 (+0.03) 0.19 (+0.01)
0.35 (+0.17) 0.58 (+0.28) 0.18 0.30
0.05 (+0.05)
0.19 (+0.18)
0.18 (+0.18)
0.47 (+0.39)
0.92 (+0.74)
Optimal ruleset:
L M1 A M2 H Conventional
0.24 (+0.06) 0.29 (-0.01)
Table 2 Performance of Pareto-optimal rulesets and conventional operation in alternative scenarios, in terms of hydropower production. The cross-scenario performance is determined by taking the average and worst MAEP of all solutions in the evaluated ruleset. Relative differences with the Pareto-optimal ruleset for each scenario are shown between parentheses. Mean and worst cross-performance in scenario (MAEP, in GWh): L
Optimal ruleset:
L M1 A M2 H Conventional
M1
A
M2
H
2383 2350 2376 (-0.3%) 2319 (-1.3%)
2427 (+0.1%) 2398 (+3.1%) 2424 2326
2357 (+0.1%) 2341 (+1.2%) 2349 (-0.26%) 2289 (-1.0%)
2346 (+0.8%) 2316 (+2.5%) 2339 (+0.5%) 2283 (+1.0%)
2406 (+0.5%) 2379 (+2.9%) 2395 (+0.1%) 2293 (-0.9%)
2355 (-1.2%) 2325 (-1.1%) 2362 (-0.9%) 2293 (-2.4%)
2398 (-1.1%) 2350 (+1.1%) 2406 (-0.8%) 2302 (-1.0%)
2355 2312 2350 (-0.2%) 2283 (-1.3%)
2319 (-0.4%) 2289 (+1.3%) 2327 2260
2381 (-0.5%) 2331 (+0.8%)
2358 (-1.0%) 2309 (-1.8%) 2243 (-5.9%)
2410 (-0.6%) 2326 (+0.0%) 2286 (-5.7%)
2351 (-0.2%) 2290 (-0.9%) 2196 (-6.8%)
2320 (-0.3%) 2261 (+0.0%) 2230 (-4.2%)
2393 2313 2266 (-5.3%)
2387 (-0.3%) 2295 (-0.8%)
Table 3 Performance of MOPSO, relative to NSGA-II. The differences in solution sets are shown with respect to their best, mean and worst performance on each objective. As all solutions within a set are nondominated, the solution having the worst performance on one objective typically performs best on the other objective. A negative performance difference for the SI means that the solutions of MOPSO result in less water shortages, while a negative performance difference for the MAEP indicates lower hydropower production than NSGA-II. Scenario L SI [-]
MAEP [GWh]
M1
A
M2
H
Best
0.00
0.00
0.01
-0.01
0.01
Mean
0.00
0.00
0.02
-0.01
0.01
Worst
-0.01
0.04
0.04
-0.03
0.04
Best
-5 (-0.2%)
5 (+0.2%)
12 (+0.5%)
0 (0.0%)
-7 (-0.3%)
Mean
11 (+0.4%)
14 (+0.6%)
25 (+1.0%)
-4 (-0.2%)
-20 (-0.8%)
Worst
38 (+1.6%)
64 (+2.8%)
27 (+1.2%)
-32 (-1.4%)
-15 (-0.7%)
In Table 3 it is shown that, when applying MOPSO to the same optimization problem, deviations from the Pareto-fronts found with NSGA-II are relatively small. The mean performance difference of the solution sets is between -0.8% and +1.0% for the MAEP and between -0.01 and +0.02 for the SI. However, in particular on the edges of the Pareto-fronts, there are larger differences in performance. MOPSO was able to discover somewhat better solutions on one edge of the Pareto-front for scenario L. The solutions on the Pareto-front edges of scenarios M1 and A both yield more energy production and lead to increasing water shortages. This shows that MOPSO found a more elongated front for these scenarios. NSGA-II performs slightly better for scenarios M2 and H. Figure 4b illustrates this for scenario H. The general observation that in all scenarios both algorithms converge to approximately the same optimum raises confidence in their robustness for practical application to reservoir optimization problems.
Figure 4 (a) Cross-scenario performance of different optimized rulesets, applied to scenario H (optimized with NSGA-II). (b) Comparison of Pareto-fronts identified with NSGA-II and MOPSO, also for scenario H.
Conclusions For the investigated water stress scenarios, adapted operating rules on average reduce the SI of this reservoir system from 0.36 to 0.06 and increase the MAEP with 6.4% (compared to the projected future performance of conventional reservoir operation). Robustness of these results was evaluated by comparing the cross-scenario
performance of all optimized rulesets and by comparing the results of one optimization technique (NSGA-II) with another (MOPSO). Operating rules that are optimized to a specific inflow and demand scenario are shown to deliver at most 2.4% less energy production when being applied in any other of the considered scenarios. Similarly for the SI, a maximum increase of 0.28 was observed. Yet, for any scenario the potential performance losses are much smaller than the initial performance gain that was achieved by changing from conventional to the proposed adapted operation. As the investigated scenarios represent a wide range of potential socio-economic developments and climate change projections, it can be stated that the adapted reservoir operating rules can be regarded as quite robust. This robustness is likely to be the result of the one aspect that all considered scenarios have in common: all combinations of likely socio-economic developments and climate change projections result in more future water stress compared to the past, with just the exact severity as distinctive difference. Even though often mentioned in literature as a potential drawback, the optimization algorithms themselves prove to deliver robust and consistent results, with only minor differences in performance. NSGA-II and MOPSO both consistently lead to similar solutions, raising confidence that they indeed closely approximate the true global optimum as outcome. References Chang, L.C. and Chang, F.J. (2001). Intelligent control for modelling of real-time reservoir operation. Hydrological Processes, 15, 1621-1634. Coello Coello, C.A., Pulido, G.T. and Lechuga, M.S. (2004). Handling Multiple Objectives With Particle Swarm Optimization. IEEE Transactions on Evolutionary Computation, 8, 256-279. Deb, K., Pratap, A., Agarwal, S. and Meyarivan, T. (2002). A fast and elitist multiobjective genetic algorithm: NSGA-II. IEEE Transactions on Evolutionary Computation, 6, 182-197. Fu, X., Li, A., Wang, L. and Ji, C. (2011). Short-term scheduling of cascade reservoirs using an immune algorithm-based particle swarm optimization. Computers and Mathematics with Applications, 62, 2463-2471. Gordon, C., Cooper, C., Senior, A., Banks, H., Gregory, J.M., Johns, T.C., Mitchell, J.F.B. and Wood, R.A. (2000). The simulation of SST, sea ice extents and ocean heat transports in a version of the Hadley Centre coupled model without flux adjustments. Climate Dynamics, 6, 147-168. Labadie, J.W. (2004). Optimal operation of multireservoir systems: state-of-the-art review. Journal of Water Resources Planning and Management, 130, 93-112. Li, X. and Wei, X. (2008). An Improved Genetic Algorithm-Simulated Annealing Hybrid Algorithm for the Optimization of Multiple Reservoirs. Water Resources Management, 22, 1031-1049. Perrin, C., Michel, C., and Andréassian, V. (2003). Improvement of a parsimonious model for streamflow simulation. Journal of Hydrology, 279, 275-289. Rani, D. and Moreira, M. (2010). Simulation-Optimization Modeling: A Survey and Potential Application in Reservoir Systems Operation. Water Resources Management, 24:1107–1138. Reddy, M.J. and Kumar, D.N. (2007). Multi-objective particle swarm optimization for generating optimal trade-offs in reservoir operation. Hydrological Processes, 21, 2897-2909. Reyes-Sierra, M. and Coello Coello, C.A. (2006). Multi-Objective Particle Swarm Optimizers: A Survey of the State-of-the-Art. International Journal of Computational Intelligence Research, 2, 287308. SEI (2014). WEAP: Water Evaluation And Planning system. http://www.sei-international.org/weapthe-water-evaluation-and-planning-system. Accessed 22 January 2014. US Army Corps of Engineers (1997). Hydrologic Engineering Requirements for Reservoirs. http://publications.usace.army.mil. Accessed 5 May 2012. Vonk, E., Xu, Y.P., Booij, M.J., Zhang, X., Augustijn, D.C.M. (2014). Adapting Multireservoir Operation to Shifting Patterns of Water Supply and Demand. Water Resources Management, 28, 625-643. Yang, J., Zhou, J., Liu, L. and Li, Y. (2009). A novel strategy of pareto-optimal solution searching in multi-objective particle swarm optimization (MOPSO). Computers and Mathematics with Applications, 57, 1995-2000.