35. Sorologia (IgM) Chikungunya. 1 - Reagente 2 - Não Reagente 3 -. Inconclusivo 4 - Não Realizado. RT-PCR. Resultado. 43. Resultado. 44. Data da Coleta.
Quantifying the spatial spread of dengue in a non-endemic Brazilian metropolis via transmission chains reconstruction Guzzetta et al.
Supplementary Information
1
Supplementary Methods Here we describe the transmission model used for transmission chains reconstruction. We assume that, at any time t, susceptible individuals are exposed to a force of infection 𝜆" (𝑡) = ' 𝜆(" (𝑡) = ' 𝛽𝐾(𝑑"( ; 𝜂)Γ(𝑡 − 𝐸( ; 𝑎, 𝑏) (∈+(,)
(∈+(,)
where N(t) is the set of individuals who have been infected before time t and 𝛽 is the disease transmission rate. 𝐾8𝑑"( ; 𝜂9 = 𝜂𝑒 ;? is the spatial kernel regulating the probability of transmission at a distance 𝑑"( between individuals j and i. The kernel’s “characteristic distance” is defined as 1/𝜂. 𝐸( is the time of infection of individual i and Γ(𝑡; 𝑎, 𝑏) is the gamma-distributed generation time, with shape parameter a and rate parameter b. The generation time accounts for the length of incubation period in both humans and mosquitoes (intrinsic and extrinsic incubation periods), duration of human infectiousness and lifespan of mosquitoes. In the time interval [𝑡, 𝑡 + Δ𝑡], susceptible individuals get infected with probability 𝑝" (𝑡) = 1 − 𝑒 G> (,) H, , and have a constant probability α to be a dengue case imported in the study area. Here we describe the parameter estimation procedures. For each set of free parameters 𝜃 = {𝛼, 𝛽, 𝜂, 𝑎, 𝑏}, we reconstruct the transmission chain by sampling, for each case j, among all infected individuals i such that 𝐸" − 𝐸( is in the 99% percentile of Γ(𝑡; 𝑎, 𝑏), a likely infector 𝑘" with probability proportional to 𝛽𝐾8𝑑"( ; 𝜂9; the case that j was imported was considered by including the probability of importation α as the transmission probability of an additional candidate infector [1]. The likelihood of the transmission chain given parameter set 𝜃 will be given by: 𝐿(𝜃) = O 𝑃8𝑗, 𝑘" 9 𝑄8𝐸" 9 "
where
𝛼 if 𝑗 is imported 𝑃8𝑗, 𝑘" 9 = S 𝜆 (E ) if 𝑗 has been infected by 𝑘 ; "^> " " 𝜆(^> represents the likelihood of having been infected by individual 𝑘" , while 𝛼 represents the likelihood of importation; 𝑄8𝐸" 9 is the likelihood that j has not been infected nor imported before time 𝐸" , namely: i>
𝑄8𝐸" 9 = exp g− h 𝛼 + 𝜆" (𝑡) 𝑑𝑡k j
Time 0 was set at November 1st, 2013, i.e. the first day of the first epidemiological year in the dataset. We estimated unknown parameters defined by vector 𝜽 = {𝛼, 𝛽, 𝜂, 𝑎, 𝑏} with a Markov Chain Monte Carlo procedure based on uninformative priors for all parameters (Supplementary Table 1) and random-walk Metropolis-Hastings sampling with reversible jumps from normal distributions. The starting point for parameter values was selected by running 10,000 runs with values sampled from the prior uniform distributions (Supplementary Table 1) and accepted with a maximum likelihood criterion. This procedure was used to choose an initial parameter set with likelihood numerically strictly greater than 0. A new parameter set 𝜽𝐧𝐞𝐰 was proposed by adding to the last accepted parameter set 𝜽𝐨𝐥𝐝 a vector of samples from normal distributions with mean zero and standard deviations s (Supplementary Table 1); for
2
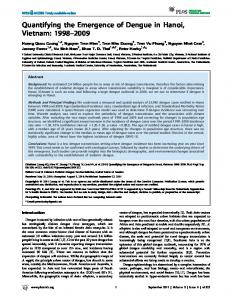
each parameter 𝜗 ∈ 𝜽 a new value was proposed as 𝜗tuv = 𝜗wx= + 𝑁(0, 𝜎|} ). 𝜽𝒏𝒆𝒘 was accepted depending on the likelihood of its reconstructed chain with probability equal to: 𝐿(𝜽𝐧𝐞𝐰 ) 𝜋 = min g1, k 𝐿(𝜽𝐨𝐥𝐝 ) In our datasets, the time of symptom onset and the geographic location of all considered cases are known, but not the times of infection 𝑬 = {𝐸" }" . The above described procedure could be used to estimate model parameters only if infection times E were known. A standard approach is to consider infection times E as nuisance parameters to be estimated together with model parameters (for instance by using an independence sampler for sampling proposal infection times) and use data augmentation techniques to incorporate these missing data [13]. In principle, all infection times E should be updated at each MCMC step. Previous studies have suggested a two-stepped optimization of nuisance parameters and model parameters within the Markov Chains [1,2]; in some cases, only a subset of values of E are updated at each optimization step [3]. Here, we propose a different approach that is more scalable with larger sample sizes as it does not require to control a large number of nuisance parameters. We created 2,000 augmented data sets where, for each case j, we randomly sampled an incubation period tj between 3 and 10 days from a uniform distribution [4] and imputed the value of Ej by subtracting the sampled tj from the observed time of symptoms onset. Model calibration was run over each augmented dataset, using 100,000 MCMC iterations, of which only the final 10,000 were kept to ensure convergence of the algorithm. Results from the 2,000 Markov Chains were pooled together, obtaining 20,000,000 total samples for the posterior distributions. Finally, a transmission chain was considered in the analysis for each accepted parameter set. The great computational advantage of the proposed method is that the 2,000 Markov Chain can be computed in parallel. As shown in Supplementary Figure 1, the posterior distributions of model parameters stabilize when pooling together more than 300 randomly sampled Markov Chains. This result shows that 2,000 Markov Chains are sufficient to account for uncertainty on infection times E in estimating the posterior distributions of model parameters. The proposed method is demonstrated on synthetic data sets (see below).
number of pooled chains
number of pooled chains
number of pooled chains
2000
1000
1500
300
250
200
150
6 5 4 3 2 1 0
100
300
250
200
150
b
a 300
250
300
250
200
150
100
1
number of pooled chains
200
0
150
0
100
1
0
50
300
250
200
150
100
1
50
0
1
2
2
50
4
10
20
2
3
6
100
8
30
1
40
4
50
10
η (x 10-3)
4
50
500
1
2000
1500
1000
5
β
α (x 10-4)
8 6
number of pooled chains
number of pooled chains
number of pooled chains
number of pooled chains
b
a 1
0
2000
1500
500
1
0
6 5 4 3 2 1 0
1
number of pooled chains
1000
1
2000
1500
500
1000
1
0
2
2
1
10
0
4
2000
2
3
6
1500
20
1000
30
4
500
40
8
500
4
10
η (x 10-3)
6
50
50
5
β
α (x 10-4)
8
number of pooled chains
Supplementary Figure 1. Mean (brown lines) and 95%CI (green lines) of posterior distributions of model parameters as obtained by pooling together an increasing number of Markov Chains (the final 10,000 steps only were considered) randomly sampled among the 2,000 Markov Chains computed in parallel. The sampling procedure is repeated 1,000 times. Panels in the bottom row show the same results in the top row panels, but for a maximum number of pooled Markov Chains set to 300.
3
Parameter
Prior distribution
a b h
Uniform(0, 1) Uniform(0, 1000) Uniform(0, 1) Uniform(0, 100) Uniform(0, 100)
a b
MCMC s 10-5 1 10-4 0.1 0.1
Posterior distribution: mean (95%CI) 5.36 (3.87 – 6.68) 10-4 47.6 (44.6 - 50.4) 7.86 (5.75 – 10.0) 10-3 3.44 (2.95 – 4.05) 5.12 (4.56 - 5.66)
Unit days-1 days-1 m-1 -
Supplementary Table 1. Prior distributions, standard deviations of normal jumps and posterior distribution for model parameters
Supplementary Table 1 shows the posterior mean and 95% confidence intervals for all parameters, while Supplementary Figure 2 represents the resulting probability distribution functions for the generation time and the spatial kernel.
a) b) Supplementary Figure 2. a) Probability distribution of the generation time and b) spatial kernel, computed from the posterior distributions of parameters. Dark line: average; shaded area: 95% credible intervals. Boxplots below the zero line show for comparison the mean, inter-quantile range and 95% credible interval of the generation time and transmission distance in the reconstructed transmission chains.
Here we describe the procedures for computing reproduction numbers. To estimate the instantaneous reproduction number 𝑅, we approximate the number of locally transmitted cases over time with the renewal equation: ‰
C(t) − A(t) = Pois ‡R ‰ ' C(t − s)Γ(s; a, b)•, Š‹Œ
where C(t) is the total number of cases with symptom onset at time t, A(t) is the number of imported cases with symptom onset at time t, and Γ is the generation time distribution, with shape and scale parameters 𝑎 and 𝑏 sampled from the posterior distribution estimated by the model for the reconstruction of transmission chains. The likelihood is therefore: ‰
𝐿 = O 𝑝 ‡𝐶(𝑡) − 𝐴(𝑡), R ‰ ' C(t − s)Γ(s; a, b)•. ,•Œ
Š‹Œ
where p(k,λ) is the probability mass function of a Poisson distribution (i.e. the probability of observing k events if these events occur with a known rate λ). We estimated mean and 95% credible intervals of 𝑅, by the same MCMC procedure described above. We run 100,000 MCMC iterations to identify the posterior distributions of 𝑅, , assuming prior uniform distribution, namely Uniform(0,10), using a constant value of 0.1 for the standard deviations of the normal jumps, and we kept the last 10,000 iterations to ensure convergence of the 4
algorithm. We considered A(t) as the number of cases classified as imported in more than 50% of the reconstructed transmission chains. We also computed the effective reproductive number Re over time from the reconstructed transmission chains as the average number of secondary cases caused by individuals who had symptom onset during a moving window of one month. While 𝑅u depends on all the characteristics of the reconstructed transmission chains, 𝑅, depends only on estimates of the generation time and information on the number of imported cases over time. Here we describe the generation of synthetic data used for validating the procedures for reconstructing the transmission chains. We tested our transmission chain reconstruction model on synthetic data obtained from the simulation of a stochastic transmission model with known structure and parameters. In the transmission model, susceptible individuals become exposed within a given time interval [𝑡, 𝑡 + Δ𝑡] with a probability 𝑝( (𝑡) = 1 − 𝑒 G? (,) H, , where 𝜆( (𝑡) is a time-dependent force of infection: +
𝜆( (𝑡) = 𝛽 (𝑡) ' 𝐼" 𝐾(𝑑(" , 𝜂) • • • •
"‹Œ
”‰
𝛽(𝑡) = 𝛽j |sin (•–—)| is a time-varying transmission rate and t is the simulation day;
N is the total population; Ij is 1 if the individual is infectious and 0 otherwise 𝐾8𝑑(" , 𝜂9 = 𝜂𝑒 ; is a spatial kernel regulating the probability of transmission at a distance dij via parameter 𝜂. We term 1/𝜂 the “characteristic distance” of the kernel.
When an individual is exposed, his infector is chosen among the set of individuals who are infectious at that time with a probability proportional to 𝐾8𝑑(" , 𝜂9. The natural history of disease in individuals follows an SE2I2R model [5], where the total incubation time TE of exposed individuals is given by the sum of two times TE1 and TE2, each sampled from an exponential distribution with mean 7 days; similarly, the total infectious period TI is given by the sum of two times TI1 and TI2, each sampled from an exponential distribution with mean 3 days. In this way, TE and TI are approximated by two gamma distributions: G ˜™ (2,7) and G ˜œ (2,3) with means of 14 and 6 days respectively [4]. The theoretical average generation • time in a homogeneous mixing SE2I2R model is 𝑇Ÿ = 𝑇Ÿ¡ + 𝑇Ÿ£ [5], so that 𝑇Ÿ = 18.5 days. ¢
However, due to local saturation effects in the spatial model, the empirical generation time is slightly lower, with an average of about 17 days (Supplementary Table 2). Parameter
b0 h
𝑇Ÿi 𝑇Ÿ¦
Value 3.19 5.3 10-3 14 6
Unit days-1 m-1 days days
Supplementary Table 2. Model parameters for the generation of synthetic datasets.
Synthetic datasets were built by running the transmission model over a square region of side length Q by seeding 200 imported cases at times sampled with uniform probability in the interval [1, 365] and a random location with uniform probability over space. The model was run until there were no more exposed or infectious individuals. Smaller values of Q result in 5
more densely distributed clusters, and therefore in a higher difficulty for the reconstruction model to discriminate among separate clusters occurring over the same area. A number of datasets were built by simulating the model with different values of Q (between 4 and 40km); the resulting number of total cases ranged between about 1400 and 1800, i.e. in the range of suspected and confirmed dengue cases in Porto Alegre in the year with highest incidence (i.e., 2016). The number of imported cases in the synthetic datasets (200) is also within the expected range of imported dengue cases for Porto Alegre based on both confirmed cases and on the model classification of suspected cases (see main text). A simulated synthetic data set is shown in Supplementary Figure 3. The reconstruction model was calibrated to each dataset using the same MCMC procedure reported above and in in the main text. number of cases = 1620
5000 10000 15000
Frequency
100 0
0
x (meters)
6 10 21 30 3 5 11 20 >30 Cluster size
0 10 20 30 40 50 60 Time from infection of infector and infection of infectees (days)
mean transmission distance = 375 m
3 2 0
1
0.2
0.4
0.6
Cluster diameter (km)
0.8
4
1.0
mean duration = 14.9 weeks mean diameter = 1.3 km
0.0
Cumulative percentage of transmission events
100 80 60 40 20 0
1 4
10 20 30 40 50 60 70 Time (weeks)
mean cluster size = 8.1 cases
0
200
300
80 60 20 0
0
0 Imported Local
Frequency
Tg=17 days
Total Imported
40
Number of cases
15000 10000 5000
y (meters)
20000
number of clusters = 200
0.0
0.5
1.0
1.5
Distance (km)
2.0
10
20
30
40
Cluster duration (weeks)
Supplementary Figure 3. Characteristics of the synthetic data sets for Q=20km.
In the next page, we provide the form adopted for epidemiological investigations (in Portuguese).
6
SINAN República Federativa do Brasil SISTEMA DE INFORMAÇÃO DE AGRAVOS DE NOTIFICAÇÃO Ministério da Saúde FICHA DE INVESTIGAÇÃO DENGUE E FEBRE DE CHIKUNGUNYA
Nº
Caso suspeito de dengue: pessoa que viva ou tenha viajado nos últimos 14 dias para área onde esteja ocorrendo transmissão de dengue ou tenha presença de Ae.aegypti que apresente febre, usualmente entre 2 e 7 dias, e apresente duas ou mais das seguintes manifestações: náuseas, vômitos, exantema, mialgias, cefaléia, dor retroorbital, petéquias ou prova do laço positiva e leucopenia. Caso suspeito de Chikungunya: febre de início súbito e artralgia ou artrite intensa com inicio agudo, não explicado por outras condições, que resida ou tenha viajado para áreas endêmicas ou epidêmicas até 14 dias antes do início dos sintomas, ou que tenha vínculo epidemiológico com um caso importado confirmado.
Dados Gerais
1 Tipo de Notificação
2 - Individual
1- DENGUE
2 Agravo/doença
2- CHIKUNGUNYA
Código (CID10)
3 Data da Notificação
A 90 A 92 4 UF
|
| |
|
|
|
|
|
|
|
| |
|
|
|
|
9 Data de Nascimento
1 - Hora 2 - Dia 3 - Mês 4 - Ano
|
|
| |
|
|
| |
| |
|
7 Data dos Primeiros Sintomas
Código
8 Nome do Paciente
10 (ou) Idade
|
Código (IBGE)
6 Unidade de Saúde (ou outra fonte notificadora)
Notificação Individual
| | | |
|
5 Município de Notificação
11 Sexo
12 Gestante
M - Masculino F - Feminino I - Ignorado
1-1ºTrimestre 2-2ºTrimestre 4- Idade gestacional Ignorada 9-Ignorado
14 Escolaridade
| |
13 Raça/Cor
3-3ºTrimestre 5-Não 6- Não se aplica
1-Branca 4-Parda
2-Preta 5-Indígena
3-Amarela 9- Ignorado
0-Analfabeto 1-1ª a 4ª série incompleta do EF (antigo primário ou 1º grau) 2-4ª série completa do EF (antigo primário ou 1º grau) 3-5ª à 8ª série incompleta do EF (antigo ginásio ou 1º grau) 4-Ensino fundamental completo (antigo ginásio ou 1º grau) 5-Ensino médio incompleto (antigo colegial ou 2º grau ) 6-Ensino médio completo (antigo colegial ou 2º grau ) 7-Educação superior incompleta 8-Educação superior completa 9-Ignorado 10- Não se aplica
16 Nome da mãe
15 Número do Cartão SUS
| | | | | | | | | | | | | | Código (IBGE)
17 UF 18 Município de Residência Dados de Residência
|
|
20 Bairro
19 Distrito
|
|
Código
23 Complemento (apto., casa, ...)
25 Geo campo 2
|
|
|
|
|
|
|
|
|
|
| - |
|
27 CEP
|
29 Zona 1 - Urbana 2 - Rural 3 - Periurbana 9 - Ignorado
|
|
24 Geo campo 1
26 Ponto de Referência
28 (DDD) Telefone
|
|
21 Logradouro (rua, avenida,...)
22 Número
|
|
30 País (se residente fora do Brasil)
|
|
Inv.
Dados clínicos e laboratoriais 31 Data da Investigação
|
|
|
32 Ocupação
|
|
Dados clínicos
33 Sinais clínicos
Febre Mialgia
1-Sim 2- Não
Cefaleia
Vômito
Dor nas costas
Exantema
Náuseas
Conjuntivite
34 Doenças pré-existentes 1-Sim 2- Não
Diabetes Doenças hematológicas 35 Data da Coleta da 1ª Amostra (S1)
|
|
|
|
Hipertensão arterial
Doença renal crônica
Doença ácido-péptica
|
39 Data da Coleta
|
|
Isolamento Data Viralda Coleta
43
|
|
47 Sorotipo 1- DENV 1 3- DENV 3
|
|
| |
| |
Chikungunya/Dengue
|
|
37 Data da Coleta
|
|
40 Resultado 1- Positivo 2- Negativo 3- Inconclusivo 4 - Não realizado 44 Resultado 1 - Positivo 2 - Negativo 3 - Inconclusivo 4 - Não Realizado 48
2- DENV 2 4 - DENV 4
|
38 Resultado
Exame PRNT
36 Data da Coleta da 2ª Amostra (S2)
|
Sorologia (IgM) Dengue
Doenças auto-imunes
Hepatopatias
Sorologia (IgM) Chikungunya
Dados laboratoriais
Prova do laço positiva Dor retroorbital
Petéquias Leucopenia
Artrite Artralgia intensa
Histopatologia
1- Compatível 2-Incompatível 3- Inconclusivo 4 - Não realizado
|
|
Exame NS1
|
PRNT S2 S1 1 - Reagente 2 - Não Reagente 3 Inconclusivo 4 - Não Realizado
|
42 Resultado
41 Data da Coleta
| 45
|
|
|
1- Positivo 2- Negativo 3- Inconclusivo 4 - Não realizado
|
46 Resultado
RT-PCR
Data da Coleta
|
|
|
|
|
1 - Positivo 2 - Negativo 3 - Inconclusivo 4 - Não Realizado
49 Imunohistoquímica 1- Positivo 2- Negativo 3- Inconclusivo 4 - Não realizado
Sinan Online
SVS
14/03/2016
7
Supplementary discussion Here we summarize results on transmission chain reconstruction from synthetic data.
Supplementary Figure 4 shows the performance of the reconstruction model for different values of Q. The average generation time was estimated with consistently high accuracy and small variability across Q. The average transmission distance was accurately estimate for Q>=12.5km and underestimated for lower values. Over 80% of transmission links were correctly identified by the model in at least one of the reconstructed chains for Q>=10km and at least 60% for smaller values of Q. The average proportion of infection sources correctly identified in each reconstructed chain was between 40% and 50% for Q >= 12.5km, with a decrease to 20% at Q=4km. About 50% of imported cases were correctly identified by the model, as long as Q remained above 15km; below this value, the ability of the model to discriminate imported cases deteriorated rapidly, with a sensitivity of about 20% at 4km; nonetheless, the model was highly specific in the identification of imported cases for all values of Q.
Supplementary Figure 4. Performance of the model on synthetic dataset for different sizes (Q) of the simulated study area (mean: solid black lines; 95% CI: light green areas). Dashed grey lines in the top row panels represent actual mean value in the synthetic data sets.
Supplementary Figure 5 shows a generally good agreement between the distribution of cluster sizes in synthetic datasets and in model-reconstructed transmission chains; however, the model tends to overestimate cluster sizes by merging independent clusters for Q80%) of suspected dengue cases. It is therefore possible that some of the clinical cases included in the main analysis were due to different diseases that were co-circulating in the same years (although with a much lower intensity: for example, in the four years, there were only 34 confirmed cases of chikungunya and 29 of Zika virus). Given potential diagnostic uncertainties, we performed a complete re-analysis using only the subset of confirmed cases, representing less than 20% of the complete dataset. Despite the large undersampling, we obtained remarkably consistent results (reported below) with respect to the main analysis. 13
The generation time was estimated at 17.7 days (95%CI: 17.3-18.1 days). The model identified large waves of imported cases for the first months of 2013, 2015 and 2016, followed by a much more modest amount of secondary transmission, with peaks of Re always below the epidemic threshold (Supplementary Figure 13). The low ratio of local to imported cases is a consequence of the model’s difficulty in identifying a suitable infector for many cases, due to the massive undersampling in the “confirmed” dataset. The distribution of cluster sizes was similar in the confirmed dataset with respect to the main analysis (Supplementary Figure 14), although clusters were generally smaller. The proportion of imported cases with no secondary transmission is once again higher in 2014 and 2015 (8590%) compared to 2013 and 2016 (70-80%) and only a few clusters involved more than 10 individuals. As in the main analysis, also in this case a few larger clusters were responsible for the large majority of all secondary cases in 2013 and 2016.
a) b) Supplementary Figure 13. a) time series of confirmed dengue cases, classified according to model-reconstructed transmission chains. b) effective reproductive number Re over time, compared with daily confirmed cases.
a) b) Supplementary Figure 14. Size of transmission clusters reconstructed using the subset of confirmed dengue cases. a) distribution of cluster size by year; green: all clusters, grey: clusters with index case imported during the peak transmission months (February and March); b) cumulative number of transmitted cases by quantile of clusters
14
a)
b)
c) d) Supplementary Figure 15. Focal transmission of confirmed dengue cases: a) estimated cumulative proportion of transmission events as a function of distance; b) distribution of the cluster diameter; green: all clusters, grey: clusters with index case imported during the peak transmission months (February and March); c) distribution of cluster duration by year; d) relation between cluster diameter and duration; points: average diameter; shaded area: 95% credible interval; dashed lines: linear regression on points. Green: all clusters, orange: clusters with index case imported during the peak transmission months (February and March).
The average transmission distance was estimated at 223m (182-341m) and less than 5% of infections were transmitted beyond a distance of 1km (Supplementary Figure 15a). 85% of clusters were localized within 1km, with only 0.4% extending beyond 3km 1km (Supplementary Figure 15b). Their median duration was 26 and 29 days in 2013 and 2016 respectively (only 1 and 3 clusters of secondary confirmed cases were detected in 2014 and 2015) 1km (Supplementary Figure 15c). The linear relationship between cluster duration and cluster diameter held, but the average time required for a cluster to reach a diameter of 1km was slightly higher than in the main analysis (about 9 weeks instead of 7) (Supplementary Figure 15d). The re-analysis on confirmed cases also shows a robust correlation between the neighborhoodspecific transmission intensity and the corresponding mosquito infestation index (Supplementary Figure 16). For every doubling of the infestation index, the model estimates an increase in the transmission intensity by 77% (95%CI: 6-197%), i.e. in a similar range compared to the main analysis.
15
Supplementary Figure 16. Relationship between transmission intensity, represented by the ratio of local to imported cases, and the neighborhood’s mosquito infestation level (log-log scale). Circles: neighborhoods for which the information on mosquito abundance was available (size is proportional to the total number of cases); Light blue: 2013; green: 2016. Dashed gray lines: linear regression model on the log-transformed variables (pvalue = 0.042).
Supplementary Figure 17. Cluster characteristics with respect to timeliness of interventions. Center: mean; bounds of box: interquartile range; whiskers: 95%CI.
Supplementary Figure 17 confirms the association between cluster characteristics (diameter, duration and size) and the timeliness of interventions, although the low number of clusters in the reduced dataset prevents a meaningful disaggregation with respect to treatment intensity. The robustness of model results when sampled on the small subset of confirmed cases is somehow surprising, in light of model results on undersampled synthetic datasets. However, this can be explained by the non-random distribution of confirmed cases within transmission chains. Confirmed cases are represented in 17.5% (CI: 15.1-19.4%) of clusters reconstructed from the full dataset. By comparison, a random sample of cases with equal size (N=646) would be represented, on average, in 30.7% (27.3-34.7%) of reconstructed clusters. In addition, 16
confirmed cases represent, overall, 52.3% (42.1-63.6%) of the total of cases in clusters in which they appear. If confirmed cases were randomly distributed across clusters, we would expect them to represent about 20% of the total. We conclude that cases were more likely to be confirmed when they were at relatively short temporal and spatial distances from other confirmed cases, i.e. within the same cluster. In this way, confirmed cases maintain partially the spatiotemporal structure of dengue transmission of the full dataset, thereby allowing the reconstruction of key features of the transmission dynamics. Here we summarize results obtained by analyzing under-sampled datasets from Porto Alegre. To demonstrate that the spatiotemporal structure of dengue transmission is conserved in data characterized by large underreporing rates, we re-run our analyses after discarding a fraction of randomly chosen notified cases. Supplementary Figure 18 shows that the estimated cumulative probability distribution function of transmission distances is substantially similar to the main analysis when discarding 40% (Supplementary Figure 18a) of notification data. A larger average transmission distance was estimated when discarding 80% (Supplementary Figure 18b) of notification data.
a) b) Supplementary Figure 18. Estimated cumulative proportion of transmission events as a function of distance after randomly discarding a subset of notification data. a) 40% discarded cases b) 80% discarded cases.
Supplementary Figure 19 shows the corresponding results for cluster diffusion. In this case, the linear growth of the cluster diameter over time is qualitatively reproduced in both scenarios. The diffusion speed is also quantitatively unchanged in the scenario where 40% of notifications are discarded, but it tends to be underestimated in the scenario with 80% underreporting. Supplementary Figure 20-22 report further results for these two scenarios. All in all, these results show that results are robust when discarding up to 40% of the notification data.
a) b) Supplementary Figure 19. Relation between cluster diameter and duration estimated after randomly discarding a subset of notification data. a) 40% discarded cases b) 80% discarded cases. Points: average cluster diameter; shaded area: 95% credible interval; dashed lines: linear regression on points.
17
a)
b)
c) d) Supplementary Figure 20. a, b) time series of confirmed dengue cases, classified according to modelreconstructed transmission chains. c, d) effective reproductive number Re over time. a, c) 40% discarded cases; b, d) 80% discarded cases.
18
a)
b)
c) d) Supplementary Figure 21. Size of transmission clusters reconstructed using the subset of confirmed dengue cases. a, b) distribution of cluster size by year; c, d) cumulative number of transmitted cases by quantile of clusters. a, c) 40% discarded cases; b, d) 80% discarded cases.
19
a)
b)
c) d) Supplementary Figure 22. a, b) distribution of the cluster diameter; c, d) distribution of cluster duration by year. a, c) 40% discarded cases; b, d) 80% discarded cases.
Here we summarize results for Porto Alegre obtained by using a geographic kernel based on the radiation model. To assess the role of long-distance urban commuting on dengue transmission within a city, we evaluated the model performance after substituting the geographic kernel based on negative exponential distances with a model representing human mobility. The radiation model [7] is a parsimonious and accurate way of describing human mobility and assumes that the probability of commuting from location i to location j depends on the respective populations, pi and pj, and on the total population pij encompassed by a circle with radius equal to the distance dij between i and j and centered on i (excluding pi and pj), according to the following equation: 𝑝( 𝑝" 𝐾(𝑖, 𝑗) = 8𝑝( + 𝑝(" 9(𝑝( + 𝑝" + 𝑝(" ) We used population data from Worldpop [8] at a spatial resolution of 1km, overlaid to official shapefiles for the administrative boundaries of Porto Alegre, and we assigned each dengue case to the nearest cell to compute the kernel values. We then recalibrated the model using the same MCMC procedure adopted for the main analysis. We compared the model performance to that of the exponential kernel using the Akaike Information Criterion [9] and Bayesian Information Criterion scores [10], in order to penalize the additional parameter h of the exponential kernel. Both the AIC and the BIC were significantly worse for the radiation model (see Supplementary Figure 23), suggesting that local transmission explains the spatiotemporal patterns of dengue transmission in Porto Alegre better than human mobility at the urban scale. Supplementary Figures 24-28 below report the main results obtained with the 20
radiation model. Briefly, a much larger mean transmission distance was estimated (1174m, 95%CI: 1119-1244), cluster diameter expanded up to 10km, thus covering large parts of the city (Supplementary Figure 26). Finally, the diffusion speed was estimated at roughly 2km month-1. The relationship between mosquito abundance and ratio between imported and locally transmitted cases was similar to that found in the main analysis (Supplementary Figure 27). The same holds for results concerning the impact of treatment (Supplementary Figure 28).
Supplementary Figure 23. Distribution of AIC and BIC scores for reconstructed transmission chains using the exponential kernel and the radiation model.
a) b) Supplementary Figure 24. a) time series of confirmed dengue cases, classified according to modelreconstructed transmission chains using a radiation kernel. b) effective reproductive number Re over time, compared with daily confirmed cases.
21
Supplementary Figure 25. Distribution of cluster size by year, reconstructed using a radiation kernel.
a)
b)
c) d) Supplementary Figure 26. Focal transmission of confirmed dengue cases reconstructed using a radiation model: a) estimated cumulative proportion of transmission events as a function of distance; b) distribution of the cluster diameter; c) distribution of cluster duration by year; d) relation between cluster diameter and duration; points: average diameter; shaded area: 95% credible interval; dashed lines: linear regression on points.
22
Supplementary Figure 27. Relationship between transmission intensity, represented by the ratio of local to imported cases, and the neighborhood’s mosquito infestation level (log-log scale), computed from the radiation model. Circles: neighborhoods for which the information on mosquito abundance was available (size is proportional to the total number of cases); Light blue: 2013; green: 2016. Dashed gray lines: linear regression model on the log-transformed variables (p-value = 0.0001).
Supplementary Figure 28. Cluster characteristics with respect to timeliness and intensity of interventions. Center: mean; bounds of box: interquartile range; whiskers: 95%CI.
23
Supplementary References 1. Lau MS, Dalziel BD, Funk S, McClelland A, Tiffany A, Riley S, Metcalf CJ, Grenfell BT. Spatial and temporal dynamics of superspreading events in the 2014-2015 West Africa Ebola epidemic. Proc Natl Acad Sci U S A. 2017 Feb 28;114(9):2337-2342. doi: 10.1073/pnas.1614595114. 2. Gibson GJ, Renshaw E. Estimating parameters in stochastic compartmental models using Markov chain methods. Math Med Biol. 1998; 15(1):19–40. 3. Salje H, Lessler J, Paul KK, Azman AS, Rahman MW, Rahman M, Cummings D, Gurley ES, Cauchemez S. How social structures, space, and behaviors shape the spread of infectious diseases using chikungunya as a case study. Proceedings of the National Academy of Sciences. 2016 Nov 22;113(47):13420-5. 4. Chan M, Johansson MA. The incubation periods of dengue viruses. PloS one 2012; 7(11): e50972. 5. Svensson Å. A note on generation times in epidemic models. Mathematical biosciences. 2007 Jul 1;208(1):300-11. 6. Salje H, Lessler J, Maljkovic Berry I, Melendrez MC, Endy T, Kalayanarooj S, ANuegoonpipat A, Chanama S, Sangkijporn S, Klungthong C, Thaisomboonsuk B, Nisalak A, Gibbons RV, Iamsirithaworn S, Macareo LR, Yoon IK, Sangarsang A, Jarman RG, Cummings DA. Dengue diversity across spatial and temporal scales: Local structure and the effect of host population size. Science. 2017;355(6331):1302-1306. doi: 10.1126/science.aaj9384. 7. Simini F, González MC, Maritan A, Barabási AL. A universal model for mobility and migration patterns. Nature. 2012 Apr;484(7392):96. 8. Sorichetta A, Hornby GM, Stevens FR, Gaughan AE, Linard C, Tatem AJ. Highresolution gridded population datasets for Latin America and the Caribbean in 2010, 2015, and 2020. Scientific data. 2015 Sep 1;2:150045. 9. H. Akaike. An information criterion (AIC). Math. Sci. 14(153):5-9 (1976). 10. Schwarz G. Estimating the dimension of a model. The annals of statistics. 1978;6(2):4614.
24