Madison, Meriwether, Murray, Newton, Oconee, Oglethorpe,. Paulding, Pickens, Polk ...... Harrison, Barbara, David H. Newman, and Ginger Macheski. 1997.
Quantifying the value of non-timber ecosystem services from Georgia’s private forests Rebecca Moore Tiffany Williams Eduardo Rodriguez Jeffrey Hepinstall-Cymmerman
Final Report submitted to the Georgia Forestry Foundation January 2011
Acknowledgments Research for this report was supported by a grant from the Georgia Forestry Foundation, with contributions from: American Forest Foundation Georgia Conservancy Georgia Farm Bureau Georgia Forestry Commission Georgia Forestry Foundation Georgia Power Company Georgia-Pacific Foundation Georgia Tree Farm Program National Alliance of Forest Owners Plum Creek Timber Company Rayonier Foundation Smith, Gambrell & Russell Superior Pine Products Company Sustainable Forestry Initiative-SIC Sutherland Asbill & Brennan LLP Tall Timbers Research Station & Land Conservancy Trust for Public Land The Langdale Company The Nature Conservancy-Georgia Wells Real Estate Funds Weyerhaeuser Foundation
ii
Executive Summary Georgia’s forests provide essential ecosystem services like water filtration, carbon storage, wildlife habitat, recreational opportunities and scenic beauty. However, because no market exists in which to trade many of these services, it is difficult to quantify the benefits they provide. Ecosystem services are those things that nature provides that are of direct benefit to humans. The purpose of the research summarized in this report is to provide an estimate of the value of ecosystem services provided by private forests in Georgia. We outline a four-step process for estimating the public ecosystem service benefits of private forests in Georgia: 1) Identify the geographic, ecological and economic scope of the study; 2) Create a landscape classification system based on forest characteristics which predict significant differences in the flow and value of ecosystem services; 3) Use the best available data to estimate average per-acre values for each unique combination of forest characteristics and each ecosystem service identified; 4) Calculate the total ecosystem service value. Identify the geographic, ecological and economic scope of the study The scope of our study is limited to the 22 million acres of privately-owned forestland in Georgia. Based on a review of the literature, we identified eight types of ecosystem services forests provide: 1. Timber and forest product provision: Forests provide raw materials for many uses. 2. Recreation: Forests provide a potential place for recreation. 3. Gas and climate regulation: Forests contribute to the general maintenance of a habitable planet by regulating carbon, ozone, and other chemicals in the atmosphere. 4. Water quantity and quality: Forests capture, store, and filter water mitigating damage from floods, droughts, and pollution. 5. Soil formation and stability: Forest vegetation stabilizes soil and prevents erosion. 6. Pollination: Forests provide habitat for important pollinator species who naturally perpetuate plants and crops. 7. Habitat/refugia: Forests provide living space to wild plants and animals. 8. Aesthetic, cultural and passive use: Forests provide scenic value and many people have a positive existence value for forestland. We are interested only in those ecosystem services that provide external benefits, or benefits to people besides the landowner or land user. Because of this, we do not consider the value of timber and forest products provision or recreation. We do consider the value of the other six ecosystem services listed above. Create a landscape classification system based on forest characteristics The value of ecosystem services provided by a particular acre of forestland depends on the quantity and quality of the ecosystem functions and services provided, and the magnitude, preferences, and demographic characteristics of the population receiving those services, typically the nearby population. For large scale valuation projects such as this one, it is not possible to consider each parcel of forestland separately. Instead, we develop a landscape classification system that identifies forestlands that are likely to have similar per-acre values of ecosystem
iii
services. We then estimate the value of an average acre of forests in each unique category and apply this value to all acres in that category. We considered seven different forest characteristics expected to create differences in the flow and/or value of ecosystem services: forest type, riparian status, rare species abundance, scenic visibility, public land buffer, development class, and geographic region. Some of these characteristics affect the quantity or quality of ecosystem services provided. For example, an acre of forestland in a riparian area has a much greater impact on water quality and quantity than an acre of non-riparian forest. The per-acre value of riparian forests will be higher because of this difference in the underlying ecosystem functions. Other characteristics primarily affect the value of the service provided. For example, an acre of forestland in an urban area will have a greater aesthetic value than one in a rural area simply because more people are around to see it. Based on our application of these seven characteristics, there are 864 possible combinations of characteristics that might describe Georgia’s private forests. These characteristics describe much of the important variation in ecosystem service flow and value. In applying this classification scheme, we move from an intractable problem (trying to evaluate each of the 22 million acres of private forests separately) to a complex, but manageable one. For a given combination of forest characteristics (eg., mixed forests in North Georgia, riparian, high wildlife, non-roadside, non-public buffer, and urban), we assume each acre of forest with those characteristics produces an identical flow of ecosystem service value. However, forests with different characteristics can have different per-acre values. This is an improvement over most previous studies of this type that allow for just a few different types of forests (and often consider all forest acres as identical). Not all forest characteristics are equally represented by Georgia’s private forests. For example, there are no private forests in Georgia that are characterized as riparian, with low species abundance, are visible from a highway, buffer public land, and are in an urban area of south Georgia. Of the 864 potential classifications of forests, 65 include no private forestland in Georgia, and an additional 547 classifications describe fewer than 1000 acres each. In contrast, over 12% of all forests in Georgia fall in a single classification (rural, south Georgia, evergreen, not riparian, not roadside, not public buffer, low wildlife). Use the best available data to estimate average per-acre values We take a two-pronged approach to estimating per-acre ecosystem service values. We developed a stated choice survey to collect original data to estimate aesthetic and non-use values of our study area. Relative to other ecosystem services, these values are most dependent on the tastes and preferences of the local population and therefore the most problematic for value transfer. For the other five ecosystem services of interest we relied on value transfer methods. For the value transfer component, we considered each ecosystem service individually. We began with a preliminary estimate of the per-acre value based on the values reported in a similar study in New Jersey (Liu et al. 2010). We then carefully considered the sources used to generate that value. We removed some source estimates, reevaluated others to better apply to Georgia, and considered other original studies that might be included. From this process, we estimate the average per-acre value of each service by forest characteristics and also identify areas of much needed research. Table 1 summarizes the value estimates for the five ecosystem services considered for value transfer.
iv
Table 1. Summary of ecosystem service values for value transfer.
Ecosystem Service Gas and climate regulation: Water regulation and supply: Soil formation: Pollination: Habitat/refugia:
$/acre/year in 2009 US$ $28 - $381 depending on forest characteristics $0 - $8,196 depending on forest characteristics No data available $0 - $184 depending on forest characteristics $0 - $251 depending on forest characteristics
To estimate aesthetic and non-use values, we conducted a mail survey of the general population of Georgia during summer and fall 2010. The survey contained background information on forests and ecosystem services and asked respondents about their familiarity with Georgia’s forests, recreation activities, general questions about the environment, preferences for public regulation of forested land, and sociodemographic characteristics. In addition, each respondent was asked four questions as part of the stated choice experiment. In these questions, the respondent was invited to participate in a hypothetical referendum. They were told that a referendum was up for vote that would affect the future of Georgia’s private forests. They were presented with two alternative futures in each question. By varying the attributes of the alternatives, we are able to estimate an individual’s marginal willingness to pay (WTP) for an increase in different types of forestland. When aggregated to the population of Georgia, the aesthetic and non-use value of additional forested acres ranges from $52/year to $4,642/year depending on the characteristics and location of the land. We found that respondents expressed positive values for forest land across the state, but not surprisingly had higher values for forestland in their area. Also, respondents were willing to pay a premium to protect forests important for wildlife and water. In addition to the questions related to the choice experiment, the survey gathered data on respondents’ experiences with forestland in Georgia, general attitudes about forests and the forest industry, and basic demographic data. Respondents from different regions have different rates of forest ownership and different rates of participation in different forest-related recreation. A majority of respondents reported that the beauty of the landscape in their area has changed over the years due to tree cutting and have concerns or apprehensions about the way forests in Georgia are being managed. Only 45% of respondents agreed with the statement “I trust Georgia’s forest owners to maintain healthy forests in the long term.” When asked if they agree that there are enough checks and balances in place to ensure responsible forest management in Georgia, 24% of respondents agreed, 45% were neutral, and 27% disagreed. Only 28% of respondents felt that private forest owners have the right to do as they please with their forests regardless of what it does to the environment. 58% said private property rights should be limited if necessary to protect the environment but 68% said that the landowner should be paid for any economic loss accrued when prevented from cutting on his land because of government regulations. Just over half of respondents would support programs that provided incentives for forest landowners to voluntarily comply with environmental regulations. Calculate the total ecosystem service value Based on our analysis, we estimate that the total value of these six ecosystem services provided by Georgia’s 22 million acres of private forests is over $37.6 billion per year. Per-acre values range from $264 to $13,442 depending on the forest characteristics. Higher per acre values generally come from forested wetlands or riparian forests in urban areas while lower peracre values come from non-wetland forests in rural areas. This represents a lower bound of the v
public value of private forests for several reasons. The value of some ecosystem services, such as erosion control and ground water recharge could not be explicitly included in our final estimates because there was not enough information available to estimate their value or because the benefits occur on a relatively small scale and could not be incorporated at the state-level. Other technical aspects of the analysis were conducted in a way to insure a conservative estimate. It is also important to remember that we estimate only one component of the Total Economic Value of private forests in Georgia. We estimate the indirect use and non-use values of the forests. These are components of value that do not require ownership of or access to the land. Two significant components of the total value that are not included are the value of timber and forest products and recreation. Other research has estimated the impacts of these industries on Georgia’s economy. Because economic impacts and economic benefits are different things, we cannot add these values together. Economic impacts consider the revenue generated from market activity and trace this revenue through the economy. Economic benefits are the difference between what consumers would be willing to pay for something and what they have to pay. However, when considered together, this body of research provides an overall view of the importance of forestland to the people of Georgia.
vi
Table of Contents Acknowledgments ......................................................................................................................... ii Executive Summary ..................................................................................................................... iii Table of Contents ........................................................................................................................ vii List of Tables .............................................................................................................................. viii List of Figures............................................................................................................................. viii Part 1: Overview .......................................................................................................................... 2 Project Motivation .................................................................................................................... 2 Defining ecosystem services ..................................................................................................... 2 Defining and measuring economic value ................................................................................ 3 Overview of project methodology............................................................................................ 7 Part 2: Landscape Classification .............................................................................................. 10 Forest Type .............................................................................................................................. 10 Riparian Status ....................................................................................................................... 11 Rare Species Abundance ........................................................................................................ 12 Scenic Visibility ....................................................................................................................... 13 Public Land Buffer ................................................................................................................. 14 Development Status ................................................................................................................ 15 Geographic Region.................................................................................................................. 16 Summary of Landscape Classification.................................................................................. 18 Part 3: Value Transfer............................................................................................................... 20 General Value Transfer Protocol .......................................................................................... 20 Gas and climate regulation .................................................................................................... 21 Water regulation and supply ................................................................................................. 22 Soil formation .......................................................................................................................... 23 Pollination................................................................................................................................ 23 Habitat/refugia ........................................................................................................................ 23 Aesthetic and non-use value................................................................................................... 24 Summary and Discussion of Value Transfer Protocol ........................................................ 24 Part 4: Stated Choice ................................................................................................................. 27 Survey Design and Administration ....................................................................................... 27 Summary of Survey Data ....................................................................................................... 28 Aesthetic and Non-Use Value Estimates ............................................................................... 30 Part 5: Final Results and Discussion........................................................................................ 33 Final Estimates ........................................................................................................................ 33 These values in context ........................................................................................................... 34 References.................................................................................................................................... 36 Appendix A: Reference used in value transfer........................................................................ 39 Appendix B: Example stated choice questions........................................................................ 40
vii
List of Tables Table 1. Summary of ecosystem service values for value transfer................................................ v Table 2. Description of ecosystem services................................................................................... 4 Table 3. Description of valuation approaches................................................................................ 5 Table 4. Private forest area by Forest Type. ................................................................................ 10 Table 5. Private forest area by Riparian Status............................................................................ 11 Table 6. Private forest area by Rare Species Abundance. ........................................................... 13 Table 7. Private forest area by Scenic Visibility.......................................................................... 14 Table 8. Private forest area by Public Land Buffer. .................................................................... 15 Table 9. Private forest area by Development Status. ................................................................... 16 Table 10. Counties by Geographic Region. ................................................................................. 17 Table 11. Private forest area by Geographic Region. .................................................................. 17 Table 12. Summary of GIS Data Sources.................................................................................... 19 Table 13. Summary of Value Transfer Analysis ......................................................................... 21 Table 14. Value per acre, per year of wetland forests ................................................................. 22 Table 15. Summary of wildlife/refugia values. ........................................................................... 24 Table 16. Estimated values for Evergreen Forests by forest characteristics, without aesthetic. . 25 Table 17. Estimated values for Deciduous and Mixed Forests without aesthetic. ...................... 25 Table 18. Estimated values for Forested Wetlands by forest characteristic, without aesthetic. .. 26 Table 19. Attributes and levels for stated choice experiment...................................................... 28 Table 20. Response Rate by Region. ........................................................................................... 28 Table 21. Sociodemographic characteristics of the survey respondents by Region. ................... 29 Table 22. Experience with Georgia’s forests by Region. ............................................................ 29 Table 23. MNL variable names and descriptions. ....................................................................... 30 Table 24. Individual Marginal WTP by region and priority......................................................... 31 Table 25. Aesthetic and non-use value estimates. ....................................................................... 32 Table 26. Total value by ecosystem service. ............................................................................... 33 Table 27. Impact of Forest Characteristics on Ecosystem Services ............................................. 33
List of Figures Figure 1. Figure 2. Figure 3. Figure 4. Figure 5. Figure 6. Figure 7.
Distribution of Forest Type in Georgia. ....................................................................... 11 Distribution of Riparian Forests in Georgia. ................................................................ 12 Distribution of Rare Species Abundance in Georgia. .................................................. 13 Distribution of roadside forests in Georgia. ................................................................. 14 Distribution of forests buffering private land in Georgia............................................. 15 Distribution of Development Status in Georgia. .......................................................... 16 Geographic Regions. .................................................................................................... 18
viii
Part 1: Overview Project Motivation In addition to timber and other marketable wood products, Georgia’s forests provide essential ecosystem services like water filtration, carbon storage, wildlife habitat, recreational opportunities and scenic beauty. The loss of forestland can lead to risks to human health, accelerated climate change, increased watershed disruption, loss of water quality, and loss of biodiversity (Pearce 2001). However, because no market exists in which to trade many of these services, landowners have little incentive to consider their value when making land use decisions. Recently, market-based mechanisms (such as the carbon registry or nutrient trading programs) have been proposed and/or designed in order to provide the landowner with greater incentives to leave land in forest production. Landowners who only consider the timber value of land in forest production will be more likely to choose non-forest land use options, such as development, which provide more benefits to the landowner. This means fewer acres in forest production, reduced importance of the region in global forest markets, and loss of benefits to society from reduced flows of ecosystem services. Efficient land use decisions must take into account the total economic value of each land use option, including market and non-market, use and non-use, values. If the total economic value of forested land, including the value associated with timber production and the other ecosystem services provided, is compared to the total economic value of alternative land uses, it is likely that more land would remain in forest production, ensuring sustainable flows of essential forest ecosystem services. We cannot address this problem without knowing the total economic value of forested land, including the value of all non-market forest ecosystem services. Though the forest land use decision clearly indicates a failure of the market to lead to an efficient solution, historically, forest regulations and tax policies have not addressed this problem. One reason for this oversight is that the value of these other ecosystem services is difficult to quantify, even if the physical nature of the service is well-understood. While carbon markets and water quality trading markets may eventually help us quantify the value of these services, most of these institutions are still in the proposal or early development stage. Also, values of other forest benefits (e.g., scenic beauty, habitat for endangered species) are less easily captured in market-like settings. As a result, it is difficult to incorporate these values into public decision-making in a meaningful way. At the same time, important decisions are being made today that will significantly impact the amount of land that remains in forest cover in the near future. The primary objective of the research summarized in this report was to fill this knowledge gap by using best available methods to quantify the benefits Georgia’s private forests provide to non-forest owners. Defining ecosystem services While sometimes unrecognized by humans, ecosystem services are a vital component of the ecology and economy of the world. The idea of ecosystem services has become an organizing principle for much recent research in both ecology and economics, and also appeals to land managers and landowners who are trying to make efficient decisions related to their land (Brown et al. 2007). As the field has developed, the definition of ecosystem services has evolved and several lists and organizational frameworks for evaluating ecosystem services have been developed (Costanza et al. 1997; de Groot et al. 2002; Daily 1997; MEA 2005; Brown et al. 2007; Boyd and Banzhaf 2006; Wallace 2007; Fisher and Turner 2008). In an early writing on the topic, Daily (1997) described ecosystem services as the “conditions and processes through which natural ecosystem, and the species that make them up, sustain and fulfill human life”. The 2
Millennium Assessment (MEA 2005) defines ecosystem services as the benefits people obtain from ecosystems and divides these services in to four categories: supporting, regulating, provisioning, and cultural services. Brown et al. (2007) distinguish between ecosystem structure, ecosystem processes, and ecosystem goods and services. Ecosystem structure includes the physical and biological components of the ecosystem itself, such as the quantity of water in a reservoir, the soil characteristics, or the density of trees. Ecosystem processes (also called ecosystem functions) are the things that link the components of structure. For example, water supply and wildlife growth are ecosystem functions that depend on the underlying ecosystem structure. Ecosystem processes support the production of ecosystem goods and services. Fisher and Turner (2008) distinguish between intermediate and final ecosystem services and their benefits. The human benefits flow from the final services, which are produced by intermediate services. In some cases, what is considered an intermediate service by Turner et al. is identified as an ecosystem process in Brown et al., and might be a regulating service in the Millennium Assessment. A distinction can also be made between ecosystem goods and ecosystem services (Daily 1997; Brown et al. 2007). Ecosystem goods are the tangible products of nature, such as timber, minerals, water, and wildlife. Ecosystem goods are better recognized for their contribution to our “natural wealth”. Ecosystem services are less recognized aspects of nature’s services and in most cases refer to improvements in the condition or location of things of value. Daily referred to ecosystem services as the “actual life-support functions, such as cleansing, recycling, and renewal, …[which] confer many intangible aesthetic and cultural benefits as well (Daily 1997)”. The common thread of the ecosystem service literature is that any delineation, taxonomy, or classification system needs to be flexible and the most appropriate approach for evaluating (and valuing) ecosystem services depends on the needs and purpose of the project. This is not to imply that anything goes, but only to recognize that the distinction between these dichotomies (ecosystem process vs. ecosystem service, intermediate vs. final service, ecosystem good vs. ecosystem service) depends on the context of the problem at hand. Any attempt to evaluate ecosystem services must consider these issues if only to determine the scope of the project. For our purposes, we define ecosystem services as the things nature provides that are of direct benefit to humans. We recognize that these ecosystem services are dependent on underlying ecosystem structure and function that may or may not be recognized by society. We acknowledge the distinction between ecosystem goods and ecosystem services, but for brevity, in this report we will refer to these collectively as ecosystem services. We identified eight broad classifications of ecosystem services provided by forestland in Georgia: timber and forest product provision, recreation, gas and climate regulation, water quantity and quality, soil formation and stability, pollination, habitat refugium, and aesthetic, cultural and non-use values. These ecosystem services are described in Table 2. However, because our objective is to estimate the public benefits of forestland, our estimated benefits do not include the value of timber and fiber provision or recreation. Defining and measuring economic value Now that we have defined ecosystem services, we turn to the concept of economic value. Economic value is a measure of the contribution something makes toward human wellbeing (Brown et al. 2007). This is an instrumental type of value, in that something is value because it is a means to an end, in this case, because it brings utility, or happiness, to someone. Ecologists sometimes consider nature to have intrinsic value, or a value independent of any human preference, or even knowledge (Freeman 2003). In this project, we are only interested in the economic value of ecosystem services, but that is not as limiting as it might seem. Economists 3
acknowledge several components that together comprise the Total Economic Value (TEV) of something. Table 2. Description of ecosystem services.
Ecosystem Service Timber and forest products provision
Recreation
Gas and climate regulation
Water quantity and quality
Soil formation and stability
Pollination
Habitat/refugia
Aesthetic, cultural and passive use
General Description
Consideration for our analysis
Raw materials extracted from forests Used to produce lumber, engineered wood, fuelwood, landscape products, ornamental products, and edible products (fruits and nuts) (Harper et al. 2009) Potential place for recreation Georgia has relatively little public land, so private forests play a large role in providing recreational opportunities (Notman et al. 2006) General maintenance of a habitable planet Regulating CO2, O2, O3 (ozone) and SOx levels in order to prevent disease and maintain clean, breathable air and a favorable climate (de Groot et al. 2002).
Not considered in our analysis. The benefits of this service are typically shared between the landowner and the consumer of the product.
Capture, storage, and filtration of water Forests mitigate damage from floods and droughts and naturally filter water which is essential for agricultural, municipal, and industrial uses and serves as an intermediate service for other ecosystem services such as recreation and habitat. (Krieger 2001). Forest vegetation stabilizes soil and prevents erosion. Helps prevent damaged roads and structures, filled ditches and reservoirs, reduced water quality, and reduced fish populations (Krieger 2001). Provide habitat for important pollinator species Most plant species, including crops, require pollination. As pollinating species are threatened with habitat loss, often costly artificial pollination is required to maintain healthy systems and crops. (de Groot et al. 2002) Provide living space to wild plants and animals Both for resident and migratory, game and non-game species; maintain biologic and genetic diversity that provides natural pest and disease control (de Groot et al. 2002). Scenic, existence, and/or bequest value People often value the aesthetic quality of forests scenery and attach value to knowing that forests exist now and will continue to exist in the future (Krieger 2001).
Not considered in our analysis. The benefits of this service are generally enjoyed by the recreational user and require access to the land. Partially estimated with value transfer. Due to limited data, our estimates are dominated by climate regulation and the value of carbon storage. Other particulate regulation is partially considered only for urban forests. Partially estimated with value transfer. Our estimates capture some aspects of flood damage, pollution regulation, water supply for surface water. Due to limited data, some important but localized benefits, such as groundwater recharge in south Georgia, are not included in final estimates. Not included in the final estimates. These services provide relatively localized benefits and could not be incorporated at the statewide spatial scale considered here. Partially estimated with value transfer. Available data is limited and our estimate is likely a lower bound.
Partially estimated with value transfer. Our estimates include benefits of threatened and endangered species and overall biodiversity. We do not consider the value of habitat in the maintenance of game species habitat as this is a value to the user. Estimated from survey data.
4
There are two main components of TEV: use value and non-use (or passive use) value. Use value captures the benefits received by using the resource either directly or indirectly. Examples of direct use include consumptive uses, like timber harvesting or water withdrawal, and non-consumptive uses like bird watching or boating. Direct use requires direct contact with the resource. Many ecosystem services provide indirect use value as well, which do not require direct contact with the resource. For example water and air quality-related services impact the quality of the ecosystem and thus our quality of life, but we do not have to directly interact with the forest to receive these indirect use benefits. Economic theory and data show that the Total Economic Value of many environmental goods is greater than their use value. This additional benefit is known as non-use, or passive use, value. For example, a person might value knowing that an endangered species exists, even if it has no use value, meaning the person isn’t likely to view or otherwise interact with the species, even indirectly. This type of non-use value is known as existence value because it stems from knowing something exists. Another common source of non-use value is bequest value, or the value of knowing a resource will continue to exist for future generations. We are interested in estimating the indirect use value and non-use value components of the Total Economic Value of ecosystem services from Georgia’s private forests. There are several methods used to estimate economic value. These methods differ in terms of the data used, the components of TEV that are considered, whose values are included, and the value metric estimated. Economic theory says that the value of a good to an individual is the difference between what the person would be willing to pay to have the good, and the cost of producing that good. This is also called the total surplus. Unfortunately, total surplus is difficult to measure because we rarely observe someone’s willingness to pay (WTP) for something, only what they have to pay. For many ecosystem services, they don’t have to pay anything. But just because something is free, does not mean it has zero value. Because of the difficulty with measuring WTP, some valuation methods estimate other related concepts, such as what is actually paid, which is considered a lower bound estimate on true WTP. A more complete discussion of economic value and valuation measures can be found in Brown et al. (2007), Champ et al. (2003), Fisher and Turner (2008) and other sources. We describe these aspects of six general approaches in Table 3. Table 3. Description of valuation approaches.
Market valuation
Estimates based on market exchange of the ecosystem good Example: Observing price fluctuations and demand and supply of timber traded at market values to estimate the demand and willingness to pay (WTP) for timber Data required: Observations of individual and firm decisions in markets for goods or services Component of value: Use value only Individuals considered: Market participants only Value metric: Can be used to measure WTP with enough data, but typically uses price as a marginal value, which is an underestimate of total WTP Other comments: Most ecosystem services aren’t traded in markets, so this approach can’t be used.
5
Production function
The value of a non-market resource is estimated based on its contribution as an input to the production of a market good. Example: Estimating the value of irrigation water as an input for crop production, even if the farmer does not pay a market price for the water. Data requirements: Data on input and production decisions, market data for the output Component of value: Indirect use only Individual considered: Producer Value metric: Producer’s surplus, which is an underestimate of willingness to pay (WTP) Other comments: Requires the output good to be competitively priced. This approach is often used to value ecosystem goods, but not ecosystem services.
Replacement Cost
Considers the cost of replacing the ecosystem service with a substitute Example: Estimating the water filtration services of a wetland by estimating the cost of building a waste water treatment facility to replace these services. Data requirements: Costs, no observation of decision making required Components of value: Use value only Individual considered: Users Value metric: This is a measure of cost, not value Other comments: This is a frequent approach for ecosystem service valuation, even thought it is not a measure of true economic value.
Revealed Preference
Considers individuals’ decisions in related markets to infer the value of a non-market good. Example: There are three primary revealed preference methods Hedonic Property: Differences in housing values are used to infer the value of a non-market good. For example, housing prices bordering urban forests may be higher reflecting the buyer’s WTP for scenic views. Travel Cost: Decisions about where to recreate are used to infer the value of a non-market good. For example, an angler willing to travel further to get to an area with better water quality (and better fishing), is revealing a higher WTP for improved water quality. Defensive Behavior: Individuals’ actions to avoid damage are used to infer the value of a nonmarket good. For example, purchasing bottled water to avoid perceived health damages from poor quality drinking water reveals a positive WTP for improved drinking water. Damage Cost: Individuals’ WTP to avoid damage from pollution or floods must be higher than the cost of dealing with these damages. For example, WTP to for flood protection is at least as high as the direct and indirect cost of repairing flood damage. Data requirements: Observations of individual decisions (e.g., housing sales, recreation decisions, defensive behavior, damages, etc) Components of value: Use value only Individual considered: Depend on the method. The Hedonic Property Method only captures the benefits to homeowners, the Travel Cost Method only captures the benefits to recreational users, etc. Value metric: Damage Cost Method measures cost, not WTP; The others measure WTP Other comments: Data requirements are often overwhelming and only a subset of the population is considered.
6
Stated Preference
Ask people carefully designed questions to get them to state their willingness to pay (WTP) for a change in environmental quality Example: A mail survey asking residents how they would vote in a hypothetical referendum that would increase property taxes to provide improved water quality in their area Data requirements: Survey data Components of value: Use and non-use value Individual considered: Depends on the survey sample Value metric: WTP Other comments: This is the only approach that can capture non-use values, but these estimates are sensitive to the survey instrument and the population surveyed.
Benefits Transfer (or Value Transfer)
Adapt value estimates from previous studies to a different context. Example: Using the results of previous replacement cost, production function, revealed preference, and stated preference studies to estimate the ecosystem service value of Georgia’s forests. Data requirements: Estimates of non-market values from previous studies Components of value: Depends on the previous studies considered Individual considered: Depends on the previous studies considered Value metric: Depends on the previous studies considered Other comments: There are several approaches to benefit transfer requiring varying levels of adjustment to the transferred values. Benefits transfer is considered a second best option, as error is introduced in the transfer, but it is commonly used due to significant time and cost savings. The results are limited by the availability and applicability of previous studies.
Overview of project methodology The best approach to valuing ecosystem services depends on the scale of the study area, data availability, time and budget constraints. For this project, we are interested in a statewide analysis of ecosystem services and determined that an approach similar to the spatially explicit value transfer approach described in Troy and Wilson (2006) and used by others conducting similar research (e.g., Liu et al. 2010) to be a useful starting spot. Adapting their approach, we outlined a four-step process for estimating the public ecosystem service benefits of private forests in Georgia: 1. Identify the geographic, ecological and economic scope of the study; 2. Create a landscape classification system based on forest characteristics which predict significant differences in the flow and value of ecosystem services; 3. Use the best available data to estimate average per-acre values for each unique combination of forest characteristics and each ecosystem service identified; 4. Calculate the total ecosystem service value. These steps are briefly described here, while detailed methods and results for Steps 2, 3, and 4 are found in the next three parts of this report. Step 1: Identify the geographic, ecological and economic scope of the study 7
We are interested in the ecosystem services provided by privately-owned forestland in Georgia. In addition, we are interested only in those ecosystem services that provide external benefits, or benefits that are enjoyed by individuals that do not own or use the forestland and therefore have limited or no influence on land-use decisions. Because of this, we are not considering the value of timber and forest product provision or recreation. Timber and other forest products provide value to those who use them, but this value is captured in the market exchange of these products. The value of this service is generally a private value shared by the landowner and the consumer. Other research adequately captures the importance of the timber industry in Georgia (e.g., Riall 2010). Similarly, recreation benefits are an important aspect of the benefits provided by forests (GFC 2008), but they are largely private benefits enjoyed by users of the resource – someone with access to the land. It is likely that many private forests provide recreational opportunities to the public, but our research is focused on those services that do not require land access. Step 2: Create a landscape classification system based on forest characteristics which predict significant differences in the flow and value of ecosystem services. There are over 22 million acres of forestland in Georgia and each acre is different. Georgia’s forests are ecologically diverse, and are located in areas that are very socially diverse, meaning each acre of forest could have a unique value. For example, forests in riparian areas provide greater water quantity and quality benefits than forests farther from surface water. Similarly, urban forests are expected to provide greater benefits per acre when compared to rural forests, given their relative scarcity. However, it is not feasible to identify the value of each individual acre of forest on such a large scale. Instead, we created a landscape classification system that divides the state’s private forests into categories based on geographic, ecological, and demographic characteristics. While there may be significant differences in ecosystem service flows and values across categories, within each category forests are relatively homogenous and it is more reasonable to consider an average value per acre. Step 3: Use the best available data to estimate average per-acre values for each landscape classification and each ecosystem service identified. As described above, there are many different approaches for estimating the magnitude of environmental benefits, including market valuation, stated preference approaches, revealed preference approaches, and benefits transfer. The preferred approach depends on the type of resource being valued and whose values are being considered. Because values are resource, location, and population specific, it is always preferred to estimate values from data specific to the resource, location and population. However this is not always possible given time and budget constraints. We took two approaches in this project. First, we used value transfer methods to apply results of previous research to estimate preliminary per-acre values for most of the ecosystem services considered. This process and these values are reported in Part 3 of this report. Some ecosystem services, such as water quantity and quality, climate regulation and soil stabilization, are unrelated to the ownership classification of the land. Because of this, existing studies that consider the value of these benefits for either public (most commonly) or private (like our study is) forest lands are relevant to our current research. The primary determinants of the magnitude of these services are the biophysical properties of the forest ecosystem. However, the aesthetic and passive use value of forest land is much more sensitive to the preferences and values of the population and the ownership characteristics of the forest. For example, we would not expect the existence value of privately owned forests to be as large as that of national forests due to the expectations and assumptions people make about the management of these two types of forests. Because of this, value transfer is less reliable for these types of values. To address 8
this, we collected original stated preference data specific to Georgia’s private forests and used this data to estimate non-use benefits. Part 4 of this report describes the survey component the project and presents the results of this estimation Step 4: Calculate the total ecosystem service value The total ecosystem service value is estimated by multiplying the per-acre dollar value estimates for each landscape classification category by the number of forested acres of that type.
9
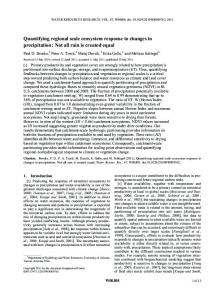
Part 2: Landscape Classification There are over 22 million acres of privately-owned forestland in Georgia. The value of ecosystem services provided by a particular acre of forestland depends on the quantity and quality of the ecosystem functions and services provided, and the magnitude, preferences, and demographic characteristics of the population receiving those services, typically the nearby population. For large scale valuation projects such as this one, it is not possible to consider each parcel of forestland separately. Instead, we develop a landscape classification system that identifies forestlands that are likely to have similar per-acre values of ecosystem services. We then estimate the value of an average acre of forests in each unique category and apply this value to all acres in that category. We considered seven different characteristics of forests expected to create differences in the flow and/or value of ecosystem services: forest type, riparian status, rare species abundance, scenic visibility, public land buffer, development class, and geographic region. Some of these characteristics primarily affect the quantity or quality of ecosystem services provided. For example, an acre of forestland in a riparian area has a much greater impact on water quality and quantity than an acre of non-riparian forest. The per-acre value of riparian forests will be higher because of this difference in the underlying ecosystem function. Other characteristics primarily affect the value of the service provided. For example, an acre of forestland in an urban area will have a greater aesthetic value than one in a rural area partly because more people are around to see it. Forest Type Forest Type refers to the dominant ecology of a parcel. Using 2005 Georgia Land Use Trends data, we identified four categories of Forest Type: Deciduous, Evergreen, Mixed, and Forested Wetland. Forest Type could affect the quantity and quality of ecosystem services provided, particularly those related to gas and climate regulation, water quality and quantity, recreation, and scenic beauty. Table 4 shows the relative abundance of each forest type in the state. A map of the forest types is shown in Figure 1. Distribution of Forest Type in Georgia. Table 4. Private forest area by Forest Type.
Forest Type
Acres
Deciduous Evergreen Mixed Forested Wetlands Total
5,457,653 11,929,870 1,124,921 3,592,174 22,104,618
Percent of all private forests 25% 54% 5% 16% 100%
10
Figure 1. Distribution of Forest Type in Georgia.
Riparian Status Forests have different impacts on water quantity and quality depending on their position within a watershed. Using DLG Hydrography data, we identified two categories of Riparian Status: Riparian and Not Riparian. Riparian includes forests within a 30 m buffer of open and moving water. Note that some areas of south Georgia are particularly important areas of groundwater recharge affecting water supply in Georgia and other states. Due to data limitations this is not considered in our current statewide analysis but should be considered on a localized basis. Table 5. Private forest area by Riparian Status.
Riparian
Acres
Riparian Non-riparian Total
3,652,037 18,452,582 22,104,618
Percent of all private forests 17% 83% 100%
11
Figure 2. Distribution of Riparian Forests in Georgia.
Rare Species Abundance Rare Species Abundance refers to the importance of a particular parcel in providing habitat for key species. We used Rare Species Records to identify three categories of Rare Species Abundance: Low, Medium, and High, based on the number of rare, threatened, and endangered species (plant and animal) found in an area. Low includes areas with 0 - 5 species (none to few), Medium includes areas with 6 – 11 species (some), and High includes areas with more than 11 species (many). Rare Species Abundance is expected to affect the quantity and quality of wildlife habitat ecosystem services provided by a parcel, thus affecting its per-acre value. We make three important notes regarding our representation of this forest attribute. First, the data used considers only species of particular conservation concern because they are rare, threatened, or endangered. Species that have cultural, recreational, or other values to human populations, but are not threatened or endangered, are not considered in these counts. Second, of all the data used, Rare Species Records use the coarsest spatial resolution, meaning that data is aggregated over larger areas. Finally, the cutoff points separating the three categories were conservatively selected by the research team. Because areas with higher Rare Species Abundance generate higher per-acre ecosystem service values, the stricter the definition of High Rare Species Abundance, the more confident we can be that our final estimates are a lowerbound on the true estimates. We were aiming for most of the private forestland to be included in the Low category, with roughly 30% in the Middle and only the top 10% in High. The discrete nature of the species count data did not allow these exact proportions, though as Table 6 shows, the final classification is very close to our original goal. Figure 3 shows the location of these categories across the state. 12
Table 6. Private forest area by Rare Species Abundance.
Wildlife Abundance Low Middle High Total
Number of Threatened and Endangered Species 0–5 6 – 11 More than 11
Acres 14,173,252 6,367,531 1,563,835 22,104,618
Percent of all private forests 64% 29% 7% 100%
Figure 3. Distribution of Rare Species Abundance in Georgia.
Scenic Visibility While the public does not necessarily have access to private forests for recreation, some forestland is more visible than others. Scenic visibility is expected to affect the quantity and quality of ecosystem services related to aesthetic value. For our study area, the most obvious predictor of visibility is proximity to major roads. Using data from the Georgia Department of Transportation, we identified two categories of Scenic Visibility: Roadside and Not Roadside. Roadside land includes land within a 30 m buffer of Interstates, ramps, State, and County Roads. This is a conservative classification, as it is likely that at least some forests greater than 30 m from the highway is visible to the public and might affect aesthetic values.
13
Table 7. Private forest area by Scenic Visibility.
Scenic Visibility
Acres
Roadside
1,257,343
Percent of all private forests 6%
Not roadside
20,847,275
94%
Total
22,104,618
100%
Figure 4. Distribution of roadside forests in Georgia.
Public Land Buffer It is well documented that the market value of private land is higher for land adjacent to public protected areas such as National Forests, State Parks, and other areas. This price premium is due to the fact that private landowners enjoy private benefits for being adjacent to protected areas. While this is one component of the value of ecosystem services, it is not one that is relevant to our current research because it is a private good. However, it is possible that private land surrounding public land provides some value beyond that captured by the private market. For example, the buffer zone might be more visible to the public if they are accessing the public land for recreation. Also, the buffer zone might protect the public land from encroachment or development pressure, thus affecting the quality or quantity of wildlife or water related ecosystem services. In this way, private land that abuts public land provides an important buffer and might generate greater quantity and/or quality of ecosystem services than other types of private forest land. For that reason, we identify two categories of Public Land Buffer: Public 14
Buffer and Not Public Buffer. The Public Buffer includes private forestland that is within a 90 m buffer of public land. Table 8. Private forest area by Public Land Buffer.
Public Land Buffer
Acres
Public land buffer Not public land buffer Total
248,687 21,855,932 22,104,618
Percent of all private forests 1% 99% 100%
Figure 5. Distribution of forests buffering private land in Georgia.
Development Status Development Status refers to housing density of an area. While the five forest characteristics already described (Forest Type, Riparian Status, Rare Species Abundance, Scenic Visibility, and Public Buffer) are expected to primarily affect the quantity (or quality) of ecosystem services provided by a representative acre of forest, Development Status affects the “price” component of our value estimates. We suggest three ways in which housing density might affect per-acre values of ecosystem services. First, the benefits of many forest ecosystem services, including pollution control, aesthetics, and non-use value are often estimated as a perperson value and then aggregated to the population receiving these benefits, often the “nearby” population. The more people living nearby, the greater the aggregate benefit to society. Second, basic economic theory suggests that the marginal value of a resource increases as the quantity of resource available decreases. Often called the “scarcity effect” in some of the value transfer literature, this implies that forests in urban areas, where forest are more scarce, provide greater value per acre than in rural areas where forested areas are relatively more common. Third, 15
people living in rural areas might have very different tastes and preference than people living in urban areas. To address these issues, we use data from Wildlands-Urban Interface and Census tracts to identify three categories of Development Status: Urban, Suburban, and Rural. Table 9. Private forest area by Development Status.
Development status Urban Suburban Rural Total
Housing density
Acres
More than 120 units/km2 25 – 120 units/km2 Less than 25 units/km2
355,571 1,352,967 20,396,080 22,104,618
Percent of all private forests 2% 6% 92% 100%
Figure 6. Distribution of Development Status in Georgia.
Geographic Region In addition to Development Status, we considered Geographic Region as one characteristic of the social aspects of forest ecosystems. We divided the state into three Geographic Regions: North Georgia, Middle Georgia, and South Georgia, based on counties. These regions are based on an aggregation of the Survey Units considered by the Forest Inventory Analysis (Harper et al. 2009). Table 10 shows the FIA survey units and counties that correspond to each of our three regions. Differences in attitudes and preferences of the population across regions could affect the per-acre value of ecosystem services, particularly scenic and non-use values. 16
Table 10. Counties by Geographic Region. Region Corresponding FIA Unit North Georgia North and North Central Survey Units
Counties Banks, Barrow, Bartow, Carroll, Catoosa, Chattooga, Cherokee, Clarke, Clayton, Cobb, Coweta, Dade, Dawson, DeKalb, Douglas, Elbert, Fannin, Fayette, Floyd, Forsyth, Franklin, Fulton, Gilmer, Gordon, Gwinnett, Habersham, Hall, Haralson, Hart, Heard, Henry, Jackson, Lumpkin, Madison, Meriwether, Murray, Newton, Oconee, Oglethorpe, Paulding, Pickens, Polk, Rabun, Rockdale, Spalding, Stephens, Towns, Troup, Union, Walker, Walton, White, Whitfield
Middle Georgia
Central Survey Unit
Baldwin, Bibb, Bleckley, Burke, Butts, Calhoun, Chattahoochee, Clay, Columbia, Crawford, Dougherty, Glascock, Greene, Hancock, Harris, Houston, Jasper, Jefferson, Jones, Lamar, Lee, Lincoln, Macon, Marion, McDuffie, Monroe, Morgan, Muscogee, Peach, Pike, Pulaski, Putnam, Quitman, Randolph, Richmond, Schley, Stewart, Sumter, Talbot, Taliaferro, Taylor, Terrell, Twiggs, Upson, Warren, Washington, Webster, Wilkes, Wilkinson
South Georgia
Southwest and Southeast Survey Units
Appling, Atkinson, Bacon, Baker, Ben Hill, Berrien, Brantley, Brooks, Bryan, Bulloch, Camden, Candler, Charlton, Chatham, Clinch, Coffee, Colquitt, Cook, Crisp, Decatur, Dodge, Dooly, Early, Echols, Effingham, Emanuel, Evans, Glynn, Grady, Irwin, Jeff Davis, Jenkins, Johnson, Lanier, Laurens, Liberty, Long, Lowndes, McIntosh, Miller, Mitchell, Montgomery, Pierce, Screven, Seminole, Tattnall, Telfair, Thomas, Tift, Toombs, Treutlen, Turner, Ware, Wayne, Wheeler, Wilcox, Worth
Table 11. Private forest area by Geographic Region.
Geographic Region
Population (2009 US Census)
Acres
North Georgia Middle Georgia South Georgia Total
6,696,788 (68%) 1,556,849 (16%)
5,793,381 6,826,896
Percent of all private forests 26% 31%
1,575,574 (16%) 9,685,744
9,484,341 22,104,618
43% 100%
17
Figure 7. Geographic Regions.
Summary of Landscape Classification Geospatial data layers were obtained through the Georgia GIS clearinghouse (http://www.gis.state.ga.us/) and projected into a common coordinate system (UTM NAD83 Zone 17). Vector layers were processed to select the appropriate attribute values and converted to raster layers at 30m cell resolution. Table 12 summarizes the data source, relevant attributes, and processing notes for the eight data layers used. Combining the forest and public/private data layers, we identified 22,104,618 acres of privately-owned forestland in Georgia. This represents almost 60% of the total land area in the state. Considering the scale of the analysis, this is almost identical to the estimate of 24.2 million acres reported in the Forest Inventory Analysis (Harper et al. 2009), supporting the accuracy of our analysis. Based on the seven forest characteristics identified above, we identified 864 possible combinations of characteristics that might describe Georgia’s private forests. These characteristics define much of the important variation in ecosystem service flow and value. In applying this classification scheme, we move from an intractable problem (trying to evaluate each of the 22 million acres of private forests separately) to a complex, but manageable one. For a given combination of forest characteristics (eg., mixed forests in North Georgia, riparian, high wildlife, non-roadside, non-public buffer, and urban), we assume each acre of forest with those characteristics produces an identical flow of ecosystem service value. However, forests with different characteristics can have different per-acre values. This is an improvement over most previous studies of this type that allow for just a few different types of forests (and often consider all forest acres as identical). Not all classes are equally represented by Georgia’s private forests. For example, there are no private forests in Georgia that are characterized as riparian, with low species abundance, 18
are visible from a highway, buffer public land, and are in an urban area of south Georgia. Of the 864 potential classes of forests, 65 include no private forestland in Georgia, and an additional 547 classes describe fewer than 1000 acres each. In contrast, over 12% of all forests in Georgia fall in a single class (rural, south Georgia, evergreen, not riparian, not roadside, not public buffer, low wildlife). Table 12. Summary of GIS Data Sources Layer Source, Date & Scale Private/ Georgia Gap Stewardship Public Land layer, NARSAL, 2003, 1:24,000 Georgia Department of Natural Resources (DNR) lands, 2009, 1:24,000 Department of Defense, Army Corps of Engineers (DOD_COE) lands; Georgia Natural Heritage Program, 2005, 1:24,000 Forest Type 2005 GLUT (Georgia Land Use Trends), NARSAL, 2005 1: 100,000 Riparian Status
DLG hydrography polygons and lines, 1996, 1:100,000
Rare Species Abundance (Rare Species Records)
USGS 1:24,000 quarter quad
Scenic Visibility (Major Roads) Public Land Buffer Development Status
Georgia DOT, 1996, 1:100,000
GA Regions
Georgia Counties
Wildlands-Urban Interface, 2000 Census Blocks, 1:24,000
Attributes Owner_code Owner_code
Processing All federal, state, county, DNR, and DOD_COE lands coded as Public, all other lands within state boundaries coded as Private; converted to 30m raster
Owner_code
Deciduous (41), Coniferous (42) and regenerating (31), Mixed (43), Forested Wetland (91) Major1 Showing number of spp (animal, plant) that are in that quad that are of conservation concern (R, T, E)0-5: Low; 611: Medium; >11: High Type = interstate, ramp, state highway, collector-distributor, county roads 90 m (3 pixels) surrounding all public lands HDEN00 = housing density per km2 in 2000
Converted to 30m raster, included 30 m (1 pixel) adjacent to water Converted to 30m raster
Converted to 30m raster
1) Urban (>120 units per km2), 2)suburban (25-120 units/km2), 3) rural - exurban put into rural (