Query Quality: User Ratings and System Predictions Claudia Hauff Franciska de Jong
University of Twente Enschede, The Netherlands
{c.hauff,f.m.g.dejong} @ewi.utwente.nl
Diane Kelly
University of North Carolina Chapel Hill, NC, United States
[email protected]
ABSTRACT
[email protected]
Related to the study conducted in this poster are two lines of research that have been investigated: (1) user ratings vs. performance and (2) inferred ratings vs. performance. Of the first line, in an experiment in the late 1990’s [6], a number of IR researchers were asked to classify TREC topics as either easy, medium or hard for a newswire corpus they were familiar with. The researchers were given the TREC topic statements, though not the search results. It was found that they were largely unable to predict the topics’ quality correctly and, surprisingly, they could also not agree among themselves on how to classify the topics. Of the second line, in [5, 7] initial experiments were performed that compared a user based measure (the median time to find a relevant document) with Clarity Score [3] and a range of pre-retrieval QPP methods [7]1 . In [5], no significant correlation was found for Clarity Score, while in [7], the best preretrieval predictor achieved a Kendall’s Tau rank correlation of τ = 0.2. However, these experiments were conducted in limited contexts, i.e. IR researchers on a small data set [6] or using time as an implicit user rating of query quality [5, 7]. Here, we conduct an investigation on a large test web collection, with users who regularly use search engines, and compare their explicit ratings of query quality against system predictions from a range of pre and post-retrieval QPP methods.
Numerous studies have examined the ability of query performance prediction methods to estimate a query’s quality for system effectiveness measures (such as average precision). However, little work has explored the relationship between these methods and user ratings of query quality. In this poster, we report the findings from an empirical study conducted on the TREC ClueWeb09 corpus, where we compared and contrasted user ratings of query quality against a range of query performance prediction methods. Given a set of queries, it is shown that user ratings of query quality correlate to both system effectiveness measures and a number of pre-retrieval predictors. Categories and Subject Descriptors: H.3.3 Information Storage and Retrieval: Information Search and Retrieval General Terms: Human Factors, Performance Keywords: Query Performance Prediction
1.
Leif Azzopardi
University Glasgow Glasgow, United Kingdom
QUERY PERFORMANCE PREDICTION
Estimating the quality (or difficulty) of a query is an important task [3, 4, 8, 9], which can aid in the development of adaptive Information Retrieval (IR) systems. For instance, if an IR system can determine which queries will perform poorly, then actions can be taken to ameliorate performance. The evaluation of Query Performance Prediction (QPP) methods has usually been performed in the context of system effectiveness (e.g., average precision); when a query results in low effectiveness, the query is considered poor or difficult, and conversely when the effectiveness is high, the query is considered good or easy. However, if we wish to develop better adaptive IR systems, it is also important to consider query quality from the user’s perspective and to determine whether the user thinks a query is hard or easy. This could be very useful when suggesting or ranking queries, by enabling the system to appropriately respond to the user’s perception. And since QPP methods are generally based on “rules of thumb” about how a user might rate a query’s performance, it is also interesting to examine whether QPP methods actually reflect the intuitions of human assessors. In this poster, we investigate whether users judge the quality of queries in accord with QPP methods, and if such methods can be used as a proxy for user query ratings.
2.
EMPIRICAL STUDY AND RESULTS
Following on from the previous experiments [5, 6, 7], we performed a similar study but with eighteen post graduate computer science students as assessors using the most recent TREC test corpus: ClueWeb09 (cat. B) [2], a 50 million document crawl of the Web from 2009. We utilized the fifty topics of the TREC 2009 Web adhoc retrieval task2 which consist of a query part (to be submitted to the IR system) and a description (the information need). In this study, we provided the assessors with the queries and descriptions and instructed them to judge on a scale from 1 (poor quality / hard) to 5 (high quality / easy), what they expect the search result quality to be, if the queries would be submitted to a Web search engine. Note, that the queries were not actually submitted to a search engine. On the system side, we indexed the corpus with the Lemur Toolkit3 , with Porter stemming and stopword removal applied. For retrieval, we used a Language Model with Dirich1
A pre-retrieval QPP method estimates a query’s quality before the retrieval stage (it relies on corpus statistics), while a post-retrieval QPP method exploits the ranked lists of results to form an estimate. 2 One topic (wt09-20) has no relevant documents and is thus ignored. 3 http://www.lemurproject.org/
Copyright is held by the author/owner(s). SIGIR’10, July 19–23, 2010, Geneva, Switzerland. ACM 978-1-60558-896-4/10/07.
743
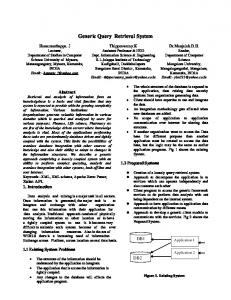
Pre/Post Ret. Predictors MaxIDF SumSCQ SumVAR Clarity Score Query Feedback Query Commit.
let Smoothing (µ = 1000). The retrieval effectiveness was measured by estimated average precision (AP) and estimated precision at 30 documents (P@30), two new TREC measures [1]. For system effectiveness predictions we used three pre-retrieval QPP methods: Max. Inverse Document Frequency (MaxIDF ), Summed Term Weight Variability (SumVAR) [8] and Summed Collection Query Similarity (SumSCQ) [8], as well as three post-retrieval methods: Clarity Score [3], Query Feedback [9] and Query Commitment [4]. Note that the pre-retrieval predictors are parameter-free, while the post-retrieval predictors were evaluated over a range of parameters4 . Assessor Ratings: To investigate how well ratings of query quality matched system performance, we examined the correlation between the assessors’ ratings and AP5 . We found that on average across all assessors, the rank correlation was τ = 0.33†, while the worst/best correlation between ratings and AP was τ = 0.20 and τ = 0.48†, respectively6 . To examine this more deeply, we split the set of queries into five equal partitions given the system measures (ordered from high to low). We then averaged all assessor ratings for the queries within each partition. Table 1 shows that the assessors tended to rate the better performing queries higher than the poorly performing queries for both AP and P@30. This indicates that on average assessor ratings were in line with system measures. However, the ratings of query quality among assessors varied considerably, leading to a rather low inter-rater agreement. When comparing all pairs of assessors, we observed a maximum κ = 0.54 (linearly weighted Cohen’s kappa); the average agreement between all pairs of assessors reached κ = 0.36. Query Partitions Top Ten To Bottom Ten
Performance AP P@30 0.414 0.629 0.298 0.470 0.099 0.272 0.032 0.133 0.005 0.038
Performance AP P@30 0.35† 0.19 0.39† 0.35† 0.42† 0.38† 0.27† 0.18 0.37† 0.29† 0.26† 0.11
Assessor Ratings Min Avg Max −0.09 0.09 0.29† 0.20 0.31† 0.49† 0.17 0.28† 0.43† −0.10 0.02 0.19 0.12 0.28† 0.44† −0.15 0.01 0.18
Table 2: Kendall’s Tau correlations: QPP methods vs. performance, and vs. assessor ratings (shown are minimum, average and maximum correlation). of inter-rater agreement between the assessors, we report the minimum, average and maximum correlation between ratings and predictions. The highest correlations were observed between assessor ratings and the pre-retrieval predictions by SumSCQ. This predictor assigns higher quality scores to more specific queries and was the best indicator of assessor ratings of query quality among all the predictors we evaluated. Although SumSCQ yields significant correlations with most assessors, the correlations are only moderate, at best. Of the evaluated post-retrieval predictors, only Query Feedback resulted in significant correlations when the best parameter was selected.
3.
DISCUSSION AND FUTURE WORK
In this poster, we explored the relationship between explicit user ratings by assessors and the system predictions of a number of QPP methods. We found that assessor ratings of query quality are significantly correlated to the predictions of pre-retrieval predictors, but not consistently to post-retrieval predictors. However, while some QPP methods provide a better explanation of user ratings than others, the relationship is still quite weak (with moderate correlations at best). This suggests that current QPP methods are unlikely to be adequate proxies of user ratings. Since most QPP methods only utilize system side information, perhaps there are gains to be had by developing more sophisticated methods/models of query performance prediction that include the user and their state of knowledge in the process. In future work, we will investigate these findings in more detail and also consider how the amount of information provided to the user and the QPP method affects their ability to accurately predict the quality of a query.
Assess. Ratings vs. AP P@30 3.87 (1.07) 4.00 (1.01) 3.72 (1.09) 3.53 (1.20) 3.24 (1.37) 3.31 (1.29) 2.79 (1.20) 2.89 (1.33) 2.51 (1.48) 2.40 (1.34)
Table 1: Avg. performance given partitions based on AP and P@30 respectively (columns 2&3); average (std. dev.) assessor ratings given partitions based on AP and P@30 respectively (columns 4&5). QPP - System Predictions: Table 2 reports the correlation between the system predictions made by each QPP method and system performance (columns 2&3). The most striking result is that the pre-retrieval predictors (SumSCQ and SumVAR) obtained the highest correlations with system performance. This contrasts previous findings obtained on older test collections [3], where it is post-retrieval QPP methods that exhibit higher correlations. We suspect that the post-retrieval methods are adversely affected by the content of the web pages in ClueWeb09 (i.e. they contain a lot of non-informative content, like ads, links, menus, etc.). Ratings vs. Predictions: Finally, we compared the assessor ratings against the QPP system predictions (Table 2, columns 4-6 show these correlations.). Due to the low level
4.
REFERENCES
[1] J. Aslam, V. Pavlu, and E. Yilmaz. A statistical method for system evaluation using incomplete judgments. In SIGIR ’06, pages 541–548, 2006. [2] C. L. Clarke, N. Craswell, and I. Soboroff. Prelim. report on the TREC 2009 Web Track. In TREC 2009 Notebook Papers, 2009. [3] S. Cronen-Townsend, Y. Zhou, and W. B. Croft. Predicting query performance. In SIGIR ’02, pages 299–306, 2002. [4] A. Shtok, O. Kurland, and D. Carmel. Predicting query performance by query-drift. In ICTIR ’09, pages 305–312, 2009. [5] A. Turpin and W. Hersh. Do clarity scores for queries correlate with user performance? In ADC ’04, pages 85–91, 2004. [6] E. Voorhees and D. Harman. Overview of the sixth text retrieval conference. In Proceedings of the TREC 6, 1997. [7] Y. Zhao and F. Scholer. Predicting query performance for user-based search tasks. In ADC ’07, pages 112–115, 2007. [8] Y. Zhao, F. Scholer, and Y. Tsegay. Effective pre-retrieval query performance prediction using similarity and variability evidence. In ECIR ’08, pages 52–64, 2008. [9] Y. Zhou and W. B. Croft. Query performance prediction in web search environments. In SIGIR ’07, pages 543–550, 2007.
4
For post-retrieval predictors, we report the highest correlations obtained given the parameters. 5 Results were similar for P@30, where the min., avg. and max. correlations were τ = 0.23, 0.36†, and 0.47†, respectively. 6 Based on Kendall’s Tau’s rank correlation coefficient, significant correlations (p < 0.01) are marked with †.
744