Oct 4, 2006 - A main feature of R-php is that all the statistical analyses exploit the open-source statistical programming environment R (R Development Core ...
JSS
Journal of Statistical Software October 2006, Volume 17, Issue 4.
http://www.jstatsoft.org/
Using R via PHP for Teaching Purposes: R-php Angelo M. Mineo
Alfredo Pontillo
Universit` a di Palermo
Universit`a di Palermo
Abstract This paper deals with the R-php statistical software, that is an environment for statistical analysis, freely accessible and attainable through the World Wide Web, based on R. Indeed, this software uses, as “engine” for statistical analyses, R via PHP and its design has been inspired by a paper of de Leeuw (1997). R-php is based on two modules: a base module and a point-and-click module. R-php base allows the simple editing of R code in a form. R-php point-and-click allows some statistical analyses by means of a graphical user interface (GUI): then, to use this module it is not necessary for the user to know the R environment, but all the allowed analyses can be performed by using the computer mouse. We think that this tool could be particularly useful for teaching purposes: one possible use could be in a University computer laboratory to permit a smooth approach of students to R.
Keywords: statistical software, R, PHP, graphical user interface.
1. Introduction R-php is a project developed within the Department of Statistical and Mathematical Sciences of the University of Palermo (Italy); this project aims the realization of a web-oriented statistical software, i.e. a software that the final user reaches through Internet and that for its running requires only the installation of a browser, that is a program for the hypertext visualization. R-php is an open-source project with the code released by the authors with a General Public License (GPL) and can be freely installed (see Section 2). The idea to design a statistical software that can be used through Internet comes out from the following considerations: the growing spread of Internet and the request of new services from its users have changed and still are radically changing the way to access the daily use structures (work, study, and so on); most information and services go through the web and the software philosophy goes to the same direction: in the database management software an
2
Using R via PHP for Teaching Purposes: R-php
example is the package PhpMyAdmin, that is a via web graphical interface to MySQL, the most used database management system for web-oriented applications, while in the business field another example of the use of the web is the development of home-banking services. In general, the trend of producing software that are installed in a single personal computer is going down, in favour of software that can be used by means of a connection to Internet and a browser. A main feature of R-php is that all the statistical analyses exploit the open-source statistical programming environment R (R Development Core Team 2006), that is more and more used not only from the academic world, but also from consulting firms (Schwartz 2004). Then, R-php is classifiable among the web projects dedicated to R. Beside this project, there are others such as: Rweb, R PHP ONLINE, and so on (see http://franklin.imgen.bcm.tmc. edu/R.web.servers). Shortly, the main difference between R-php and the previously cited projects consists in the presence of an interactive module (R-php point-and-click) inside Rphp, that allows the user to make some of the main statistical analyses even if he does not know the R statistical environment. The R-php installation in a server is possible in numerous popular server platforms, such as Linux, Solaris, AIX or MacOS X and for its correct running the installation of some additional software is required (see Section 3); the client side use is cross/platform and the only requirement is a browser supporting forms and the Javascript language. The potential users of R-php are several: for example, let’s think about students, either within didactic facilities, such as computer laboratories, or at home by means of a simple Internet connection, or a user that does not know and does not want to learn a programming environment as R, but wants to make some simple statistical analyses without buying the license of an expansive commercial statistical software with a developed graphical user interface. In this paper, we show how to install R-php with a description of the software required to set up an R-php server. Then, we give a description of the two R-php modules, R-php base and R-php point-and-click and we show how to use these two modules. A section with a comparison with some other similar projects is also considered. Finally, we give an example of use of a GUI of the R-php point-and-click module.
2. How to install R-php In this section, we see how to install R-php in an Apache server, while in the next section we shall describe the required software for a correct running of R-php. With no loss of generality, to point out the steps necessary for the installation, we refer to a “LAMP” system, i.e. a computer with a Linux operating system, with an installed Apache web server and with MySQL and PHP. After downloading the R-php-xxx .tar.gz source file from the web site http://dssm.unipa. it/R-php, or from http://r-php.homelinux.net, we have to follow these steps to set up a R-php server: 1. obtain the super user (root) privileges; 2. copy the source file in the Apache home directory: for example, by opening a console and by going to the directory where the file R-php-xxx .tar.gz is, it is sufficient to execute the following command:
Journal of Statistical Software
3
• for a RedHat based distribution ]\# cp R-php-xxx.tar.tgz /var/www/html/ • for a Debian distribution ]\# cp R-php-xxx.tar.tgz /var/www/ 3. extract the files contained in the R-php-xxx .tar.gz file, for example with the following command: ]\# tar xvzf R-php-xxx.tar.gz Now, the user can find the R-php-xxx directory starting from the home directory of the Apache server: this directory includes all the software; 4. enter the R-php-xxx directory with the following command: ]\# cd R-php-xxx This directory has the following components: • COPYNG (file containing the user license); • Doc (directory containing the documentation); • include (directory containing the configuration files); • index.html (home page); • R (directory containing R-php base); • README (file containing some basic information about the software); • R-gui (directory containing R-php point-and-click); 5. enter the include directory with the following command: ]\# cd include 6. edit the conn.php file, by modifying the fields with the necessary data to have the access to a MySQL database (user-id and password). Now, with any browser it is sufficient to load the site http://localhost/R-php-xxx/ or the site http://your-domain/R-php-xxx to run R-php.
3. Some required software In this section, we describe the software required to implement a R-php server. We want to point out that all the used software is open-source. For a correct running of R-php, it is necessary to install the following software in the server: • Apache The Apache server: – is a powerful, flexible, HTTP/1.1 compliant web server; – implements the latest protocols and is actively being developed; – is highly configurable and extensible with third-party modules;
4
Using R via PHP for Teaching Purposes: R-php – can be customized by writing “modules” using the Apache module API (Application Programming Interface); – provides full source code and comes with an unrestrictive license; – runs on several operating systems. Nowadays, Apache is considered the most efficient, fast and functional web server; according to data given by Netcraft (2006), Apache is the most used web server all around the World, with a percentage of use equal to 61.44% (this result is referred to October 2006). • R R is a language and an environment for statistical computing and graphics; it is a GNU (GNU stands for GNU is Not Unix) project and is similar to the S language and environment, which was developed at the Bell Laboratories, formerly belonging to AT&T and now to Lucent Technologies, by John Chambers and colleagues1 . R can be considered as a different implementation of S. There are some important differences between R and S, but much code written for S runs unaltered under R. R provides a wide variety of statistical (linear and nonlinear modeling, classical statistical tests, time-series analysis, classification, clustering, and so on) and graphical techniques and is highly extensible. One of R’s features is the ease with which well-designed publication-quality plots can be produced, including mathematical symbols and formulae where needed. R compiles and runs on a wide variety of UNIX platforms and similar systems (including FreeBSD and Linux), Windows and MacOS. • PHP PHP is an HTML-embedded scripting language, i.e. a language that allows to insert executable code inside HTML pages. Much of its syntax is borrowed from C, Java and Perl with a couple of unique PHP-specific features thrown in. The goal of PHP is to allow web developers to write dynamically generated pages quickly. PHP stands for PHP Hypertext Preprocessor and then its name is a so called recursive acronym. • MySQL MySQL is a relational database management system. The main feature of a relational database is the capacity to store data in separate structures, called tables, rather than putting all the data in one big area. The SQL part of MySQL is the acronym for Structure Query Language, which is the most common language used to access database. The MySQL database server is the most popular open-source database in the World; its diffusion is due to its great speed and flexibility; it is exactly the speed to access data that makes MySQL suitable for the implementation of web applications. • ImageMagick ImageMagick is a collection of tools and libraries to manipulate images. ImageMagick can read, write and manipulate image in any of the most popular image formats, including .gif, .jpeg, .png and .pdf; moreover, it is possible to create .gif graphs dynamically, making it suitable for web applications. The main feature of ImageMagick, that makes it a necessary tool to manipulate images also for web applications, is the
1 On 1998 for the S language development John Chambers has received the ACM Software System Award (see http://www.acm.org/awards/ssaward.html).
Journal of Statistical Software
5
possibility to make all the operations by “shell”, for example the BASH (Bourne Again SHell). As it is known, R has several commands to create images of different formats (.png, .jpeg, .ps, and so on), but in R-php base the use of ImageMagick has been more easily manageable to create .png graphs. Moreover, according to the R FAQ 7.19 (Hornik 2005), under UNIX the R’s .png device uses the X11 driver, which is a problem in batch mode or for remote operation. The use of ImageMagick in the base module has been extended also to R-php point-and-click. Then, R, invoked in “batch mode”, returns graphs in .ps format; following, it is reported the PHP code to manipulate and to convert the .ps graphs in the .png format by using the convert command of ImageMagick: exec("convert ./pages/tmp/$temp/Rplots.ps ./pages/tmp/$temp/R.png"); exec("convert -antialias -rotate 90 $fn ./pages/tmp/$temp/$nn.png"); To execute these commands, it is necessary to install also Ghostscript (even though in R-php it is not invoked directly, but only by means of ImageMagick). Ghostscript is an interpreter for the PostScript language and is necessary to manage properly the .ps graphs. • htmldoc htmldoc is a program that generates indexed .html, Adobe PostScript, and .pdf files from .html source files. htmldoc includes a simple GUI to manage .html files and automatically (re)generate files for viewing and printing. htmldoc can also be used in a web server to generate files “on-the-fly”. For the above described software it is wise to have the last versions of each software and anyway it is necessary to have installed: for PHP a version starting from the 4.3.0 and for R a version starting from 2.0.0.
4. Description of R-php In this section, we describe some design features of the two modules of R-php, by showing some chunks of PHP code used in R-php.
4.1. Description of R-php base When a user goes to the home page of this module, a temporary directory is created; the name of this directory is generated by this portion of code: $unico = substr(uniqid("5555"),-5); $time = time(); $max = mktime(6, 0, 0, 1, 1, 1970); $temp = $unico."_".$time; According to the implemented code, first a pseudo-random string of alpha-numeric characters is generated, to which the “UNIX timestamp” is associated. Into this temporary directory we have all the files that are created during the current working session; this guarantees the
6
Using R via PHP for Teaching Purposes: R-php
multiuse, i.e. the concurrent use of more users, with no confusion between the files created in different concurrent sessions. This feature of R-php does not seem to be implemented in other similar systems. The maximum number of concurrent users does not depend on R-php, but depends on the set up of the hosting Apache server. Instead, the speed of R-php depends, mainly, on the user’s connection speed. Next, there is the PHP code that compares the current “UNIX timestamp” with that present in the temporary directory name: those directories that are in the server for more than six hours are deleted; this allows to avoid a great number of temporary directories into the server: $dirTmp = glob("./pages/tmp/*"); if(is_array($dirTmp)){ foreach($dirTmp as $dir){ $time_scad_temp = explode("_", $dir); $control = $time - $time_scad_temp[1]; if($control>=$max){ delfile("$dir/*"); rmdir("$dir"); } } } mkdir("pages/tmp/$temp", 777); chmod("pages/tmp/$temp", 0777); The R-php base allows the input, in a text area, of portions of R code, that is transcribed in a text file. Next, there is the sequence of PHP instructions that allows this operation: $nomefile = "codice.txt"; $fp = fopen("./pages/tmp/$temp/$nomefile", "w") or die("impossibile aprire file"); fputs ( $fp, "$codice") or die("impossibile scrivere"); fclose($fp); As it is known, R has commands that allow the interaction with the operating system of the computer used; this could be dangerous in such an environment, because a malicious user could input harmful commands. To avoid this drawback, we have decided to implement a control structure that does not allow the use of a set of commands, that we think are dangerous for the server safety. These commands are reported in a MySQL database, containing also a short description of what the banned command would do. Anyway, a user interested in installing a R-php server can modify this list of commands. For the data input, besides the possibility to input the data “at hand” through the R commands, there is the possibility to import data from a text file. From a technical point of view, this operation is an upload on the server, by using the following sequence of PHP commands: if(isset($_POST[’upFile’]) and $_POST[’upFile’] = "yes"){ include("./include/temp.php"); $nomeFile = pulisci($_FILES[’file’][’name’]);
Journal of Statistical Software
7
move_uploaded_file($_FILES[’file’][’tmp_name’], "./pages/tmp/$_SESSION[temp]/$nomeFile"); } The R commands contained in the previously created text file are processed by R, that is invoked by PHP in batch mode. The command for this operation is the following: exec(R -q --no-save < codice.txt > result 2>&1); R gives the output in two formats: the former is a textual one with the requested analysis, the latter is in .ps format, containing all the possible graphs. At this point, the two files are treated in two different ways: • the text file is simply formatted (by using “style-sheets”) to make it more readable in the web; • the .ps file is split to obtain a file for each image; then, each image is converted in .png format; these operations are done by ImageMagick. At last, the output is visualized in a new window. In this window there is the possibility for the user to save only the desired graphs produced in the working session or to save all the output in .pdf by means of the software htmldoc. The command used to save the output in .pdf format is: exec("htmldoc --webpage --fontsize 12 --textcolor 000099 -f output_R-gui.pdf result.html");
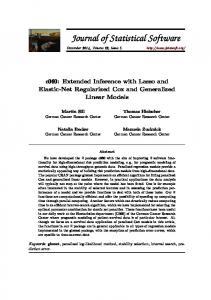
4.2. Description of R-php point-and-click The R-php module described in this section is not a simple R web interface, but it has all the features of a developed GUI; and this is what makes R-php original with respect to other similar projects. The organization of the concurrent sessions of this module is the same of that of the R-php base module, described in the previous section. As far as the data input is concerned, this is the first step to use R-php point-and-click and it is done by loading an ASCII file from the user computer. Then, the file content is visualized in a new page as a spreadsheet; this data set is managed by MySQL: this allows to make some interactive operations on data: for example, it is possible to modify the names of the variables or the value of each cell of the spreadsheet (see Figure 1); MySQL supports very large amounts of data, but for the purposes of R-php, i.e. teaching purposes, we suggest the use of medium/small data sets. Next, there is the PHP and MySQL code to modify the value of a cell: $sql = "UPDATE $temp SET var$v = ’$val’ where id=’$r’"; mysql_query ($sql, $conn);
8
Using R via PHP for Teaching Purposes: R-php
Figure 1: R-php point-and-click: pop-up to modify the value of a single cell. The conversion of the file containing the data set to a database raises issues concerning the data type. Indeed, it is impossible at this time to define the type of a variable, i.e. if a variable is a nominal, or ordinal, or numeric variable; when in a R-php point-and-click GUI some types of variables are necessary (such as in the case of the analysis of variance GUI), we have “forced” those variables to be of the “right” type. Anyway, we think to enhance the R-php point-and-click module by providing a tool to specify the data type. After the loading of a data set, it is possible to choose what kind of analysis we have to perform among those proposed. It is possible to make the following statistical analyses, so far: Descriptive Statistics, Linear Regression, Analysis of Variance, Cluster Analysis, Principal Component Analysis, Factor Analysis and Metric Multidimensional Scaling. Each analysis can be performed by means of a GUI; in each GUI, it is possible to choose the analysis options that the user wants to set up; these options are coded in R and this code is processed by the R environment. At this time of the R-php development, it is not possible for the user to create a new GUI, but programming it in PHP. A user that wants to create a new GUI can be inspired by one of the files contained in the HOME /R-gui/pages/result/ directory. As output, a web page is generated; this page contains the textual and graphical results of the performed analysis. Moreover, the output page allows other interesting operations, such as the output saving, including the graphs, in .pdf, the saving of each single graph by means of a simple click and the saving of the R code used for the current analysis (this can be useful in a class to show to students the underlying R code used). We are not going to describe each GUI of R-php point-and-click, because from a design point of view the implemented code is formally the same for each GUI.
5. Some web server projects using R In this section, we describe some interesting web server projects using R and we shortly show the main differences of these projects with respect to R-php (there are other similar projects worthy of mention; for more details about server projects based on R the reader can visit the web page: http://franklin.imgen.bcm.tmc.edu/R.web.servers/; in this page, the reader can also find information on the projects cited in this paper):
Journal of Statistical Software
9
• Rweb Rweb (Banfield 1999) is probably the oldest project of this kind and it has been the start up of many web-oriented applications using R as “engine”. Rweb is composed by two parts that require a different knowledge of the R environment. The first part is a simple R interface that works properly with many browsers. The use of this module requires the knowledge of the R environment. The main page has a text area where the user inputs R code and, by clicking on the “submit” button, the software gives the output page, included possible graphs. The second part, called Rweb modules+, is designed as a point-and-click interface and to use this part the user could not know the R programming language. The current implemented analyses include regression, summary statistics and graphs, ANOVA, two-way tables and a probability calculator. Among the projects considered, Rweb seems for some aspects the most similar to R-php. The aspects that distinguish R-php from Rweb are, for example, the following: R-php gives more analyses that a user can perform by means of the point-and-click module, presents more tools to manage the output, such as the possibility to save it in a .pdf format, and a better management of the graphs. • CGIwithR CGIwithR (Firth 2003) is a package which allows R to be used as a CGI (Common Gateway Interface) scripting language. Basically, it gives a set of R functions that allows any R output to be formatted and then used with a web browser. Although CGIwithR is oriented to the realization of web pages containing R output, this project is different from R-php that, on the contrary, is a R front end exploiting its features by calling R in batch mode by means of a GUI. • Rpad Rpad (Short and Grosjean 2005) is a web-based application allowing the R code input and the output visualization by means of a web browser. Rpad installs as an R package and can be run locally or can be used remotely as a web server. If a user wants to use Rpad as a service, he has to open R and then he needs to load the Rpad package and to run the Rpad() function that activates a mini web server; moreover, a new web session is started up by using the default browser and by showing the Rpad interactive pages. Shortly, Rpad allows the use of R by means of a browser (both locally and remotely), but anyway requires the knowledge of the R language; in this way, it can be compared only with the R-php base module. • R PHP ONLINE R PHP ONLINE, developed by Steve Chen at the Department of Statistics in Taipei (Taiwan), is a PHP web interface to run R code on line, including graphic output. Shortly, it allows to insert code and to visualize the output by means of a web browser. It allows also the visualization of the graphs, but this operation is not so easy; in the project web site (http://steve-chen.net/R_PHP/) the author suggests different ways to do it; surely, the most instinctive method seems to be the following: add the functions bitmap() and dev.off() before and after the real function call which generates the graph; in this way, only one graph at once can be generated. R PHP ONLINE does not have a point-and-click module and then it can be compared only with the R-php base module. The latter is, anyway, more “user friendly”, when a user has to produce graphs; indeed, in R-php base it is possible to use directly the R graph functions, even
10
Using R via PHP for Teaching Purposes: R-php when there are several graphs to produce.
R-php point-and-click can be also seen as a GUI for R; then, we want to cite just two of all the contributed GUI for R (for more details about projects for contributed GUI for R, the interested reader can see the following URL: http://www.r-project.org/GUI): • R commander The R commander (Fox 2005) is a basic-statistics graphical user interface provided by the Rcmdr package. According to the author, “the design objectives of the R commander were as follows: to support, through an easy-to-use, extensible, cross-platform GUI, the statistical functionality required for a basic statistics course [...], to make it relatively difficult to do unreasonable things; and to render visible the relationship between choices made in the GUI and the R commands that they generate”. The R commander is based on the tcltk package, which provides an R interface for the Tcl/Tk GUI toolkit. • JGR JGR (Helbig, Urbanek, and Theus) is a Java GUI for R. According to the authors, “JGR features a build in editor with syntax highlighting and direct command transfer, a spreadsheet to inspect and modify data, an advanced help system and an intelligent object navigator, which can, among other things, handle data set hierarchies and model comparisons. JGR also allows to run parallel R sessions within one interface. Since JGR is written in Java, it builds the first unified interface to R, running on all platforms R supports.” These projects provide GUI that are better than R-php point-and-click, but both these projects are not based on a web-server; then, from a design point of view they are very different from R-php.
6. How to use R-php In this section, we see how to use the two modules of R-php.
6.1. Use of R-php base This interface allows the simple editing of R code in a form. This module provides most of the R facilities for the web user: indeed, it is necessary to know the R language to use it. Moreover, it is possible to import a data file (a text file) from the user’s computer. The parts of R-php base that a user can handle are: • The text area to submit R code In this part of the web page the user can edit the R code needed to perform a statistical analysis. The use of R commands interacting with the operating system is not allowed; when the user edits one of the banned commands, no code is executed and an error window appears, warning the user that in the input code there is a forbidden command; in the same window the banned command list is visualized with a short description of each command. The code can be directly edited, or it could be paste from other programs, of course;
Journal of Statistical Software
11
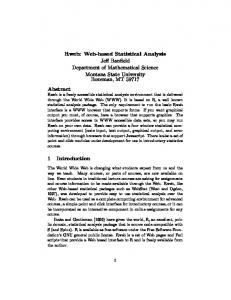
Figure 2: Output of R-php base. • The “send” button When the user has completed the R code input in the text area, it is sufficient to click on this button and the input code is processed by R. • The “reset” button If the user decides to input a new code in the text area, the “reset” button allows to clean up the text area. • The text form If the user wants to use a data set contained in a text file to perform a statistical analysis, he can edit the file path in this form, or more easily he can click on the “browse” button and select the file from the “file loading” window; after the user has loaded the data set, in the text area we have the R code needed to load the chosen data set. Now, the user has only to click on the “send” button to obtain the output of the R code in a new window; in this window there are also all the generated graphs. In the output window there is the possibility to save the analysis results in .pdf by clicking on the suitable link (see Figure 2).
6.2. Use of R-php point-and-click To use this module it is not necessary for the user to know the R environment, but all the allowed analyses can be performed by means of the computer mouse.
12
Using R via PHP for Teaching Purposes: R-php
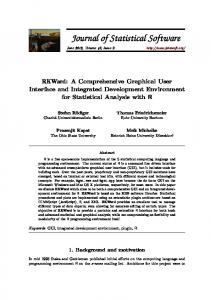
Figure 3: R-php point-and-click: view of an imported data set.
To perform an analysis with this module, it is necessary to load a data file from the computer; this procedure is exactly the same of the one described for the R-php base module. The import of the text file does not present many problems; different delimiters are supported (comma, tabulation, space, and so on) and files with no special characters are correctly imported. Moreover, it is necessary to specify the presence or not of the names of the variables in the first row of the data set, by choosing “yes” or “no”, respectively, in the box of the “header” form. Then, data are placed in a spreadsheet (see Figure 3). An interesting feature is the possibility to modify the content of every single cell of the spreadsheet, included the names of the variables, through a pop-up window that allows such modification. In the top of the window, there are buttons to perform several kinds of statistical analyses. If the user modifies the data set, it is possible to save this new data set in the user’s computer as a text file. By choosing a data set, it is possible to perform the statistical analyses available; if the user would like to perform an analysis with a new data set, it is not possible to use the browser options, but it is necessary to use the suitable link to load a new data set: if a user uses unwillingly the “back” browser button, he does not obtain the desired effect, but has the previous imported data set. Then, after we have imported a data set, it is possible to perform the desired analysis. For all the analyses, in the output page there is the possibility to save the output in a .pdf file, to save every single graph or to save the R code used for the analysis.
Journal of Statistical Software
13
Now, we give some basic information about every single analysis that is possible to perform with R-php point-and-click.
Descriptive analysis In the current software version it is possible to compute the following descriptive statistics: minimum, maximum, arithmetic mean, median, quartiles, standard deviation and variance. By clicking the “send” button, a new window opens, containing the descriptive statistics computed for every selected variable. If the user does not select any variable, or any descriptive statistics, by clicking the “send” button an error message is shown; this message invites the user to select at least one variable and one descriptive statistic.
Linear regression By choosing the linear regression GUI, there is a text area where it is possible to input the model formula, by using the R syntax, i.e. the symbolic description of linear model based on Wilkinson and Rogers (1973). Actually, it is not necessary for the user to input the model formula directly, but he can choose to click on the “model” button opening a new window, where it is possible to choose the response variable and the explanatory variables, among those of the loaded data set. In this window, we have implemented some checks, so: • it is not possible to choose no response variable or more than one; • it is necessary to choose at least one explanatory variable; • the same variable can not be chosen as a response and explanatory variable. After the response and the explanatory variables have been chosen, by clicking on the “insert” button this window is closed and the chosen model formula is written in the text area of the previous window. If a user edits a dangerous command in the text area, the code is not executed and an error message appears with the possibility to visualize the banned command list. Now, by clicking on the “send” button, the requested regression analysis is performed. The analysis results are visualized in a new output window containing: • the main descriptive statistics computed on the variables involved in the model; • the variance and covariance matrix; • the correlation matrix; • the main regression analysis results; • a scatterplot matrix of the involved variables; • the graphs of the analysis of residuals to check the basic hypotheses for the model adequacy, for the normality of the random part of the model, for the homoskedasticity and for determining possible outliers (plot of Cook’s distances).
14
Using R via PHP for Teaching Purposes: R-php
Figure 4: Window to select interactions in the analysis of variance GUI.
Analysis of variance The window of this GUI is very similar to the linear regression one; also in this GUI, besides the previously loaded data set, there is a text area where it is possible to input the model formula, by using the R syntax (see Wilkinson and Rogers 1973). Actually, it is not necessary for the user to input the model formula directly, but he can choose to click on the “model” button opening a new window, where it is possible to choose the response variable and the explanatory variables among those of the loaded data set. If the explanatory variables are numeric, the implemented code forces these variables to factors to perform the analysis of variance. In this window we have implemented some checks that are very similar to those described for the linear regression GUI. After the response and the explanatory variables have been chosen, this window is closed and the main window appears slightly modified. In particular, under the text area where the model formula is inserted, the levels of the chosen factors are shown. Close to the “model” button, a new button is shown, giving to the user the possibility to insert possible interactions in the model (see Figure 4). Now, the user can perform the analysis of variance with the chosen model by clicking on the “send” button. Then, the output window with the main results is shown. When a multi-way analysis of variance with all the interactions is performed and there is only one observation per cell, the error has zero degrees of freedom with a consequent loss of validity of the related F tests. In these cases, R-php point-and-click stops the running code and gives an error message explaining the problem to the user. At this point, the user is advised to go back to the GUI main window, by re-inputing the model formula without the highest order interaction, at least.
Cluster analysis By clicking on the “cluster analysis” button, there is the possibility to choose what kind of algorithm we want to use, if a hierarchical one or the k-means algorithm. If we choose “hierarchical”, the related window has a form where, first of all, we have to select the variables from the data set: some checks have been implemented, so it is not possible, for example, to select less than two variables. Moreover, we can set other options, that is: • if we want to use standardized variables;
Journal of Statistical Software
15
• the distance measure to use (the implemented options are: “euclidean”, “maximum”, “manhattan”, “camberra”, “binary” and “minkowski”); • the agglomeration method (the implemented options are: “ward”, “single”, “complete”, “average”, “mcquitty”, “median” and “centroid”); • the number of groups or the height of the dendrogram (these two options can not be selected simultaneously and each one produces a red straight line in the output dendrogram to give the required number of groups or to cut the dendrogram at the specified height, respectively); • if we want to see in the output the used distance matrix. The analysis results are visualized in an output window containing: • the distance matrix (if this option has been selected); • the cluster which each unit belongs to (if the option “number of groups” or “height of dendrogram” has been selected); • the number of units in each cluster (if the option “number of groups” or “height of dendrogram” has been selected); • the cluster dendrogram; • a graph of the height of the dendrogram versus the number of groups. If we choose “kmeans”, also in this case the related window has a form where, first of all, we have to select the variables from the data set, with a check for the number of the selected variables. Moreover, we can choose: • if we want to use standardized variables; • the maximum number of iteration allowed for the algorithm used (the default value is 10); • the number of groups (if no number is input, an error message is shown). The analysis results are visualized in an output window containing: • the cluster which each unit belongs to; • the number of units in each cluster; • the values of the cluster centers; • the within-cluster sums of squares; • a scatterplot matrix with the obtained clusters.
16
Using R via PHP for Teaching Purposes: R-php
Principal component analysis To perform a principal component analysis, it is possible to choose if we want to use the original data set or a correlation matrix (or variance and covariance matrix). In the first case, the GUI has a form where we have to select the variables from the data set; it is not possible to select less than two variables. The analysis results are visualized in an output window containing: • a summary of the results, including the explained proportion of variance; • the correlation matrix or the variance and covariance matrix, depending on what the user has selected; • the eigenvalues and the eigenvectors; • the loadings and the scores (if selected); • a biplot with the first two principal components; • a screeplot. If we want to use as data input a correlation matrix or a variance and covariance matrix, first of all we have to upload the text file containing this matrix. Then, we can choose if we want the output to have the loadings. The resulting output presents the same things as the previous case, but the eigenvalues, the eigenvectors, the scores and the biplot.
Factor analysis To perform a factor analysis, it is possible to choose if we want to use the original data set or a variance and covariance matrix. In the first case, the GUI has a form where, first of all, we have to select the variables from the data set; it is not possible to select less than three variables. Moreover, we can choose the number of factors, the type of scores and the rotation method. The analysis results are visualized in an output window containing: • a summary of the results, including the explained proportion of variance and the loadings; • the correlation matrix; • the eigenvalues and the eigenvectors. If we want to use as data input a variance and covariance matrix, first of all we have to upload the text file containing this matrix. Then, we can choose the number of factors and the rotation method. The resulting output presents the same things as the previous case.
Metric multidimensional scaling To perform a metric multidimensional scaling, it is possible to choose if we want to use the original data set or a distance matrix. In the first case, the GUI has a form where we have
Journal of Statistical Software
17
to select the variables from the data set; it is not possible to select less than two variables. Moreover, we have to choose the distance measure to use. The analysis results are visualized in an output window containing: • the distance matrix (if this option has been selected); • the output of the classical metric multidimensional scaling; • a plot of the distances. There is the possibility to use as data input a distance matrix. In this case, the resulting output presents the same things as the previous case.
7. An example of use of R-php point-and-click In this section, we see a simple example of use of R-php point-and-click. This would be only an indication to the user on how it is possible to use R-php point-and-click. We consider the linear regression GUI. The chosen data set contains data related to the concentration of several chemicals in 30 samples of Cheddar cheese from the La Trobe Valley of Victoria, Australia, and a subjective measure of taste for each sample (Moore and McCabe 2002). Indeed, it is known that as cheddar cheese matures, a variety of chemical processes take place and this fact assesses the taste of the final product. In this example, the variables taken into account are: • Taste: subjective taste test score, obtained by combining the scores of several tasters; • Acetic: natural logarithm of concentration of acetic acid; • H2S: natural logarithm of concentration of hydrogen sulfide; • Lactic: concentration of lactic acid. After the loading of the data set and the choice of the linear regression GUI, we go to estimate the regression model with Taste as response and the remaining variables as explanatory.
Figure 5: Window to select the variables in the linear regression GUI.
18
Using R via PHP for Teaching Purposes: R-php
Figure 6: Output of the linear regression GUI. By clicking on the “model” button, a window is shown where the response and explanatory variables can be chosen; in this case, we have to click on the cross between “Taste” and “Response”, while we select the remaining variables as explanatory (see Figure 5). By clicking on the “insert” button, the linear regression GUI home page appears and in the text area the chosen model formula is shown. Now, it is sufficient to click on the “send” button to have the corresponding results (see Figure 6). As we have said before, in the output window there is the possibility to save the results in .pdf and to save the R code used. The R code used to perform this analysis is the following: X