This paper proposes a new separation process algorithm called the radial-based cell ... overlapping cells separation; Pap smear image; thin blood smear image.
Available online at www.sciencedirect.com
ScienceDirect Procedia Computer Science 59 (2015) 123 – 132
International Conference on Computer Science and Computational Intelligence (ICCSCI 2015)
Radial-Based Cell Formation Algorithm for Separation of Overlapping Cells in Medical Microscopic Images Siti Nurul Aqmariah Mohd Kanafiaha, Yessi Jusmanb, Nor Ashidi Mat Isac and Zeehaida Mohamedd a
School of Microelectronic Engineering, Universiti Malaysia Perlis, Pauh Putra Campus, 02600 Arau, Perlis, MalaysiabSchool Department of Biomedical Engineering, Faculty of Engineering Building, University of Malaya, 50603 Kuala Lumpur, Malaysia c School of Electrical & Electronic Engineering Universiti Sains Malaysia, Engineering Campus, 14300 Nibong Tebal, Penang, Malaysia d Department of Microbiology and Parasitology, Universiti Sains Malaysia, Malaysia
Abstract Overlapping cells in a medical image can affect the extraction process of cells’ characteristics as they are visually indistinguishable from each other. This paper proposes a new separation process algorithm called the radial-based cell formation (RCF) for overlapping cells. The algorithm has been tested on 160 overlapping red blood cells taken from thin blood smear images, and 26 overlapping cervical cells taken from Pap smear images. On all tested medical images, the cells of interest are successfully detected and distinguishable from those overlapping cells, with size and shape well-preserved. The separated cells have been analyzed with both qualitative and quantitative analyses, resulting in much better results compared to other conventional algorithms. The correlation test approach was then used to determine the performance of the proposed RCF algorithm compared to the manual visual interpretation by the pathologists. The results obtained prove that this study has successfully developed a new separation process algorithm (i.e. RCF) for overlapping cells in medical microscopic images, with well-preserved size and shape of the individual cell. © 2015 2015Published The Authors. Published B.V. © by Elsevier B.V. by ThisElsevier is an open access article under the CC BY-NC-ND license (http://creativecommons.org/licenses/by-nc-nd/4.0/). Peer-review under responsibility of organizing committee of the International Conference on Computer Science and Peer-review under responsibility of organizing Computational Intelligence (ICCSCI 2015).committee of the International Conference on Computer Science and Computational Intelligence (ICCSCI 2015)
Keywords:medical microscopic image; image segmentation; overlapping cells separation; Pap smear image; thin blood smear image
1. Introduction One of the most interesting applications in the field of image analysis is the medical microscopic images. Clinically, diseases such as cervical cancer, malaria, tuberculosis (TB) and etc. are diagnosed visually by medical experts using microscopic images. However, the visual inspection could be difficult if the captured microscopic
1877-0509 © 2015 Published by Elsevier B.V. This is an open access article under the CC BY-NC-ND license (http://creativecommons.org/licenses/by-nc-nd/4.0/). Peer-review under responsibility of organizing committee of the International Conference on Computer Science and Computational Intelligence (ICCSCI 2015) doi:10.1016/j.procs.2015.07.522
124
Siti Nurul Aqmariah Mohd Kanafiah et al. / Procedia Computer Science 59 (2015) 123 – 132
images are affected by blurring effects (during the capturing process), noise and unwanted artifacts. Furthermore, the diagnostic result produced by human interactions is subjective and is sometimes prone to error1. Therefore, efforts have been exercised in order to improve and support conventional diagnosis systems (i.e. the manual interpretation by pathologists) using computer-aided systems. In order to focus on medical microscopic images, many computer-aided systems have successfully been developed for the purpose of facilitating and accelerating the diagnosis procedure. As of today, image segmentation and acquisition, created in advance to simplify the diagnosis, are carried out via those automated systems. Several approaches have already been proposed and applied for the segmentation of medical microscopic images by several researchers in their studies1-7. However, all of these studies have been seen to have delivered good results only on individual cells without interruption of overlapping cells. In real-life situations, overlapping cells always occur in medical microscopic images, which could lead to difficulty in extracting the size and shape of those cells for diagnosis purposes1. Thus, with an automatic screening system based on the computer-aided visualization, alternative algorithms to separate the overlapping cells in medical microscopic images have been proposed. Several approaches have been put forth to resolve this issue of overlapping cells. To quote, researchers have used the watershed to split the overlapping and touching cells8, 9.Tscherepanow et al. (2008) then construct the Snakes formulation on the active contour to separate overlapping cells10. Jung et al. (2010) propose occluded contours to separate the overlapping cells using the Bayesian classifier4. On the other hand, the applicationof granulometry morphology was used to estimate the cell’s size of every single circular cell in the overlapping area11.Hhowever, the results obtained in the techniques were sometimes limited by over-segmentation and under-segmentation problems. Thus, this study introduces a new algorithm to separate and distinguish between the overlapping cells in medical microscopic images with an objective to preserve the size and shape of the individual cell. The proposed algorithm called the radial-based cell formation (RCF) will then be tested on Pap smear and thin blood smear images. The rest of this paper is arranged as follows: In Section II, the proposed RCF algorithm for overlapping cells in medical microscopic images is presented. Experimental results and analyses obtained from the proposed RCF algorithm and its performance being compared with several selected conventional separation methods using qualitative, quantitative and correlation test methods are presented in Section III. Finally, Section IV describes the conclusion of this work. 2. The Proposed Radial-Based Cell Formation (RCF) Algorithm In this paper, we propose the new separation method for overlapping cells to overcome the limitation of two methods; i.e. the watershed and granulometry morphology algorithms. The watershed offers the most popular and acceptable solution for separating overlapping cells1, 9 It is because this algorithm is proven as an accurate method to detect the position of the nuclei and to automatically separate the overlapping cells. However, the separation process cannot be applied on the images with heavily overlapping cells. Furthermore, an inaccurate marking of segmentation between the overlapping cells cannot reveal the actual size and shape of individual cell. Consequently, the size and shape of each cell cannot significantly be preserved. Thus, the actual characteristics of each individual cell cannot be presented. As an alternative, the granulometry morphology method is introduced. It is a morphological tool, which can determine the size distribution from binary images11. It is proven as a suitable method for overlapping cells and produces good separation results in order to estimate a single cell’s size. However, this method is applicable only for circular cell images such as RBCs, and not for irregular shape images such as cervical cells. Based on those aforementioned limitations, the goal of this paper is to introduce the framework for separating the multiple overlapping cells with the objective to preserve the size and shape of the individual cell. The proposed RCF algorithm has specifically been developed for the medical microscopic overlapping cell images. The implementation of the proposed RCF algorithm is elaborated below: x Segment an image with overlapping cells into two main regions, namely regions of interest (ROI) (i.e. overlapping cells) and the background. Change the image into a binary image where ‘0’ (i.e. the black region) represents the background and ‘1’ (i.e. the white region) represents ROI. * Note: The segmentation can be done by adopting any segmentation techniques such as region growing, thresholding, clustering etc.
125
Siti Nurul Aqmariah Mohd Kanafiah et al. / Procedia Computer Science 59 (2015) 123 – 132
x Determine any point in the segmented overlapping cells with coordinate (xc, yc), where c represents the predetermined point. x Determine all pixels located at the border or edge of the overlapping cells. These pixels are referred as edge pixels, EDi and the total number of edge pixels is denoted as M. *Note: i = 1,2,…, M. x Determine the radius of all edge pixels from the point c using Equation (1).
REDi
( xi � xc )2 � ( yi � yc )2
(1)
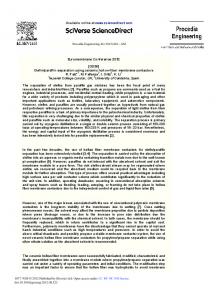
where is the radius of i-th edge pixel, and EDi is i-th edge pixel with coordinate (xi, yi), as shown in Figure 1. x Determine the shortest radius of the edge pixel and denote the edge pixel as ED´i. x In the clockwise or anticlockwise direction, re-sort all edge pixels represented by beginning with the location of ED´i, as set in step 5. x Consider the first sorted edge pixel, ED´i., where i is set to 1. x Starting from , consider the next n sequence of edge pixels, (ED´i.,ED´i+1,…, ED´i+(n-2), ED´i+(n-1)) *Note: n must be an odd number, starting from 3. x Find the radius’ ratio, DR between the ED´i+(n-1) and ED´i+(n-2) pixels using the following equation :
DR
RED1i � ( n �1) , IfR t RED1 ½ EDi1� ( n �1) i�( n�2) ° ° ° REDi1� ( n � 2 ) ° ®R ¾ ° EDii� ( n � 2 ) , IfR EDi1� ( n �1) d REDi1� ( n � 2 ) ° °R 1 °¿ ¯ EDi � ( n �1)
(2)
x If DR≥α, (where α is a predetermined radius ratio), sort all pixels in the n sequence in an ascending order and change the radius of the ED´i+(n-1) pixel with the median radius value of the sorted sequence, or otherwise go to step 11. *Note: the typical value of is between 0.8 to 1.2. x Consider the next edge pixel by setting i=i+1 and repeat steps 8 to 10 for all edge pixels.
Y Edge Pixel (xi, yi)
yi REDi
Centroid (xc, yc)
xi
Fig. 1.The determination process of the edge pixel’s radius.
X
126
Siti Nurul Aqmariah Mohd Kanafiah et al. / Procedia Computer Science 59 (2015) 123 – 132
3. Experimental Results and Analysis The main objective of the proposed RCF algorithm is to separate the overlapping cells inmedical microscopic images, with an aim to preserve the size and shape of the individual cell. In this study, two types of medical microscopic images are used namely Pap smear and thin blood smear images. Pap smear is a standard screening procedure where the cervical pre-cancerous stage is detected. Based on the morphological changes of the cervical cells observed on the Pap smear images such as the texture, size, etc., pathologists will be able to determine the stage of the cell abnormalities. Thus, the characteristics of the cervical cell’s shape and size are important to be preserved. The thin blood test is commonly practised for screening malaria parasite. Similar to the Pap smear test, the detection of morphological changes becomes an important criterion. In the thin blood smear image, the shape and size of infected red blood cells by the malaria parasite will be observed. In this study, we compare our results with two other methods i.e. the watershed algorithm and the granulometry morphology. The performances of all three methods are compared with the manual visual interpretation by pathologists. The performance is observed based on the correlation test approach to determine the capability of each algorithm. For the proposed RCF algorithm, the value of n and α are set to 5 and 1.2 respectively. 3.1. Qualitative Analysis The effectiveness of the proposed separation algorithm has been evaluated using 186 cases of reported overlapping medical microscopic images. A collection of specimens comprising 160 overlapping infected RBCs in thin blood smear images and 26 overlapping cervical cells in Pap smear images are obtained from the UniversitiSains Malaysia Hospital, Malaysia. The qualitative results for 3 images selected from the tested dataset are shown in Figures 2 to 4 and Figures 5 to 7 for thin blood smear and Pap smear images, respectively. Figures 2 to 4 show the separation results of the infected overlapping RBCs in three thin blood smear images namely TBS01, TBS02, and TBS03 respectively. Column 2 in the figure shows the original images. The arrows in columns 3 and 4 highlight the separated region of the individual cell. It can be observed that poor separation results for overlapping cells are obtained by the conventional watershed and granulometry morphology algorithms. The under-segmentation phenomenon can be observed in the first RBC of image TBS01, the first cell of image TBS02 and both RBCs of image TBS03 after applying the watershed algorithm. The over-segmentation phenomenon, on the other hand, occurs in the second cell of images TBS01 and TBS02. The granulometry morphology produces good results in separating the thin blood smear images. However, the spurious separation problem has occurred in each of those resultant images produced by the granulometry morphology algorithm. The segmented RBCs are almost circularly shaped, which look unnatural. The size and shape cannot successfully be preserved and maintained as compared to the manual visual inspection. The proposed RCF algorithm has significantly produced the best separation process. The resultant images provide more natural segmented RBCs, where the size and shapes are more similar to the ones observed with naked eye. The results of the separation of the overlapping cervical cells in three Pap smear images namely PS01, PS02, and PS03 are shown in Figures 5 to 7 respectively. The second column shows the original Pap smear images. Columns 3 and 4 show the segmented results of the first and the second cervical cells respectively. Arrows are used to show the separated region produced by all algorithms. Similar to results obtained in Figures 2 to 4, the conventional algorithms produce poor separation results of overlapping cervical cells. As clearly observable in the resultant images produced by the watershed algorithm, the over-segmentation occurrence has been noted in the second cell of image PS01 and the first cervical cell of images PS02 and PS03. Moreover, an under-segmentation phenomenon is also detected in the first cervical cell of image PS02 and the second cervical cell of images PS02 and PS03. The worst results are produced by the granulometry morphology algorithm. Based on the fundamental separation concept of the granulometry morphology algorithm (i.e. forming a circular shape of the edge) and the natural shape of cervical cell (i.e. irregular oval shape), the size and shape of all segmented cervical cells are seen to have been corrupted. An unnatural individual cervical cell is produced as compared to the ones observed with naked eye. Thus, from both types of medical microscopic images, the proposed RCF algorithm produces the best results as compared to both conventional watershed and granulometry morphology algorithms.
Siti Nurul Aqmariah Mohd Kanafiah et al. / Procedia Computer Science 59 (2015) 123 – 132
Separation algorithms
Original images
Segmentation of first cell
Segmentation of second cell
Watershed
Granulometry
The proposed RCF algorithm
Fig. 2.Results of the separation of overlapping cells for thin blood smear image TBS01, using three separation algorithms
Separation algorithms
Original images
Segmentation of first cell
Segmentation of second cell
Watershed
Granulometry
The proposed RCF algorithm
Fig. 3.Results of the separation of overlapping cells for thin blood smear image TBS02, using three separation algorithms.
127
128
Siti Nurul Aqmariah Mohd Kanafiah et al. / Procedia Computer Science 59 (2015) 123 – 132
Separation algorithms
Original images
Segmentation of first cell
Segmentation of second cell
Watershed
Granulometry
The proposed RCF algorithm
Fig. 4.Results of the separation of overlapping cells for thin blood smear image TBS03, using three separation algorithms.
Separation algorithms
Original images
Segmentation of first cell
Segmentation of second cell
Watershed
Granulometry
The proposed RCF algorithm
Fig. 5.Results of the separation of overlapping cells for Pap smear image PS01, using three separation algorithms
Siti Nurul Aqmariah Mohd Kanafiah et al. / Procedia Computer Science 59 (2015) 123 – 132
Separation algorithms
Original images
Segmentation of first cell
Segmentation of second cell
Watershed
Granulometry
The proposed RCF algorithm
Fig.6. Results of the separation of overlapping cells for Pap smear image PS02, using three separation algorithms.
Separation algorithms
Original images
Segmentation of first cell
Segmentation of second cell
Watershed
Granulometry
The proposed RCF algorithm
Fig. 7.Results of the separation of overlapping cells for Pap smear image PS03, using three separation algorithms
129
130
Siti Nurul Aqmariah Mohd Kanafiah et al. / Procedia Computer Science 59 (2015) 123 – 132
3.2. Quantitative Analysis As mentioned previously, one of the important criteria in separating the overlapping cells is the ability to maintain the size and shape of each individual cell. Thus, an analysis of the size calculation for each segmented individual cell is performed. The size obtained (in number of pixels) is then compared with the size calculated manually by pathologists from UniversitiSains Malaysia Hospital, Malaysia. The quantitative evaluation results for thin blood smear images (i.e. TBS01, TBS02, and TBS03) and Pap smear images (i.e. PS01, PS02, and PS03) are tabulated in Tables 1 and 2 respectively. The best results obtained are made bold. As shown in Table I, almost all sizes of segmented RBCs using the watershed algorithm are smaller than the original size extracted manually by pathologist. The worst result is produced for cell 1 in image TBS02 where the percentage of similarity produced, as compared to the original size extracted by pathologist is 74.20%. Similar results (i.e. occurrence of under-segmentation problem) can be observed for the Pap smear images as tabulated in Table 2. However, the percentages of similarity are better as compared to those of the thin blood smear images. These results clearly support the findings obtained in the qualitative analysis where under-segmentation problem obviously occurs in the watershed algorithm. Overall, the varying percentages of similarity produced by the watershed algorithm as compared to the manual extraction by pathologist are ±26.00% and ±11.50% for thin blood smear and Pap smear images respectively. Table 1.Quantitative evaluation for the size of red blood cells from three thin blood smear images
Images
Cells
TBS01
Cell 1 Cell 2 Cell 1 Cell 2 Cell 1 Cell 2
TBS02 TBS03
Size of RBCs extracted from image segmented by: number of pixels (percentage of similarity to manual extraction by pathologist) Pathologist Watershed Granulometry The proposed RCF algorithm 11391 10745 (94.33%) 10703 (93.96%) 11443 (100.46%) 10782 10885 (100.96%) 10040 (93.12%) 10694 (99.18%) 11541 8563 (74.20%) 11502 (99.66%) 11563 (100.19%) 11645 11361 (97.56%) 11461 (98.42%) 11730 (100.73%) 10432 9975 (95.62%) 11171 (107.08%) 10522 (100.86%) 13359 12698 (95.05%) 15584 (116.66%) 13705 (102.59%)
The granulometry morphology algorithm produces better results as compared to the watershed algorithm. It produces higher percentage of similarity; in a range of 93.12% to 116.66%. Based on the results, the undersegmentation problem is successfully reduced by the granulometry morphology algorithm as the lowest percentage of similarity produced is 93.12% (i.e. for cell 2 in the image coded as TBS01). However, the granulometry morphology algorithm tends to produce over-segmentation problem. This can be proven by the ‘over’ percentage of similarity for cell 2 in image TBS03 which is 116.66%. These findings once again support the results of the qualitative analysis presented in the previous section. The granulometry morphology algorithm also produces higher percentage of similarity for Pap smear images with the percentage of difference of ±7.50% (which is better than the watershed algorithm) as tabulated in Table 2. The proposed RCF algorithm produces the lowest difference of similarity percentages, which are ±3.00% and ±2.00% for thin blood smear and Pap smear images respectively. Furthermore, the size of 5 out of 6 RBCs and 3 out of 6 cervical cells formed are similar to the original size of RBCs as extracted by pathologist (i.e. by obtaining almost 100% of similarity). The results further prove that the proposed RCF algorithm has high capability to reduce the under-segmentation and over-segmentation problems as suffered by both the watershed and granulometry morphology algorithms.In addition to those 6 images, this study also tests the capability of the proposed RCF algorithm on 160 overlapping RBCs from thin blood smear images and 26 overlapping cervical cells from Pap smear images. For this analysis, the correlation test between the extracted size and manual extraction by pathologist has been scrutinized. The correlation test results are tabulated in Table 3. In general, the correlation value greater than 0.8 is described as strong positive correlation, whereas the correlation value between 0.5 and 0.8 is described as fair positive correlation, and less than 0.5 is described as weak. � �
Siti Nurul Aqmariah Mohd Kanafiah et al. / Procedia Computer Science 59 (2015) 123 – 132
131
Table 2.Quantitative evaluations for the size of cervical cells from three Pap smear images
Images
Cells
PS01
Cell 1 Cell 2 Cell 1 Cell 2 Cell 1 Cell 2
PS02 PS03
Size of cervical cells extracted from image segmented by: number of pixels (percentage of similarity to manual extraction by pathologist) Pathologist Watershed Granulometry The proposed RCF algorithm 168246 155897 (92.66%) 161180 (95.80%) 167958 (99.83%) 111949 113561 (101.44%) 108618 (97.02%) 113176 (101.10%) 64340 71617 (111.31%) 69162 (107.49%) 63534 (98.75%) 81028 73616 (90.85%) 84997 (104.90%) 80489 (99.33%) 105839 100810 (95.25%) 99236 (93.76%) 105264 (99.46%) 106110 103718 (97.75%) 99477 (93.75%) 108223 (101.99%) Table 3.Results for correlation tests
Correlation value Methods Watershed
Red blood cells (160 images) 0.7026
Cervical cells (26 images) 0.9844
Granulometry
0.7911
0.9843
The proposed RCF algorithm
0.9780
0.9982
Based on Table 3, only the proposed RCF algorithm achieves very strong positive correlation for the RBCs with the correlation test of 0.9780. The other two methods: the watershed algorithm and granulometry morphology create fairly positive correlation for the RBCs with correlation tests of 0.7026 and 0.7911 respectively. For cervical cells, all three methods have created a very strong positive correlation with the correlation test more than 0.98. However, the proposed algorithm once again achieves the highest strong positive correlation with the correlation test of 0.9982. Thus, the proposed RCF algorithm produces the highest correlation values (for both RBCs and cervical cells). It is therefore proven that the proposed algorithm is better than both the conventional watershed and granulometry morphology algorithms to separate the overlapping cells in medical microscopic images, with better preservation of the size and shape of the individual cell. 4. Conclusions In this paper, the proposed algorithm for the separation of overlapping cells is presented. The developed algorithm called the radial-based cell formation (RCF) algorithm is possibly beneficial to be used for most medical microscopic overlapping images. The capability of the proposed separation of overlapping cells has been analyzed empirically on 160 overlapping red blood cells from thin blood smear images, and 26 overlapping cervical cells from Pap smear images. The proposed RCF algorithm has produced better results as compared to the conventional watershed and granulometry morphology algorithms in terms of preserving the size and shape of individual cells. In addition, the robustness of the proposed RCF algorithm in terms of its capability to be applied on different types of medical images with different shapes and sizes of cells is also significantly inarguable. As a scope for future work, the suggestion to modify the proposed RCF algorithm for non-medical images should be done to improve its robustness. Acknowledgements We would like to express our gratitude to all of the staff at School of Electrical and Electronic Engineering, USM, Penang and School of Pathology and Microbiology, HUSM, Kelantan, Malaysia for their support and leads to the completion of this project.
132
Siti Nurul Aqmariah Mohd Kanafiah et al. / Procedia Computer Science 59 (2015) 123 – 132
References 1. Mao, KZ, Zhao, P and Tan, P-H, Supervised learning-based cell image segmentation for p53 immunohistochemistry, IEEE T BIO-MED ENG 2006;53:1153-1163 2. Yang, L, Meer, P and Foran, DJ, Unsupervised segmentation based on robust estimation and color active contour models, IEEE T INF TECHNOL B 2005;9:475-486 3. Jung, C and Kim, C, Segmenting clustered nuclei using H-minima transform-based marker extraction and contour parameterization, IEEE T BIO-MED ENG 2010;57:2600-2604 4. Jung, C, Kim, C, Chae, SW and Oh, S, Unsupervised segmentation of overlapped nuclei using Bayesian classification, IEEE T BIO-MED ENG 2010;57:2825-2832 5. Ko, BC, Gim, J-W and Nam, J-Y, Automatic white blood cell segmentation using stepwise merging rules and gradient vector flow snake, Micron 2011;42:695-705 6. Kong, H, Gurcan, M and Belkacem-Boussaid, K, Partitioning histopathological images: an integrated framework for supervised color-texture segmentation and cell splitting, IEEE T MED IMAGING 2011;30:1661-1677 7. Plissiti, ME, Nikou, C and Charchanti, A, Combining shape, texture and intensity features for cell nuclei extraction in Pap smear images, Pattern Recognition Letters 2011;32:838-853 8. Lezoray, O and Cardot, H, Cooperation of color pixel classification schemes and color watershed: a study for microscopic images, Image Processing, IEEE Transactions on 2002;11:783-789 9. Levner, I and Zhang, H, Classification-driven watershed segmentation, Image Processing, IEEE Transactions on 2007;16:1437-1445 10. Tscherepanow, M, Zollner, F, Hillebrand, M and Kummert, F, "Automatic segmentation of unstained living cells in bright-field microscope images," in Advances in Mass Data Analysis of Images and Signals in Medicine, Biotechnology, Chemistry and Food Industry, pp. 158-172, Springer (2008) 11. Cherni, MA, Sayadi, M and Fnaiech, F, Using granulometry and watershed for breast tumor cells segmentation, International Conference on Signals, Circuits and Systems (SCS) 2009; 1-5