Rating of Highway Bridges Using OpenSees and Tcl Michael H. Scott1 and Adrian Kidarsa2 13th Annual Tcl/Tk Conference, Naperville, IL, October 9-13, 2006
ABSTRACT The deterioration of highway bridges built during the interstate expansion of the 1950s and the increased number and weight of truck traffic have made bridge rating of paramount importance to government agencies across the United States. Bridge engineers rate a bridge by comparing the demands imposed by the weight of truck axles with the capacity to resist these demands at critical locations along the bridge. This is a time consuming task for even a single bridge and we present applications to rate a large number of highway bridges using the Tcl scripting language in conjunction with OpenSees, a finite element analysis program. OpenSees, written in C++, extends the Tcl language to define the nodes, boundary conditions, finite elements, and moving axle loads required to compute the demand imposed by trucks at critical locations along a bridge. Tcl commands are also added to compute the bridge capacity from design specifications at the critical locations, which can then be compared to the imposed demand in order to rate a bridge. The scripting capabilities of Tcl provide an ideal environment for the repetitive nature of moving load analysis and for advanced bridge rating applications using distributed network and database applications.
INTRODUCTION Many interstate highway bridges built in the 1950s were designed to permit higher demands than those permitted by current AASHTO standards (AASHTO 2003). These bridges are nearing the end of their originally intended design lives and have been exposed to millions of load cycles from a steadily increasing volume and magnitude of truck traffic. As a result, highways along critical interstate transportation corridors have hundreds of bridges 1
Assistant Professor, Dept. of Civil, Construction, and Environmental Engineering, Oregon State Univ., Corvallis, OR, 97331,
[email protected]. 2 Bridge Engineer, T.Y. Lin International, Salem, OR, 97302,
[email protected]; formerly Graduate Research Assistant, Dept. of Civil, Construction, and Environmental Engineering, Oregon State Univ., Corvallis, OR, 97331.
1
exhibiting fatigue due to overload or environmental conditions, or some combination of these factors. To estimate the remaining life of highway bridges, a research program was undertaken at Oregon State University that incorporated field testing, vehicle load data collection, laboratory testing, and analysis. The program focused on conventionally reinforced concrete deck girder (RCDG) bridges designed and constructed in Oregon during the interstate boom of the 1950s. An outcome of the research program was the development of a reliability-based rating methodology for RCDG bridges (Higgins et al. 2005), where an analysis of moving loads is required to identify moment-shear demands at critical bridge locations, then compare the demands with available moment-shear interaction capacity. This methodology is based on a reliability index that indicates the probability imposed demand will exceed capacity considering uncertainty of the material properties and construction details of the bridge. Maintenance personnel can impose tolerable reliability indices to bridges based on their importance within a transportation network and decide to replace or repair a bridge that does not rate for its specified reliability index. The methodology enables flexible input scenarios including field inspection information for damage locations, field test data for load distribution and impact factors, specification based distribution and impact factors, multiple capacity estimation methods, and updating of vehicle load data. The new methodology is a departure from past practice and involves a number of additional steps that can be time consuming considering the large number of bridges maintained by state highway agencies. Furthermore, the reliability-based rating approach is general enough to be applied to any type of bridge, including those with steel or prestressed concrete girders, as long as an estimate of the moment-shear capacity is available at each critical location along the bridge. The reliability based methodology requires a significant investment of time and produces an intractable amount of data, the creation and interpretation of which must be automated for use by bridge rating engineers. To apply the reliability-based methodology to a large number of bridges that are close to the end of their design life, dedicated software applications have been developed using Tcl in conjunction with OpenSees. OVERVIEW OF OPENSEES OpenSees is a software framework that consists of a set of cooperating modules that can be used to construct applications, in this case for bridge rating. The design of a software framework is based on assumptions about the applications, and OpenSees is based on the finite element method (Cook et al. 1989; Bathe 1996; Zienkiewicz and Taylor 2000), which is the most general approach for the computational simulation of structural systems such as bridges. OpenSees is designed in a modular fashion to support the finite element method with loose coupling between modules (McKenna 1997; McKenna et al. 2000; Fenves et al. 2004). This allows users and developers in different fields, including engineering, computer science, and numerical analysis, to develop and modify specific modules with relatively little dependence on other modules. A developer does not need to know everything that is in the framework, allowing them to concentrate on making improvements in areas of their own expertise. Furthermore, modules can be modified and optimized to take advantage of computing hardware, communication, and visualization without the changes propagating 2
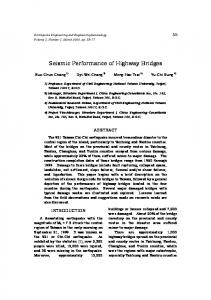
throughout the software system. BUILDING BRIDGE RATING APPLICATIONS IN OPENSEES The bridge rating application presented in this paper is an extension of the Tcl interpreter. This allows users to build a bridge model and select analysis procedures from modules available in the OpenSees framework while taking advantage of the intrinsic data and control structures of the Tcl language. Model building and analysis commands are added to the Tcl interpreter through calls to the Tcl CreateCommand function. There are many advantages of giving users a fully programmable, interpreted language for defining models and solution methods, including the ability to conduct parameter studies, to provide network access to data and storage, and to communicate with graphical user interfaces. With the finite element model building and analysis commands added to the Tcl interpreter, there are three main steps to developing a bridge rating application: 1. Define a finite element model of the bridge and specify the capacity at each critical location identifed by a bridge engineer; 2. Analyze the bridge to determine the demand at each critical location imposed by moving vehicle loads; then 3. Compare capacity with demand at each critical location to determine the controlling reliability index for the bridge. The Tcl implementation of each step is described in the following sections in reference to the McKenzie River Bridge, and RCDG bridge located on Interstate-5 just north of Eugene, OR. An idealized model of the bridge is shown in Fig. 1 as three spans of equal length (50 ft), each with seven critical locations that correspond to transitions in steel reinforcing details and concrete cracks, as determined from bridge design drawings and field inspection. The bridge rating is carried out in two dimensions with three-dimensional effects of load distribution approximated using distribution factors. Specification of Bridge Model The first step in the bridge rating process is to create a finite element model of the bridge from user input data. As shown in Fig. 2, a user is required to populate a number of Tcl lists. The first list is Lspan, which stores the length of each span. Then critical locations for each span are specified as individual lists in the criticalLocs array. The comments in Fig. 2 indicate a segment of commands, omitted for brevity, to compute and store in the MVcapacity database the moment-shear capacity at each critical location in the criticalLocs array. For RCDG bridges, the moment-shear capacity is computed using Modified Compression Field Theory (Vecchio and Collins 1988); however, the Tcl scripts presented herein are general enough to be applied to any type of bridge. Regardless of the bridge type, the capacity information will ultimately be compared with demands to determine a reliability index. It is noted that although the span and critical location information are input at the script level in this work, they can be managed using the Tcl SetResult, Tcl AppendResult, and Tcl AppendElement functions of the Tcl API when using a graphical pre-processor to generate input scripts. 3
4 ft
8 ft
1
2
N =7 6 ft
4 ft
12.5 ft
25 ft
3 9 ft
37.5 ft
4 12 ft
5 9 ft
42 ft
46 ft
6
7
4 ft
6 ft
Span 1
Span 2
Span 3
50 ft
50 ft
50 ft
FIG. 1. Span numbers, lengths, and critical locations for the McKenzie River Bridge.
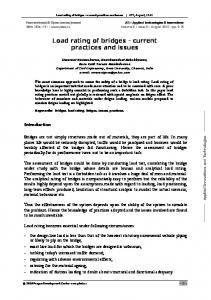
After the span and critical location data structures have been populated, the script iterates over each span to generate a one-dimensional mesh of nodes and beam finite elements that will be used to analyze the bridge. This is accomplished using the node and beamElement commands added to the Tcl interpreter. A beam finite element is capable of resisting moment and shear forces due to transverse loads such as those applied by trucks on a highway bridge. There are four nodes (one at each end of the bridge and one over each interior support) in this model and one beam element represents each span of the bridge. A total of 21 critical locations (seven per span) are mapped on to the bridge and recorders are created to store the demands computed at each of these locations during the analysis, which is described in the following section. Bridge Analysis for Rating Vehicles Bridge engineers maintain a library of notional rating vehicles with axle weights and spacings that are representative of extreme truck loadings that can be imposed on a bridge. For example, the suite of single-trip permit (STP) trucks the Oregon DOT use to rate its highway bridges is shown in Fig. 4. This and other suites of rating vehicles are stored in a database that can be queried during by the Tcl bridge rating application and the database can be updated periodically based on weigh station and weigh-in-motion data to reflect changes in traffic demographics. Computing the moment and shear demands at the critical locations requires moving the truck axle loads along the bridge and performing a structural analysis for each discrete location of the axles. A snap shot of a three axle truck moving across the McKenzie River Bridge is shown in Fig. 3. A segment of Tcl code that moves axle loads across a bridge of an arbitrary number of spans is shown in Fig. 5. The location of each axle is referenced 4
# User defined data set Lspan ‘‘50.0 50.0 50.0’’ set criticalLocs(1) ‘‘4.0 8.0 12.5 25.0 37.5 42.0 46.0’’ set criticalLocs(2) ‘‘4.0 8.0 12.5 25.0 37.5 42.0 46.0’’ set criticalLocs(3) ‘‘4.0 8.0 12.5 25.0 37.5 42.0 46.0’’ ### Compute moment-shear capacity at each critical location using ### bridge design drawings and material properties, store results in ### MVcapacity data structure # Generic girder definition node 0 0.0 set Lbridge 0.0; set i 1 foreach L $Lspan { set Lbridge [expr $Lbridge + $L] node $i $Lbridge beamElement $i [expr $i-1] $i $criticalLocs($i) ... foreach loc $criticalLocs($i) { ### Create recorder that will write analysis results to datastore } incr i } FIG. 2. Tcl code to create the nodes and finite elements that represent a continuous bridge girder and to record analysis results for each critical location.
x = dx*j, j=1,Nstep 32kip
32kip
14 ft
FIG. 3.
8kip
14 ft
50 ft
50 ft
50 ft
Span 1
Span 2
Span 3
Three axle rating vehicle moving along the McKenzie River Bridge.
5
6 FIG. 4. Table of representative Single-Trip Permit (STP) vehicles used to rate Oregon highway bridges.
from the first axle and a short sequence of if statements determine on to which span to apply the corresponding axle load. After all axle loads are placed on the bridge, the analyze command invokes the structural analysis procedures and finite element solution methods of the OpenSees framework. After the finite element solution, the computed moment-shear demand at each critical location is sent to the MVdemand database. Finally, all loads are removed from the bridge model and the truck is moved to a new location and this process is repeated until the vehicle moves off the bridge. The outer loop in Fig. 5 iterates over each rating vehicle in the truckLibrary database. Reliability Index Calculation With the demand at each critical location computed for each rating vehicle, the reliability index is computed by comparing demand with the available capacity at each location. As shown in Fig. 6, the capacity at each location is retrived from the MVcapacity data structure (populated in Fig. 2), then a reliability index, β, is computed by passing the demand for the current truck/critical location combination and the capacity for the current critical location to the computeBeta command added to the Tcl interpreter. This command invokes a search routine that finds the minimum distance from any point on the moment-shear demand history to the moment-shear capacity curve. This minimum distance is the reliability index, β, which measures how many standard deviations on a standard normal distribution the demand is from the capacity considering uncertainty of the nominal, or mean, moment-shear capacity. A visualization of the reliability index calculation is shown in Fig. 7, where the nominal capacity is shown along with a reduced capacity that corresponds to a threshold reliability index of β=3.5, which corresponds to a probability of exceedance that is less than 0.02%. The demand imposed by a STP rating vehicle is shown for each section. The critical location in Fig. 7 (a) rates for the specified β threshold since the demand lies within the reduced capacity, i.e., the reliability index at this location is greater than 3.5. On the other hand, the critical location in Fig. 7 (b) does not rate since the demand lies outside the threshold, i.e., the computed β value is less than 3.5. A visualization of the reliability index distribution across the McKenzie River Bridge is shown in Fig. 8, where regions of the bridge that do not rate are shaded. Rating engineers and maintenace personnel may decide to specify a higher β threshold for bridges that are more costly to repair or that are on critical paths in state and national transportation networks. The reliability-based rating procedure thus allows government agencies to make informed economic decisions regarding targeted rehabilitation and repair of aging highway bridges. FUTURE APPLICATIONS Future directions for the use of OpenSees and Tcl in bridge analysis are to use Tcl to build three-dimensional finite element models that account for the distribution of vehicle loading through the bridge deck and to incorporate additional sources of uncertainty in order to develop advanced bridge reliability applications that interface with the structural reliability and optimization modules of the OpenSees software framework. These extensions will make multi-hazard analysis possible, where seismic loads and deterioration due to corrosion, freeze-thaw cycles, and low cycle fatigue are accounted for in the reliability-based bridge 7
rating methodology. Finally, the incorporation of moving load analysis in OpenSees makes possible a new dimension of distributed computing and hybrid simulation applications that are in development as part of the Network for Earthquake Engineering Simulation (NEES, www.nees.org). ACKNOWLEDGMENTS The authors would like to thank the Oregon Department of Transportation for supporting this research and Prof. Chris Higgins of Oregon State University for discussions and guidance regarding the reliability-based rating methodology. REFERENCES AASHTO (2003). Manual for Condition Evaluation and Load and Resistance Factor Rating (LRFR) of Highway Bridges. American Association of State Highway and Transportation Officials, Washington, D.C. Bathe, K. J. (1996). Finite Element Procedures. Prentice-Hall. Cook, R. D., Malkus, D. S., and Plesha, M. E. (1989). Concepts and Applications of Finite Element Analysis. John Wiley & Sons. Fenves, G. L., McKenna, F., Scott, M. H., and Takahashi, Y. (2004). “An object-oriented software environment for collaborative network simulation.” 13th World Conference on Earthquake Engineering, Vancouver, B.C. Higgins, C., Daniels, T. K., Rosowsky, D. V., Miller, T. H., and Yim, S. C. (2005). “Assessment and risk ranking of conventionally reinforced concrete bridges for shear.” Journal of the Transportation Research Board, (1928), 110–117. McKenna, F. (1997). “Object-oriented finite element programming: Frameworks for analysis, algorithms, and parallel computing,” PhD thesis, University of California. McKenna, F., Fenves, G. L., and Scott, M. H. (2000). “Open system for earthquake engineering simulation, http://opensees.berkeley.edu. Vecchio, F. J. and Collins, M. P. (1988). “Predicting the response of reinforced concrete beams subjected to shear using the modified compression field theory.” ACI Structural Journal, 85(S27), 258–268. Zienkiewicz, O. C. and Taylor, R. L. (2000). The Finite Element Method: Volume 1, The Basis. Butterworth-Heinman, Stoneham, MA, 5th edition.
8
set Nstep 1000 ;# Number of discrete vehicle locations on bridge foreach truck $truckLibrary { ### Using information from the rating vehicle database, populate the ### AxleWeight and AxleSpacing arrays for this truck set dx [expr ($Lbridge+$Ltruck)/$Nstep] for {set j 1} {$j