Each control chart pattern (CCP) has its own geometric shape and various related features can represent this shape. The shape features can represent the main ...
Proceedings of the 2010 International Conference on Industrial Engineering and Operations Management Dhaka, Bangladesh, January 9 – 10, 2010
Recognition of Control Chart Patterns using Discriminant Analysis of Shape Features Monark Bag Department of Production Engineering Jadavpur University, Kolkata-700032, West Bengal, India Susanta Kumar Gauri SQC and OR Unit Indian Statistical Institute, Kolkata-700108, West Bengal, India Shankar Chakraborty Department of Production Engineering Jadavpur University, Kolkata-700032, West Bengal, India Abstract Each control chart pattern (CCP) has its own geometric shape and various related features can represent this shape. The shape features can represent the main characteristics of the original data in a condensed form. Different patterns can, therefore, be efficiently discriminated based on these shape features extracted from the control chart plot. In this paper, a feature-based heuristics approach is proposed that can recognize nine main types of CCPs, including the mixture pattern. The important shape features are identified and extracted, and then, the heuristics in the form of a decision tree is developed based on discriminant analysis of the extracted shape features.
Keywords Control chart pattern, Shape feature, Pattern recognition, Decision tree, Discriminant analysis
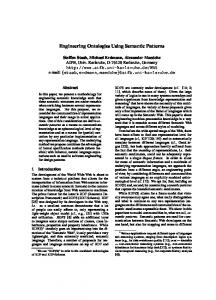
1. Introduction Quality has now become one of the principal business strategies and perhaps the single most important way to achieve business success in a highly competitive global market. In order to manufacture products with the desired quality, production processes need to be monitored for any unnatural deviation in the state of the process. Control chart pattern (CCP) recognition is one of the most important tools in statistical process control (SPC) to identify process problems. The observed variation of quality characteristics generally results from either natural variation (common cause) or specific variation (assignable causes due to materials, machines, operators etc.). Common causes are considered to be due to the inherent nature of normal process and assignable causes of variation occur when the process has been changed. Assignable causes result in the unnatural variation to the process, which should be identified and eliminated as soon as possible. A normal (NOR) pattern in X chart is indicative that the process is operating under natural variation. In X charts, unnatural variations are signaled mainly by exhibition of eight types of unnatural patterns, e.g. stratification (STA), systematic (SYS), cyclic (CYC), mixture (MIX), increasing trend (UT), decreasing trend (DT), upward shift (US) and downward shift (DS) [1], as shown in Fig. 1. All other patterns are either special forms of basic CCPs or mixed forms of two or more basic CCPs. Recognition of unnatural patterns is a crucial task in SPC for identifying underlying root causes. Traditionally, control chart patterns have been analyzed and interpreted manually. Over the years, many supplementary rules, like zone test or run rules have been developed to detect the CCPs [1,2]. Artificial intelligence approaches, such as expert system, fuzzy logic and neural network have been introduced as pattern classifier or pattern recognizer. Several techniques have also been developed in the knowledge-base design of the expert systems [3-5], such as template matching, statistical testing, run rules and heuristic algorithms. Some researchers [6,7] have applied the concept of fuzzy sets and membership functions to detect unnatural patterns. Artificial neural network is the most popular pattern classifier as suggested by
Hwarng and Hubele [8], Cheng [9] and Guh and Shiue [10]. Pham and Wani [11] and Gauri and Chakraborty [12] have demonstrated that each control chart pattern has its own geometric shape and various CCPs can be efficiently recognized using appropriately chosen shape features from the CCPs. In this paper, a feature-based heuristics approach is proposed that can recognize all the nine main types of CCPs including the mixture pattern. The important shape features are identified and extracted, and then, the heuristics in the form of a decision tree is developed based on the discriminant analysis of the extracted shape features. The recognition performance of the heuristics is extensively studied using simulated pattern data and the results show that it is promising for real time process application.
(a) Normal
(b) Stratification
(c) Systemetic
(f) Increasing trend (g) Decreasing trend
(d) Cyclic
(h) Upward shift
(e) Mixture
(i) Downward shift
Figure 1: Nine types of basic CCPs
2. Extraction of shape features For the control chart plot and extraction of the related features, a moving observation window of size N is considered here. Shape features of control chart patterns can be extracted from different considerations [13] and many of them may be highly correlated. However, a good CCP recognizer should be capable to differentiate patterns with high accuracy using a minimum number of features and the correlation among those features should be as low as possible. Lower is the association among the features, higher will be the prediction stability [14]. Keeping this in mind, a set of seven features which are having fairly low correlation among them is chosen here. All these features are extracted assuming that a sampling interval in the control chart plot is represented by a linear distance, c = 1σ . These features along with the mathematical expressions for their extraction are enlisted below: a) Sign of slope of the least square (LS) line representing the overall pattern (SB): The SB can be viewed as a categorical variable, which is ‘0’ if the value of the expression, 2 th ∑iN=1 y i ( t i − t )/ ∑iN=1 ( t i − t ) is negative and ‘1’ otherwise, where, ti = ic (i = 1,2,3,…,N) is the distance of the i time point of observation from the origin, c is a constant linear distance used to represent a given sampling interval on the control chart plot, yi is the observed value of a quality characteristics at ith time point, N is the size of the observation window and t = ∑iN=1 t i /N . b) Ratio between variance of the data points (SD2) and mean sum of squares of errors (MSE) of the LS line representing the overall pattern (RVE): RVE = [∑iN=1 ( y i − y ) 2 /(N − 1)]/[{ ∑iN=1 ( y i − y ) 2 − (∑iN=1 y i ( t i − t )) 2 / ∑iN=1 ( t i − t ) 2 }/(N − 2)] (1) c) Area between the overall pattern and the LS line per interval in terms of SD2 (ALSPI): ALSPI = [ALS/(N − 1)]/SD 2 ; SD = [∑iN=1 ( y i − y ) 2 /(N − 1)]1/2 (2) where, ALS is the area between the pattern and fitted LS line. The value of ALS can be easily computed by summing the areas of the triangles and trapeziums that are formed by the LS line and overall pattern. d) Proportion of the sum of number of crossovers to mean line and LS line (PSMLSC): PSMLSC = ∑iN=1−1 (O i + O ′i )/2N (3)
where, Oi = 1 if ( yi − y )( yi +1 − y ) < 0; otherwise, Oi = 0 and y is the mean value of N data points, and O′i = 1
if ( y i − y′i )( y i+1 − y′i+1 ) < 0 ; otherwise, O′i = 0 and y′i is the least square estimate of ith data point. e) Range of slopes of straight lines passing through six pair-wise combinations of midpoints of four equal segments (SRANGE):
SRANGE = maximum (s jk ) − minimum (s jk ) ; (j = 1,2,3; k = 2,3,4; j < k )
(4)
The feature SRANGE is extracted after predefined segmentation of the observation window into four equal segments. The behavior of the process in a segment is represented by the midpoint of the segment. Then, six straight lines are drawn passing through the midpoints of these four segments in C 42 ways. In the above equation, sjk represents the slope of the straight line passing through the midpoints of jth and kth segments. f) Ratio of mean sum of squares of errors of the LS line fitted to overall data and average MSE of the LS lines fitted to six subsets of N/2data points (REAE): (5) REAE = MSE/[ ∑ j,k MSE jk /6] ; (j = 1,2,3; k = 2,3,4; j < k ) The feature REAE is extracted after fitting the LS lines to the combination of N/2 data points obtained from the four segments in 6 ways. In the above equation, MSEjk is the mean sum of squares of errors of the LS line fitted to the observations in jth and kth segments. g) Sum of absolute slope difference between the LS line representing the overall pattern and the LS lines representing patterns within two criterion-based segments (SASDRE): SASDPE = ∑2j=1 B − B j ; B = ∑iN=1 y i (t i − t)/ ∑iN=1 (t1 − t) 2
(6)
where, B is the absolute slope of the LS line representing the overall pattern and Bj is the slope of the LS line fitted to jth criterion-based segment. Here, the defined criterion is minimization of the pooled mean sum of squares of errors (PMSE) of the two LS lines fitted to the two segments. Assuming that at least 8 data points are required for fitting a LS line, the LS lines are fitted to all the possible two segments and the segmentation which leads to the minimum PMSE is chosen. Table 1 shows the values of pair-wise correlation coefficients among the selected seven features computed from a set of learning samples. The table reveals that the degree of association among the selected shape features is considerably low. Table 1: Pair-wise correlation coefficients among the selected shape features Selected feature SB RVE ALSPI PSMLSC SRANGE REAE SASDPE SB 1.00 0.02 -0.00 0.24 -0.16 -0.09 -0.05 RVE 0.02 1.00 -0.26 -0.34 0.02 0.16 -0.00 ALSPI -0.00 -0.26 1.00 -0.03 -0.34 -0.05 -0.40 PSMLSC 0.24 -0.34 -0.03 1.00 -0.43 -0.37 -0.19 SRANGE -0.16 0.02 -0.34 -0.43 1.00 0.59 0.37 REAE -0.09 0.16 -0.05 -0.37 0.59 1.00 0.13 SASDPE -0.05 -0.00 -0.40 -0.19 0.37 0.13 1.00
3. Generation of control chart patterns Since a large window size can decrease the recognition efficiency by increasing the time required to detect the patterns, an observation window with 32 data points is considered here. The equations along with the corresponding parameters used for simulating the nine basic CCPs are given in Table 2. The values of different parameters for the unnatural patterns are randomly varied in a uniform manner between the limits shown. A set of 9000 (1000×9) sample patterns are generated from 1000 series of standard normal variate. Multiple sets of learning samples as well as test samples are required to rigorously evaluate the recognition and generalization performance of the heuristicsbased CCP recognizer that is developed based on the selected set of shape features. In this paper, six sets of learning and six sets of test samples of size 9000 each are generated for the purpose of experimentation. Only difference between these twelve sets of sample patterns is in the random generation of standard normal variate and values of different pattern parameters within their respective limits.
4. Experimentation In this paper, feature-based heuristics (decision trees) that can recognize all the nine main types of CCPs including MIX pattern are developed using discriminant analysis (available in STATISTICA software) of the selected seven shape features. Tree-structured classification of discriminant-based univariate splits allows automatic selection of the ‘right-sized’ tree that has the optimal prediction accuracy. Discriminant-based univariate splits are computed using quadratic discriminant analysis as in QUEST (Quick, Unbiased, Efficient Statistical Tree). The procedures for the ‘right-sized’ tree selection are not foolproof, but at least, they take the subjective judgment out of the process of choosing the ‘right-sized’ tree and thus avoid ‘over fitting’ and ‘under fitting’ of the data. Discriminant analysis
includes a number of innovative features for improving the reliability and efficiency of the classification tree that it computes. Each set of the learning samples is subjected to the classification tree analysis using discriminant analysis with the following parameters: (a) prior probabilities for different patterns: proportional to class size, (b) misclassification cost of a pattern: equal for all the patterns, (c) stopping rule: prune on misclassification error, (d) value of ‘n’ for ‘Minimum n’ rule = 5, (e) value of δ for ‘δ standard error’ rule = 1.0, (f) P- level for split variable selection = 0.05. This results in six different classification trees giving six heuristics-based CCP recognizers. These recognizers are labelled as 1.1-1.6 in Table 3. The recognition performance of each heuristics-based recognizer is then evaluated using all the six sets of test samples. CCP NOR STA
Table 2: Equations and parameters for control chart pattern simulation Pattern parameters Parameter values Pattern equation • Mean (µ) 80 y i = µ + ri σ 5 • Standard deviation (σ) y i = µ + ri σ′ 0.2σ to 0.4σ • Random noise (σ′)
SYS
• Systematic departure (d)
1σ to 3σ
y i = µ + ri σ + d × (−1) i
CYC
• Amplitude (a) • Period (T)
1.5σ to 2.5σ 8 and 16
y i = µ + ri σ + asin(2πi/T)
MIX
• Process mean (m) • A random number (b)
1.5σ to 2.5σ 0 to 1
y i = µ + ri σ + (−1) w m
UT
• Gradient (g)
0.05σ to 0.1σ
w = 0 if b < 0.4 , w = 1 if b ≥ 0.4 y i = µ + ri σ + ig
DT
• Gradient (g)
−0.1σ to −0.05σ
y i = µ + ri σ + ig
US
• Shift magnitude (s) • Shift position (P)
1.5σ to 2.5σ 9, 17, 25
y i = µ + ri σ + ks;
DS
k = 1 if i ≥ P , else k = 0 y i = µ + ri σ + ks; • Shift magnitude (s) −2.5σ to −1.5σ 9, 17, 25 • Shift position (P) k = 1 if i ≥ P , else k = 0 Note: i = discrete time point at which the pattern is sampled (i = 1,2,3,…,32), ri = random value of a standard normal variate at ith time point, and yi = sample value at ith time point.
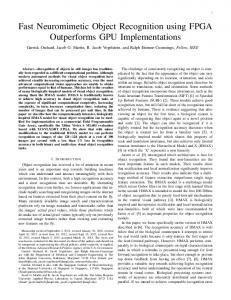
5. Results and discussions Learning and verification performances of the six shape feature-based heuristic are shown in Table 3. It is observed that the recognition performance is quite satisfactory. The overall mean percentage of correct recognition obtained by the recognizer at the training and verification (recall) phases are 93.96% and 92.97% respectively. It may be noted that the recognition performance at the verification phase is lower than that as achieved during the learning phase. The percentage of correct recognition (mean value) at the verification phase ranges from 92.53% to 93.84%. The best heuristics-based recognizer in terms of consistency of recognition performance is recognizer number 1.2, and its heuristics rules in the form of a classification tree are shown in Fig. 2. The confusion matrix is a table summarizing the tendency of the recognizer to classify a recognized pattern into a correct class or into any of the other eight possible (wrong) classes. The confusion matrix, as given in Table 4, provides the overall mean percentage for confusion among the learning samples for the six feature-based heuristics. It is observed that shift patterns are often interpreted as trend patterns and vice versa, and these patterns are the hardest to be classified correctly. Stratification patterns are the easiest to be classified (100%), followed by systematic (99.00%), mixture (97.27%) and cyclic (96.24%) patterns. Normal patterns are often confused with shift, trend and cyclic patterns.
Recognizer number 1.1 1.2 1.3 1.4 1.5 1.6 Overall mean
Table 3: Learning and verification performance of the recognizers Learning phase Verification phase Number of Correct Correct classification (%) splits in tree classification Mean Maximum Minimum (%) 32 93.94 92.53 94.89 91.07 29 94.16 93.84 96.18 92.47 26 93.83 92.99 94.67 91.29 32 94.00 93.26 95.73 92.18 31 93.96 92.67 95.04 91.14 34 93.89 92.54 95.03 91.59 93.96 92.97 Overall range
Figure 2: Classification tree for recognition of control chart patterns
Range 3.82 3.71 3.38 3.55 3.90 3.44 5.11
True pattern class NOR STA SYS CYC MIX UT DT US DS
NOR 91.80 0.00 0.57 2.00 0.17 3.03 2.73 0.80 2.10
Table 4: Confusion matrix Identified pattern class STA SYS CYC MIX UT DT 0.47 0.63 1.10 0.03 1.83 1.37 100.00 0.00 0.00 0.00 0.00 0.00 0.00 99.00 0.00 0.23 0.07 0.00 0.00 0.00 96.24 0.10 0.33 0.50 0.00 0.33 0.50 97.27 0.87 0.53 0.00 0.23 0.17 0.17 89.20 0.20 0.00 0.10 0.47 0.07 0.00 92.00 0.00 0.07 0.13 0.07 8.37 0.00 0.00 0.07 2.03 0.07 0.00 6.10
US 1.60 0.00 0.13 0.10 0.10 7.00 0.00 90.50 0.00
DS 1.17 0.00 0.00 0.73 0.23 0.00 4.63 0.06 89.63
6. Conclusions A feature-based CCP recognizer in the form of a decision tree is developed based on seven extracted shape features from the CCPs. The features are extracted from an observation window of considerably smaller size and the developed recognizer can recognize all the nine most commonly observed CCPs including mixture pattern. Since the extraction of the features, as considered in this paper, does not require users’ input in any form, the CCP recogniser is fully automatic. In this paper, various features are extracted in such a way that their values become independent of the process mean and standard deviation. Thus, this feature-based CCP recognizer can be applicable to any manufacturing process. Simulation studies reveal that the performance of the developed CCP recognizer is quite promising. Future research should address the situations when multiple unnatural patterns exist concurrently (e.g. a trend with a cyclic behaviour). The discriminant analysis-based CCP recognizer can be linked with a Quality Information System (QIS) which, based on the identified abnormal patterns and pattern parameters, will identify the assignable causes for process variation.
References 1. 2. 3. 4. 5. 6. 7. 8. 9. 10. 11. 12. 13. 14.
Western Electric, 1958, Statistical Quality Control Handbook. Indianapolis: Western Electric Company. Nelson, L.S., 1984, The Shewhart control chart – test for special causes. Journal of Quality Technology, 16, 237-239. Evans, J.R. and Lindsay, W.M., 1988, A framework for expert system development in statistical quality control. Computers and Industrial Engineering, 14, 335-343. Pham, D.T, Oztemel, E., 1992, XPC: an on-line expert system for statistical quality control. International Journal of Production Research, 30, 2857-2872. Swift, J.A. and Mize, J.H., 1995, Out-of-control pattern recognition and analysis for quality control charts using LISP-based systems. Computers and Industrial Engineering, 28, 81-91. Yang, M.S. and Yang, J.H., 2002, A fuzzy-soft learning vector quantization for control chart pattern recognition. International Journal of Production Research, 40, 2721-2731. Zarandi, M.H.F, Alaeddini, A. and Turksen, I.B., 2008, A hybrid fuzzy adaptive sampling – run rules for Shewhart control charts. Information Sciences, 178, 1152-1170 Hwarng, H.B. and Hubele, N.F., 1993, Back-propagation pattern recognizers for X control charts: methodology and performance. Computers and Industrial Engineering, 24, 219-235. Cheng, C.S., 1997, A neural network approach for the analysis of control chart patterns. International Journal of Production Research, 35, 667-697. Guh, R.S. and Shiue, Y.R., 2005, On-line identification of control chart patterns using self-organizing approaches. International Journal of Production Research, 43, 1225-1254. Pham, D.T. and Wani, M.A., 1997, Feature-based control chart pattern recognition. International Journal of Production Research, 35, 1875-1890. Gauri, S.K. and Chakraborty, S., 2006, Feature-based recognition of control chart patterns. Computers and Industrial Engineering, 51, 726-742. Gauri, S.K. and Chakraborty, S., 2007, A study on the various features for effective control chart pattern recognition. International Journal of Advanced Manufacturing Technology, 34, 413-425. Montgomery, D.C. and Peck, E.A., 1982, Introduction to Linear Regression Analysis. New York: John Wiley and Sons.