Recognition of Island Structures for Map Generalization Stefan Steiniger
Dirk Burghardt
Robert Weibel
Department of Geography University of Zurich Winterthurerstr. 190 CH - 8057 Zurich +41-1-635 5217
Department of Geography University of Zurich Winterthurerstr. 190 CH - 8057 Zurich +41-1-635 6534
Department of Geography University of Zurich Winterthurerstr. 190 CH - 8057 Zurich +41-1-635 5190
[email protected]
[email protected]
[email protected]
ABSTRACT In this paper we describe work on the automatic recognition of island structures. In an initial phase several test persons were asked to mark groups of islands that they perceived on test maps. Based on these experimental results the island structures were categorized with respect to size and shape, and their construction described using principles from Gestalt theory. Based on those descriptions of island structures we will present an algorithm for the detection of large groups of islands based on a Minimal Spanning Tree (MST). Therefore, we apply split and merge operations on the MST. For the automated characterization of the shape and orientation of island groups we propose to use principal components obtained from a PCA. The results of the algorithm are then visually compared with the island groups previously marked by test persons and shortcomings of the approach are discussed.
Categories and Subject Descriptors I.4.8 [Image Processing and Computer Vision]: Scene Analysis – object recognition. I.5.4 [Pattern Recognition]: Applications – computer vision.
General Terms Algorithms, Experimentation, Human Factors, Theory.
Keywords Polygon patterns, map generalization, perception, Gestalt theory, proximity graphs, minimal spanning tree, cartometrics.
1. INTRODUCTION In automated map generalization research various authors [4, 10] have stressed the role of structure recognition or cartometric analysis as a key step placed at the beginning of the automated generalization process. The main objective of the structure recognition stage is to identify situations (structures) of special importance and select the corresponding objects for an appropriate treatment during map generalization. For instance, islands or
Permission to make digital or hard copies of all or part of this work for personal or classroom use is granted without fee provided that copies are not made or distributed for profit or commercial advantage and that copies bear this notice and the full citation on the first page. To copy otherwise, or republish, to post on servers or to redistribute to lists, requires prior specific permission and/or a fee. ACM-GIS’06, November 10–11, 2006, Arlington, Virginia, USA. Copyright 2006 ACM 1-59593-529-0/06/0011...$5.00.
lakes forming the outline or the core of a structure should never be eliminated [2]. On the other hand isolated islands should not be eliminated as well since they may be an important point of orientation for map users. These two cartographic rules, which are applicable to real-time generalization of internet map services (e.g. Map24.com) as well as to conventional paper map production, should highlight the necessity of structural recognition in map generalization. If these rules are not considered, the general pattern of spatial arrangement of islands or lakes will be lost, as can be seen on any internet map server lacking generalization facilities. Research on cartographic pattern recognition has gained increasing attention in automated map generalization. Much of that work, however, was devoted to the discovery of building structures and road patterns (e.g. building alignments, building clusters, settlement partitioning) in urban settlements [3, 12, 7], due to the importance of the built urban environment in topographic mapping. Less work has addressed the problem of identifying important structures in the natural environment. Müller and Wang [11] presented an approach for the generalization of area patches (islands) and noted that their implementation was not able to preserve archipelago structures. Already earlier in the 1960’s Bertin [2] emphasized the importance of preserving patterns of groups of lakes in map generalization and presented a manual approach which maintains the structures he considered as important. The focus of this paper is on describing a procedure for the recognition of perceptually important island structures. This approach is intended to represent the structure recognition stage for the generalization of islands in topographic and thematic maps. The structure recognition process basically entails four steps which will be explained in the remainder of this paper: 1.
Identifying the important situations (i.e. island structures), discussed in Section 2 and 3.
2.
Formalizing the situation (describing the structures by their construction principles), Section 4.
3.
Developing a structure recognition algorithm, Section 5.
4.
Developing evaluation procedures, Section 6.
Developing detailed application scenarios for map generalization will be part of our future research and is therefore not presented in this paper.
2. WHAT ARE ISLAND STRUCTURES? – THE IMPORTANCE OF BEING SPECIAL
3.
Map generalization aims to preserve typical structures during scale reduction and to emphasize important elements while suppressing the unimportant. The importance of map objects as well as characteristic map objects are usually intrinsically given by the map purpose. Thereby, more specifically, importance is defined by semantics, e.g. a supermarket in a housing area, or by its context with respect to map user perception, e.g. a large building among a group of small houses. Important elements can be either single map objects or small groups of objects. In contrast the typical elements are not outstanding single objects or small groups of objects; rather they are made up of larger number of objects which give the map an ordered overall structure. With respect to our goal of generalizing islands in topographic (and thematic) maps we need to detect on one hand the outstanding single islands and on the other hand the typical (large) and the special (small) island structures. The task which now appears is to formalize such structures and extraordinary islands. Since natural islands have been shaped by tectonic and geomorphologic processes one of the main objectives will be to preserve geomorphologic forms and patterns during generalization. Hence, an initial idea might be to use elevation information and to detect and generalize structures similar to those which are important for relief generalization [17]. However, as we are only dealing with 2-D map data, we have to restrict our procedure to the recognition of 2-D shapes and patterns. We need to go another approach, based on principles of perception.
These three questions will be addressed in subsections 3.2.1 to 3.2.3. The first question should help to classify the identified island structures. Answers to the second question may give hints which pattern recognition methods can be useful to automatically detect the structures. Finally the last question should help to identify measures and rules for the grouping process.
Gestalt theory has extensively dealt with the rules which let humans perceive groups rather than single objects. Especially Wertheimer [18] identified a number of laws of organization in perceptual forms. We argue that the two most relevant laws with respect to map reading and generalization are the Law of Similarity, describing homogeneity among the members of a group, and the Law of Proximity, describing that a group is formed by nearness of the group members to each other compared to other objects, not being part of that group. We consider them the most relevant laws since they have been used by several researchers, to some extent subconsciously, for the recognition of building alignments in map generalization [16]. The laws give us some idea what is important for grouping islands. However, we neither do know how to rank Gestalt properties such as size, shape and orientation against each other for groups formed by similarity nor how to put similarity in relation to spatial proximity. Therefore we decided to make an experiment where people were asked to mark groups of islands on maps. The experiment and a typification of island structures based on the results are described in the next section.
What are the common properties of the members of an island structure?
3.1 Test material and procedure A pencil and paper test has been performed by giving each test person a map showing the islands of the study area of Figure 1. The person was then asked to mark groups of islands of which he/she thinks they belong together. Additional information given to the test participant included three notes: First, that the test area is near the Åland Islands between Finland and Sweden; second, that these patches were skerries and islands originally formed by glacial processes; and third, that islands structures might exist at different scales. More precisely there could be large groups of dozens of islands and small groups of only a few islands. In case that a person wanted to mark such differently sized groups we provided pens of different colors. The time for marking the islands groups was not restricted but took between 5 and 10 minutes. Overall we performed the experiment with 13 persons. Half of the participants (7) were geographers and the other half had a background in geodesy, physics and computer science, respectively. The number of 13 participants may not be sufficient for statistical evaluations but should be adequate to make qualitative statements.
3.2 The study area As already mentioned above the study area is near the Åland Islands. More correctly the islands are located between the Finnish southwest coast and the Åland Islands (see Figure 1). The archipelago consists of skerries, small rocky islands too small to be populated, and other islands formed during the ice age. The Finnish island data were extracted from the ESRI Data & Maps media kit. Since these vector data do not contain information about
3. AN EXPERIMENT: WHAT’S AN ISLAND STRUCTURE TO YOU? A test with people of the GIScience center at the University of Zurich was carried out to identify a basic set of island groups. In more detail the experiments should answer the following questions: 1.
Which types of island structures are perceived?
2.
Which (cognitive) approaches are used to group islands?
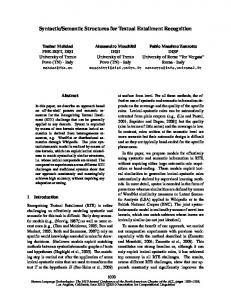
Figure 1. Test data for recognition of island structures. The islands in the box are part of an archipelago south west of Finland. Data © by ESRI.
the spatial resolution, we estimated from the smallest depicted island (with an area of ~5000 m2) that the resolution is in the order of a map scale 1 : 360 000. Very small islands must therefore have been already eliminated from the dataset. To ensure that the selection is not built of random structures we generated histograms to inspect the distributions. We created histograms for three measures: polygon area, fractal dimension, and orientation. The orientation measure used is described in [6] and is defined as length weighted mean orientation of the polygon edges. The area histogram shows a one-sided normal distribution and the fractal dimension a normal distribution. The histogram of the orientation shows approximately a uniform distribution with two strong peaks, one for the north-south and another one for the east-west direction. These peaks seem to be due to the glacial genesis. Apart from these peaks for the orientation histogram, the distributions are as expected. Therefore we conclude that no random island patterns are contained in the dataset.
3.3 Survey results The evaluation of the results consisted of two parts. On the one hand, we reviewed the notes made during the experiment which describe the approach to mark the structures. On the other hand, we analyzed the drawings to demarcate the island groups. In order to facilitate the formalization of islands structures we integrated the drawings of the individual test persons. After selecting the basic set of “core” groups we drew them on a new plot and counted the number of people who found a particular structure. This plot, containing the common set of identified patterns, is shown in Figure 2. The marked groups were then evaluated with respect to the three questions given above.
3.3.1 Types of island structures Two main criteria to typify the marked zones were used by the test persons. One criterion is the shape, the other one the size of the island groups. With respect to shape compact and elongated island groups can be distinguished. With respect to size we can identify at least small (micro) and larger (meso) groups of islands, as it was also suggested by the comments of the test participants. At least four persons introduced additional size levels for the island groups. But here it is difficult to extract reliable limits for the number of islands defining a size level. Rather the levels are given implicitly through part-of relations, whereas a large group can be subdivided into smaller groups. Such a part of relation is for instance visible in Figure 2 and denoted with A. In summary for the study area the persons found approximately five large groups, which we will call meso-structures, where three have compact shape and two have an elongated shape. Apart from the meso-structures about 14 small groups, which we will call microstructures, have been discovered. Here, less than a third can be described as compact, most of them are elongated. The term macro–structure is reserved for very large structures which are usually not perceived without prior knowledge of their existence or generating process [16]. Such a macro-structure is also contained in the test data set. In Figure 1 the study area is shown as part of a large archipelago. Here, one can perceive a curved alignment structure which is also shown as a bold red line in Figure 2.
Figure 2. The combination of island structures chosen by the participants. The numbers next to the structures correspond to the number of participants who marked the structure.
3.3.2 Approaches to grouping Referring to the second question posed above we can assign the participants to three groups according to the mark-up strategy used. The first group, containing nearly half of the people did not show a clear strategy. The second group of five persons used a top-down strategy. They first marked the large island groups and subsequently divided these groups into smaller partitions. Thereby, it was recognized by the test persons that this strategy could not be strictly applied, since some of the micro groups were not considered as being part of a meso structure. Finally the third group, consisting of only 2 persons, used a bottom-up approach, initially forming small groups of islands. Afterwards the two test persons applied a different strategy. One person tried to merge the micro groups, while the other person formed groups from the remaining, not yet assigned islands. Two participants also noted that an object could be part of two or more groups of the same size level.
3.3.3 Member properties of the island groups The evaluation which remains is the description of the members of one island group. Therefore we analyzed the group with respect to the visual variables of cartography introduced by Bertin [2]. The primary variables are (1) position [x,y], (2) size, (3) shape, (4) orientation, (5) color and (6) texture. The variable color, which often is linked to category, is not relevant since all islands have the same meaning and thus the same color. Also texture is irrelevant for our work since our islands are not textured. All other variables should be considered in the evaluation. Note, that in Gestalt theory the position of objects is usually considered from a relative perspective. Therefore the position variable designates spatial proximity. With respect to the variables size, shape and orientation the islands within a group show very heterogeneous characteristics. We can find large and small, compact and complex islands with different orientations in the same group. Thus, it seems that spatial proximity is the key criterion for the perceptual formation of large island groups used by the test persons.
The smaller island groups usually have 3 to 6 members. Four participants did form micro-groups of only two islands. In Figure 2 one can see that the groups with 3 to 6 members show in most cases an elongated form and that the spatial proximity to other islands in the vicinity is usually larger than between the members within a group. A deeper analysis reveals that in our dataset at least five types of micro-groups exist. For the first type the islands seem to be of similar shape, size and orientation, such as the group denoted by G1 in Figure 2. The second type is apparently dominated by a larger island. Here, the orientation of the dominating large island seems to define the orientation of the micro structure (G2). The members of the third type seem to show few commonalities (G3). The only criterion forming these groups is spatial proximity. Hence, these groups have in most cases a compact shape. Finally the fourth and fifth type of micro-structure may be considered as special cases. Probably the islands of group G4 have been considered as group because the composition is approximately symmetric. Symmetry in the group composition is also described in one of laws of organizations by Wertheimer [18]. This Law of Good Gestalt (good continuation principle) refers to group properties which support the process of grouping. Besides similarity these properties are simplicity, closure and equilibrium. In terms of the orientation of the groups we see that some have an approximately vertical direction. It is known from psychology [1], and also mentioned by Wertheimer as the Law of Prägnanz (Law of Conciseness), that visual perception is more sensitive to natural cardinal directions. This implies a better support for the mental grouping of objects into these directions. The consequence for pattern recognition is that special attention should be given to horizontal and vertical alignments, being aware that the spatial proximity principle may be overridden by the Prägnanz principle. An example for such a micro group may be G5.
4. FORMALIZATION OF ISLAND STRUCTURES After we have tried to describe the meso- and micro-structures found by the participants of our test, the next step is to build a catalogue of structures which we aim to detect. In the previous subsection we introduced the notion of micro-, meso-, and macrostructures, relating to group size. From the test results we conclude that micro-structures do consist of 2 to 10 islands, while meso-structures usually contain more than a dozen of islands. Macro-structures finally are very large island compositions which can involve several meso-structures and are usually not perceived without knowledge of their existence. Thus, their constitution can be linked to Wertheimer’s Law of Past Experience. Shape, the second classification parameter, describes the characteristic shape of a group, which one perceives from the so called Structural Skeleton [1, 16]. Basically it seems to be useful to distinguish compact groups and elongated groups. We will call the former clusters and the latter alignments. In the early work reported here, we have focused exclusively on the detection of meso-structures. Thus, we only address the principles forming larger island groups. If we consider our analysis results in Section 3.2.3 we conclude that island structures on the meso level are based only on a single perceptual principle, which is spatial proximity. Other principles may influence the map readers perception but can not be applied to all meso-groups depicted in Figure 2. Therefore we will present in the next section an
automatic approach for the detection of meso-structures based only on the evaluation of spatial nearness.
5. DETECTING MESO STRUCTURES OF ISLANDS 5.1 Algorithm sketch From the previous section we know that meso-structures are mentally formed based on a key principle which is spatial proximity. Thus, the members of one group will have shorter distances to each other than to islands which are not part of that group. Here, we should additionally stress that spatial proximity is a function of the size of the object on which one does focus. This has also been emerged from the experiment. Recognition algorithms for distance based grouping of objects include among others hierarchical agglomerative clustering approaches [9] and distance based graph structures. Inspired by the work of Regnauld [13] who applied a graph based approach for the recognition of building groups we decided to extend from his results. The advantages which this approach shows over a clustering approach will be discussed below. The procedure to detect the meso-structures consists in principle of the following six steps: 1.
Create from the input set of islands a Dynamic Proximity Graph which connects every object with every other object within a certain neighborhood. The output from this procedure will be several large and small groups of islands, whereby isolated islands will not be part of the graph structure (Figure 3-B).
2.
Reduce the proximity graph to a Minimal Spanning Tree (MST). Here we will obtain the structural skeleton of connected islands, that is, the islands will be the limbs of a chain. The advantage of forming a chain is that we only need to split it in specific points to obtain the meso groups. (Figure 3-C).
3.
Select seed islands, which are part of the MST and will form a set of potential cores for meso-structures. (Figure 3-C)
4.
Create Voronoi polygons from theses seeds and trace the MST from every seed to find the connected islands. The tracing will stop at the edges of the Voronoi regions. After this procedure we will obtain an initial set of meso-structures whereby the grouped islands will be within the Voronoi region. (Figure 3-D).
5.
Extend the meso-structures by adding all remaining islands which are connected to only one meso-group. (Figure 3-E).
6.
Finally merge those meso-structures whose seed islands are within a certain neighborhood to each other (see Figure 3-F). The neighborhood can be defined similarly to the neighborhood used in the first step.
After these six steps we obtain as primary output a certain number of meso-structures, whereby the islands of each group are still connected to each other by the graph structure. This will make it easier to handle the groups in further processing stages, e.g. for characterization or use during map generalization. As secondary output isolated islands are obtained which will not be part of any structure. Here, it might be useful to reconnect some of them to a meso-structure, for instance, if they fall within the convex hull of a meso-group.
Figure 3. The steps of the meso-structure detection algorithm: A) original islands, B) dynamic proximity graph and excluded isolated islands C) Minimal Spanning Tree (MST) and seed nodes for candidate groups, D) Voronoi regions of seeds and candidate meso groups, E) extended meso groups, F) final meso-structures after merging. The chosen graph based approach shows several advantages. Firstly, the approach to use a MST is scale free. Although parameter exists (as described below) they need not necessarily be defined with respect to the map scale. Secondly, comparing the graph approach with an agglomerative clustering approach, one needs not to define the final number of clusters. And thirdly, small clusters consisting of only one or two islands are already separated in the beginning and will not further influence the grouping process. In the following subsection we give some more details of the algorithm, which is necessary to evaluate the limitations of the approach in Section 6.
5.2 Algorithm details 5.2.1 Creating a dynamic proximity graph & MST The proximity graph used for the algorithm is an extended version of the data structure described in [14]. What the algorithm does is basically to connect every object with every other object if the connection is below a threshold distance. The specific property of the proximity graph is that the distance between polygonal objects is not calculated between the centroids. Instead the real distance from polygon outline to polygon outline is used. Hence, this graph structure accounts for object size and spatial proximity between the objects. The graph used by Regnauld [14] has a fixed distance threshold. We introduced the distance limit as dynamic parameter and therefore called our version a dynamic proximity graph. This threshold dmax, defining the search neighborhood around a polygon, depends in our version on the size of the polygon itself. The value of dmax(p) is calculated: dmax(p) = k ⋅ r(p). Where k ∈ ℜ is a constant, chosen according to the perceptual recognition limit, and r(p) ∈ ℜ is a radius calculated from the actual polygon. The constant k is assumed to simulate a view
horizon of the eyes in which a person still recognizes objects if focusing the view on the center object. For the determination of the radius r(p) we tested two different models. In one variant we calculated the radius from the area of the polygon by comparing it with a circle of the same area. In the second variant the radius has been defined as half the longest edge of the minimum bounding rectangle (MBR) of the polygon, as illustrated in Figure 4. Hence we obtain a sphere of influence which is proportional to the polygon’s perceptual weight. A second constraint apart from the maximum distance has been introduced. This constraint removes edges, if the connection is established only from one polygon to another and not in both directions. This happens if a small polygon is in the influence zone of a large neighbor polygon but the influence zone of the small polygon is too small to reach the large polygon. This case is illustrated in Figure 4 and denoted with B.
Figure 4. Construction principle of the dynamic proximity graph with two-way edge condition shown on four islands.
In the second step of the algorithm we derive from the proximity graph the MST. This tree structure was first utilized for Gestalt based recognition by Zahn [19] to detect point clusters. Regnauld [13] used this structure for the recognition of building clusters. For our algorithm we used the unmodified implementation of [14]. The resulting node-edge image for islands or building patterns comes quite close to what is called by Arnheim [1] the structural skeleton. Thus the analysis of the MST could be used to characterize the shape of meso-structures, although we will later present a different approach.
5.2.2 Selecting seeds, splitting the MST and creating candidate meso-structures To split the chain of islands represented in the MST into smaller fractions which correspond to the desired meso-structures we need to define appropriate split points. In our approach the split points are implicitly defined as points resulting from the intersection of a line drawn at half distance between the seed objects of two meso-structures and the MST. Therefore we need to define the seed or core objects of possible meso-structures. Assuming that meso-groups have usually a clustered shape, such seed objects must be central and well connected within the meso-group. If one does overlay the reference meso-groups from our experiment and the MST, then one can observe that the centers of the meso-groups correspond to nodes of the MST which have at least four connections. Therefore we used the number of connections of an MST node as criterion to be a seed node for a particular mesostructure. An interesting fact to note is that the criterion of good connectedness does often coincide well with the size of the objects. Thus, within the MST large objects with central position will usually be also well connected objects. As we have now selected our seed objects we could calculate the split points and add all islands between the seed and the split point to a meso-structure. It is difficult to calculate the split point and assign the islands to the meso-groups if the traces from three seeds meet in one MST node (case not shown in Figure 3-C). Therefore we went another approach. The alternative approach is to define the influence zone for every seed node by calculating its corresponding Voronoi polygon [5]. We can then trace the MST and add all islands within the Voronoi region of a seed (see Figure 3-D). After the first tracing, we extend the structure with all islands which are connected with only one seed node and not yet part of the structure (see Figure 3-E). As a result of this process a few islands will not be assigned to any of the structures, e.g. the ones in the center of Figure 3-E. This can not be avoided as it is unclear to which of the surrounding groups they should be connected. Comparing with the results of the perceptual experiment we observe that the participants usually did also not assign such ‘lonely islands’ to a group. Therefore we leave them unassigned, but should also consider forming a new group if they are connected to each other.
5.2.3 Obtaining the final meso-structures The result of the previous stages is a set of candidate mesostructures where the seed points can be very close to each other or directly connected. Thus, from a perceptual point of view it makes sense to merge such structures, if the influence zone of one seed polygon touches or overlaps another seed polygon. The in-
Figure 5. Detected meso-structures and their principal components to describe shape and orientation. Islands with dark outline are outliers of a T2 test with α = 0.25. fluence zones are calculated like in the beginning using dmax either based on the MBR length or the area of the polygon.
6. MESO STRUCTURE DESCRIPTION AND ALGORITHM EVALUATION 6.1 Using the PCA to characterize the mesostructures In Section 4 we noted with respect to the shape of the structures that a distinction can be made into island alignments and island clusters. A determination of the orientation of the detected groups is of interest if one aims to infer the existence of larger islands patterns, such as macro structures, and for the preservation or even exaggeration of the group characteristics during the map generalization process. A method which delivers the orientation directly and the shape indirectly is the Principal Component Analysis (PCA). For a comprehensive introduction to the PCA we refer to Jackson [8]. If one applies the PCA to a point data set where every point is described by [x, y]-coordinates, the transformation will deliver two principal component vectors. These vectors indicate the two main, orthogonal orientations of the point group. Furthermore, the magnitude of the vectors can be used on one hand to identify the main orientation, which corresponds to the larger magnitude, and on the other hand to determine, on the basis of the ratio of the magnitudes, whether the point cloud is compact or elongated. Figure 5 shows the principal component vectors for every detected meso-structure. The darker (greener) the circumscribing hull of the meso-group the higher the ratio of the magnitudes and hence the more elongated is the structure. As pointed out previously the PCA works on individual points, thus it is necessary to transform the island polygons into points. The simple approach would be to use the centroid as representation of an island, but this approach does not account for the visual weight given by the island’s area. Thus, we used the points which describe the outline of an island instead.
6.2 Evaluation of meso-structures 6.2.1 A spatial outlier test The meso-structures obtained from the approach of Section 5 should be evaluated with respect to their interior homogeneity. This is similar to the application of an outlier test. Hotelling’s T2statistics, a multivariate generalization of the student t-test has been recommended as a test prior to performing the PCA [8]. However, the application of the test does not depend on performing a PCA and we therefore propose the test to validate the mesostructures. Since spatial proximity has been the exclusive group forming principle we need to check the group for outliers in the spatial domain only. The confidence limit, defined by the user will form an ellipse; those main axes are similar to the principal component vectors. Points outside the ellipse are considered as outliers. We have applied the T2-test to the meso-structures in Figure 5. Similar to the PCA the input values are the coordinates of the points defining the outline for every island. The islands marked in Figure 5 with a dark border are the resulting outliers for the error probability of α = 0.25 and the condition that an island is considered as outlier if half of its points are outside of the confidence ellipse. Since we are still in an experimental phase we can not yet explicitly recommend how to best exploit automatically the information about potential outliers in subsequent steps. Therefore, at this point, we only propose to check the outlier islands further whether either a few of them are connected or one a certain size of the area is exceeded. If this occurs it could be useful to split these islands from the meso structure, and particularly in the first case, let them form their own meso-group. For instance, this could be done with the island group denoted with A in Figure 5.
6.2.2 Comparison of experimental and detected meso-structures Above we proposed an evaluation approach to be used during the recognition process. Now we shall evaluate whether the algorithm actually delivers, that is, whether it groups a given set of islands into large island structures similar to human perception. Hence we need to compare the algorithm outcome with the set of mesostructures identified by the participants of the perceptual experiment described in Section 3. The evaluation is done visually based on the overlaid results (see Figure 6). The parameter k of the perceptual horizon has been set to k = 3. For both distance calculation variants (polygon area dependent and MBR dependent) the detected structures are similar to the human results of the experiment. Basically the cores of the groups do overlap, but the extents vary, that is the decision which island is still part of one group is different between algorithm and human results. But in the context of this statement we have to mention that the problem of similar group cores with different extents did equally appear in the results of the test persons. From this perspective—and considering that this is still ongoing work—the algorithm results are encouraging, with one exception. This exception concerns the extent of the large cluster in the center of the image. Both algorithm versions add to the meso-structure the left-hand island group which has been considered by the users as separate microstructure, which can be seen in Figure 2. Probably the spatial outlier test described in the previous section will help to identify such situations, enabling to separate this island group from the larger one. If one compares between the algorithm versions dif-
Figure 6. Results of the detection algorithm for mesostructures overlaid on the islands groups perceived by the participants of the experiment. ferences exist in the extent of one meso-group and in the number of meso-structures on the left. Here again the results from the human experiment have been also very different with respect to both, the extent of the lower right meso-structure and the number and shape of large groups on the left. Hence, one cannot say that one algorithm variant is better than the other. To our understanding, as expressed in [15], structure recognition for map generalization should only propose sense making structures. The ultimate decision on acceptance of such a proposal has to be done by the human expert. Thus, it is from our point of view not necessary to discard one algorithm version and we rather recommend testing both algorithm variants.
6.3 Limitations of the algorithm The presented algorithm to detect large island structures works appropriately in comparison to human experiments, as pointed out in the previous subsection. Similar results have been obtained for two other test dataset. However, at least two shortcomings exist presently. The first is that the user has to define the parameter k for the creation of the proximity graph. For our test data the value k = 3 worked well. However, the problem that the large mesogroup in the center of the test area aggregates the left-hand microgroup (denoted with A in Figure 5), does show that a fine tuning is necessary. This can happen during the processing in either decreasing the parameter k, here the large islands will not be connected anymore; or by selecting the right large island (left of A in Figure 5) as further seed point. Applying a post processing strategy one could split the group again after the outlier test as a third variant. The second weakness of the proposed approach relates to the selection of seed points for the candidate structures. Currently we did choose all islands having at least four outgoing edges in the MST. Thus, a single small island either added to the large island in the previous example or removed from a seed island of the meso-group on the left side in Figure 6 may change the results dramatically. Thus, priority for future refinements must be given on finding a more robust method to define the seed islands for the candidate meso-structures.
7. FUTURE WORK This paper reported on work on the automated recognition of large island structures for map generalization. The work is still ongoing. Objectives for our future research emerge especially from the evaluation in the previous section. The comparison of the human results with the island groups formed by the algorithm shows that a splitting of large groups should be considered. Therefore it seems to be useful to develop a split procedure based on the outlier detection presented in Section 6.2.1. The evaluation of the grouping procedure revealed that the current seed selection method based on the MST edge connection is not sufficiently robust to small changes in island configurations. Hence, alternative selection methods have to be explored. A further point of interest is a better shape analysis for elongated island structures. Here it is useful with respect to the map generalization process to distinguish between curved and straight island alignments. Such an advanced method could be based on the analysis of the MST edges, forming the structural skeleton. Apart from these improvements the next major objective is to develop recognition algorithms for the micro-structures. This objective demands to further analyze the forming principles of such structures. Our evaluation of the user test in Section 3.3.3 has shown that principles of Gestalt theory may form a sound base to accomplish this task. Finally, once the algorithms for detection of micro- and meso-structures have been developed and validated on a range of different study areas with different characteristics, it will be necessary to specify and test application scenarios during the process of automated map generalization.
8. ACKNOWLEDGMENTS The research reported in this paper was partially funded by the Swiss NSF through grant no. 20-101798, project DEGEN. We especially like to thank Nicolas Regnauld of the Ordnance Survey (GB) for providing his graph library and Sara I. Fabrikant for her assistance in the experimental design part of this project.
9. REFERENCES [1] Arnheim, R. Art and visual perception: A psychology of the creative eye. University of California Press, reprint 2004. [2] Bertin, J. Semiology of graphics: Diagrams, networks, maps. University of Wisconsin Press, Madison, 1983. [3] Boffet, A. Méthode de création d’information multi-niveaux pour la généralisation cartographique de l’urbain. Ph.D. Thesis, Université de Marne-la-Vallée, 2001. [4] Brassel, K., and Weibel, R. A review and conceptual framework of automated map generalization. Int. Journal of Geographical Information Systems, 2, 3 (1988), 229–244.
[5] De Berg, M., van Kreveld, M., Overmars, M. and Schwarzkopf, O. Computational Geometry – algorithms and applications. Springer-Verlag, 2000. [6] Duchêne, C., Bard, S., Barillot, X., Ruas, A., Trevisan, J., and Holzapfel, F. Quantitative and qualitative description of building orientation. Fifth Workshop on Progress in Automated Map Generalization. Paris, 2003. [7] Heinzle, F., Anders, K-H., and Sester, M. Pattern Recognition in Road Networks on the Example of Circular Road Detection. In: Proceedings of GIScience, Münster, 2006. [8] Jackson, J. E. A user’s guide to principal components. John Wiley & Sons (imprint 2003), New York, 1991. [9] Jain, A.K., Murty, M.N., and Flynn, P.J. Data Clustering: A Review. ACM Comp. Surveys, 31, 3 (Sept. 1999), 264-323. [10] McMaster, R., and Shea, K.S. Generalization in Digital Cartography. Association of American Geographers, Washington, 1992. [11] Müller, J.-C., and Wang, Z. Area-patch generalization: A competitive approach. The Cartographic Journal. 29, 2 (Dec. 1992), 137-144. [12] Mustière, S. Cartographic generalization of roads in a local and adaptive approach: A knowledge acquisition problem. Int. Journal of Geographical Information Science. 19, 8-9 (Sept.-Oct. 2005), 937-955. [13] Regnauld, N. Contextual Building Typification in Automated Map Generalization. Algorithmica, 30 (2001), 312333. [14] Regnauld, N. Spatial structures to support automatic generalisation. In: Proceedings of XXII Int. Cartographic Conference. La Coruña, 2005. [15] Steiniger, S., and Weibel, R. A conceptual framework for automated generalization and its application to geologic and soil maps. In: Proceedings of XXII Int. Cartographic Conference. La Coruña, 2005. [16] Steiniger, S., and Weibel, R. Relations and structures in categorical maps. 8th ICA Workshop on Generalization and Multiple Representation. A Coruña, 2005. [17] Weibel, R. Models and experiments for adaptive computerassisted terrain generalization. Cartography and Geogr. Information Systems. 19, 3 (1992), 133-153. [18] Wertheimer, M. Laws of organization in perceptual forms. English translation published in W. Ellis (ed.). A source book of Gestalt psychology. Routledge & Kegan Paul, London, 1938, 71-88. [19] Zahn, C.T. Graph-theoretical methods for detecting and describing gestalt clusters. IEEE Transactions on Computers, C-20, 1 (Jan. 1971), 68–86.