Recognizing and Simulating Sketched Logic Circuits Marcus Liwicki1 and Lars Knipping2 1
2
Department of Computer Science, University of Bern, Neubr¨ uckstr. 10, CH-3012 Bern, Switzerland
[email protected] Freie Universit¨ at Berlin, Institut f¨ ur Informatik, Takustr. 9, 14195 Berlin, Germany
[email protected]
Abstract. This paper presents a system for recognizing sketched logic circuits in real-time and graphically simulating them afterwords. It has been developed for use in university and school education. Circuit gate symbols are recognized using a multilayer perceptron network. The simulation is fully controlled by hand-drawings, and the inputs to circuits can be defined by writing numbers next to them. In addition to the simulation of simple circuits, recursive circuits can also be handled by the system. Furthermore, clock elements can be added for the purpose of synchronization, and circuits can be stored to be reused as sub-circuits, allowing the user to build arbitrary complex configurations. The usability of the system has been tested in a small video-taped laboratory test.
1
Introduction
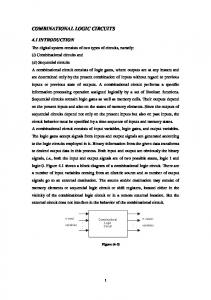
In this paper a system for recognizing and simulating sketched logic circuits is presented. The tool has been developed for use in university and school teaching. It is used within a lecture recording system based on a chalkboard as user interface, called E-Chalk [4, 5]. With the E-Chalk application a lecturer can do freehand writing and drawing using a pen-based input device. In the context of the presented system, drawings of logic circuits can be recognized on-line, and the circuits can be graphically simulated for the audience. A number of systems using sketched inputs for other types of applications have been developed recently. For example DENIM [13] allows to build web pages by drawing, SketchySPICE [9] is a simple-circuit CAD-tool, Tahuti [7] is used for creating UML diagrams by sketches, and ASSIST [1] is a sketched-based CADtool. For the E-Chalk system mentioned above, applications for animations of algorithms [3], simulating biological and pulse-coded Neural Networks [10, 11], and interpretation of handwritten Python scripts using the Microsoft Handwriting recognizer [10] have been realized in our previous work. Most of them are used in education for visualizing complex processes. It is also useful to visualize the processes of logic circuits with simulation engines, like it is done in [8, 12]. These systems rely on drag-and-drop interfaces or textual circuit definitions for input. Previous approaches for recognizing
E−Chalk System Board GUI
user input
chalklet strokes
StrokeQueue
chalklet strokes
user drawn strokes + undos
Chalklet
Fig. 1. Screen shot of the circuits simulator chalklet
Fig. 2. Illustration of the E-Chalk interface
sketched circuits have also been developed. In [15] a system for off-line recognition focusing on tracing connection lines and their intersections is described. To the knowledge of the authors no integrated system for recognizing sketched logic circuits and simulating them afterwords exists. This would be applicable during lectures with a pen-based interface for education. The rest of the paper is organized as follows. In Sect. 2 the functionality of the logic circuit simulator is presented, and an overview of the interface to the e-learning system is given. Section 3 describes the recognition for the sketched circuits and Section 4 presents the graph-based simulator. Finally, Sect. 5 draws some conclusions and gives an outlook for future work.
2
User Interface
The system for recognizing and simulating logic circuits provides many functionalities to the user. Several functionalities can be accessed by using special colors or by drawing small strokes within a given region, which is interpreted as activating an element. If the user draws a background colored stroke on a previously sketched element, for instance, it is completely removed by the system. Figure 1 shows a screen shot of the graphical user interface. The system has been produced for processing pen-based on-line data. This data can be acquired with a digitizer tablet, with a digitizing whiteboard, or by using a Tablet PC. The system is designed as a plug-in, a so called chalklet, for the E-Chalk system [10]. All strokes drawn by the user into the chalklets area are sent to it. The chalklet receives the strokes and reacts for instance by writing strokes into the area to work as a real-time engine. An illustration of the interface to the E-Chalk system is given in Fig. 2. The stroke data consists of a time stamped point sequence, a stroke color, and a drawing width. The color information allows us to define different input modes and the drawing width is used for measuring distances between drawn elements. The system described in this paper recognizes the five logic symbols for and, or, not, multiplexer, and demultiplexer. The symbols for the gates follow the notation of the hades system [8], which is also widely used in literature. Examples for these symbols are given in Fig. 3. The user has to start drawing symbols from
Fig. 3. Gates which are recognized by the system (from left to right): and, or, not, multiplexer, and demultiplexer ; the visual feedback of the system is illustrated in black
one of the ending points at the input side of the gate, and the symbol can be drawn into four directions, i.e. the input side can be on the left, at the top, at the bottom or on the right. One predefined color is reserved for drawing wires and gates. The system detects the type of the elements and gives a visual feedback at the center of its bounding box. For an example see the five gates in Fig. 3. Each gate can be used with an arbitrary number of inputs and outputs. The leftmost of the three buttons at the bottom of the panel shows the number of inputs and outputs of the circuit, see Fig. 1. For a detailed description of the recognition process see Sect. 3. For simulating the sketched logic circuit there are two possibilities. First, a simulation can be started by drawing a one (high) or a zero (low) in the color reserved for logic level input. The system then sets the nearest input of the circuit to the corresponding state. The result is visualized by repainting the stroke in the color of the corresponding logic level. As described in Sect. 4 the states of all connected wires are updated immediately. Note that the state of an input can be changed anytime by drawing a new input value. The second possibility for starting the simulation is to activate the button with the caption “Run” shown in Fig. 1, i.e. to draw a small stroke inside the button area. Then all possible combinations of the uninitialized inputs of the circuit are simulated sequentially. The simulator also allows the user to synchronize the gates with a timer. A clock symbol, drawn in a third reserved color, can be connected to the desired gates of the circuit, see Fig. 4. The connected gate retains its output until one clock cycle elapsed, as if a D-Flip-Flop is connected to the outputs of the gate. A clock can be started and stopped by activating the clock symbol. Figure 4 also illustrates another feature of the chalklet, namely displaying a state-timing diagram, which can be switched on before starting the application. For every clock cycle the states of the inputs and outputs of the circuit are then illustrated in the diagram. If no timer is present all circuit states are added to the diagram for each change of the circuit input. For clarity the inputs and outputs are numbered from top to bottom in the state-timing diagram, see for example the RS-Flip-Flop shown in Fig. 4 where input I1 is used for resetting and input I2 for setting the output O1. Another feature is the possibility to save a circuit with a self-defined symbol and to reload it in future sessions. The symbol of the circuit can be drawn in the input and output displaying box mentioned above, see Fig. 4. By activating the
state-timing diagram
I1 I2
O1 O2
clock symbol
Fig. 4. RS-Flip-Flop and a state-timing diagram
button labeled “Save” the graph and the symbol of this circuit is stored into a repository of circuits. In later sessions it can be loaded by drawing a rectangle in place of the stored sub-circuit with a fourth reserved color. All symbols of the repository are drawn in the right part of the chalklet area. The user selects the circuit by activating the corresponding symbol box. The system then marks the drawn rectangle with the symbol and the inputs and outputs. See Fig. 5 for an example of integrating a previously defined RS-Flip-Flop into the circuit. To test the system for usability a small video-taped laboratory test [2] has been conducted. Eight users with different background knowledge about logic circuits received a 15 minute introduction. They were asked to solve exercises and were interviewed afterwards. As a results distance thresholds have been relaxed because some test persons experienced difficulties connecting the elements.
3
Recognition
The recognition of a drawn circuit element is performed whenever a stroke in the color for gate and wire elements is received. First, the system has to determine if a logic symbol or a wire has been drawn. Gates are assumed to be closed, i.e. the distance from the start of the stroke to the end must be below a predefined threshold. Next, the function of the drawn element is detected. In the case of a gate a multilayer perceptron network is applied for classification. In the case of a wire the connections to gates and other wires are identified. Figure 6 illustrates the steps for recognizing a drawn circuit element. Before the recognizer can be applied to classify the symbols, some preprocessing steps are needed to normalize the input data. Most preprocessing steps are adopted from [6]. First, the stroke is rotated and mirrored so that it starts in the upper left corner and then moves to the right. This normalization procedure reduces the number of possible ways to draw the symbol, one for laying it out with horizontal and one for laying it out with vertical inputs and outputs. The normalization is completed by scaling the stroke to fit into the unit square. Then the data is smoothed by averaging the point coordinates with its previous and next neighbors using the window (0.25, 0.5, 0.25). After that the stroke is
drawn element
1. user draws a box 2. user selects gate on the right 3. application draws the loaded gate
wire no normalize
yes
determine type
extract features classify recognized gate
Fig. 5. Loading a previously saved RS-FlipFlop into the chalklet
recognized wire
Fig. 6. The recognition process for drawn circuit elements
interpolated and re-sampled to a fixed number n of equidistant points. Tests on the validation set described below showed n = 20 to be a good choice. From the sampled point sequence si = (p0 , p1 , . . . , pn ) the following local features are calculated as input for the classifier: the position (x, y) of each point pi and the sine and cosine between the line (pi , pi+1 ) and the x-axis. In addition to the local features of each point, some global features are introduced. First, to avoid data loss during re-sampling, the coordinates of the points obtained in the first five interpolation steps of the recursive algorithm, are used as features. Next, twelve further points are used. These are the nearest points to the corner points of the bounding box using three different metrics: δα (p, q) = α ∗ |px − qx | + |py − qy |
(1)
For the first metric α is set to one. For the second metric α is five and for the third metric it is set to 0.2. The described twelve points help to differentiate between the and and the multiplexer symbol. Additional local features proposed in [6] turned out not to be useful for the recognition of logic symbols in the experiments on the validation set described below. For further details see [14] The classifier we use is a fully connected multilayer sigmoid perceptron network. The network has a single hidden layer. It has been trained using the backpropagation algorithm RProb. For further informations on the training algorithm see [16]. The training data consists of 700 drawn symbols, i.e. 70 samples for each circuit element and both possible orientations. These symbols have been drawn by five persons. It was assured that symbols representing extreme cases have been added. The data was split into 500 samples for training the network and 200 samples for validating the number of perceptrons in the hidden layer. The optimum was found at eleven elements in the hidden layer. For wires, three different kinds have to be distinguished: inputs, outputs, and connectors. For classification, it is first analyzed whether it touches the input or output side of a gate. Then any connection via a touching wire is recursively considered.
Input Pin
Wire And
Input Pin
Wire
Output Pin
Wire
Fig. 7. Graph representation of an and with two inputs and one output - the input and output pins are not visible in the GUI
4
Fig. 8. The output state of the and remains undefined because it is not stable
Simulation
For the simulation an internal graph representation of the circuit is created. This representation is motivated from the graph representation in [8]. The edges of the graph are the connection points of wires and gates or between two wires. For an example graph representation for an elementary circuit see Fig. 7. For the connection of gates and wires the direction of the signal flow is defined by the direction of the gate symbol. For all other connections the direction is calculated recursively by using the information of the neighboring wires. This direction determines if a wire end serves as input or output of the circuit. As described in Sect. 2 the engine can simulate the logic circuits asynchronously and time synchronously. The asynchronous simulation starts immediately after each change of the inputs of the circuit. The new signal is transmitted through the wire to all neighboring elements. For each neighbor the new output states of the corresponding elements are computed. If any state changes, the new signal is further transmitted until a stable state is reached. A wire’s state is set to undefined if no stable state exists, see for example Fig. 8. If the signal of two symbols is transmitted by a gateless connection to one wire, the connection behaves as an or and transmits the new signal to all neighbors. In time synchronous simulation, all changed connections are stored in a queue. At the end of each clock cycle all output changes are transmitted to the corresponding wires.
5
Conclusions and Future Work
The system presented in this paper is able to recognize and simulate sketched logic circuits in real-time. All user interaction can be handled with a pen-input device. The main functionalities are recognizing and simulating wires and gates with an arbitrary number of inputs and outputs, synchronizing the gates with a timer, displaying a state-timing diagram, and saving circuits with user-defined symbols for using them as sub-circuits in a more complex configuration. The system has been developed for use in education. In the future we plan to enhance the logic circuit recognition system with more functionalities. The number of recognized gates will be enlarged. We also want the user not having to change the color and switch between different modes, to make the creation and simulation of complex circuits even faster. Part of the
methods in this work are also suitable in other areas of sketch recognition, such as a molecule recognizer for education in chemistry or an interactive assistant for geometric proving in mathematics.
References 1. Alvarado, C., Davis, R.: Resolving ambiguities to create a natural computer-based sketching environment. In: Proceedings of the International Joint Conference on Artificial Intelligence (IJCAI), Seattle (WA), USA (2001) 1365–1374 2. Dumas, J.S., Redish, J.C.: A Practical Guide to Usability Testing. Intellect Books (1999) 3. Esponda Arg¨ uero, M.: A New Algorithmic Framework for the Classroom and for the Internet. PhD thesis, Freie Universit¨ at Berlin, Institut f¨ ur Informatik (2004) 4. Friedland, G., Knipping, L., Schulte, J., Tapia, E.: E-Chalk: A lecture recording system using the chalkboard metaphor. Interactive Technology and Smart Education (ITSE) 1 (2004) 9–20 5. Friedland, G., Knipping, L., Tapia, E.: Web based lectures produced by AI supported classroom teaching. International Journal of Artificial Intelligence Tools (IJAIT) 13 (2004) 367–382 6. Guerfali, W., Plamondon, R.: Normalizing and restoring on-line handwriting. Pattern Recognition 26 (1993) 419–431 7. Hammond, T., Davis, R.: Tahuti: A geometrical sketch recognition system for uml class diagrams. In Stahovich, T., Landay, J., Davis, R., eds.: Papers from 2002 AAAI Spring Symposium on Sketch Understanding, Palo Alto (CA), USA, AAAI Press (2002) 59–66 Technical Report SS-02-08. 8. Hendrich, N.: HADES: The Hamburg design system. In: EASA’98 (European Academic Software Award)/ Alt-C Conference: Lifelong Learning on a Connected Plane, Oxford, UK (1998) 9. Hong, J.I., Landay, J.A.: SATIN: a toolkit for informal ink-based applications. In: Proceedings of the thirteenth annual ACM symposium on User interface software and technology (UIST), San Diego (CA), USA, ACM press (2000) 63–72 10. Knipping, L.: An Electronic Chalkboard for Classroom and Distance Teaching. PhD thesis, Freie Universit¨ at Berlin, Institut f¨ ur Informatik (2005) 11. Krupina, O.: Client-Server Architecture for a Neural Simulation Tool. PhD thesis, Fachbereich Mathematik und Informatik, Freie Universit¨ at Berlin (2005) To appear. 12. Li, L., Huang, H., Tropper, C.: Dvs: An object-oriented framework for distributed verilog simulation. In: 17th Workshop on Parallel and Distributed Simulation. (2003) 173 – 180 13. Lin, J., Newman, M.W., Hong, J.I., Landay, J.A.: DENIM: finding a tighter fit between tools and practice for web site design. In: Proceedings of the Conference on Human Factors in Computing Systems (CHI), The Hague, The Netherlands, ACM press (2000) 510–517 14. Liwicki, M.: Erkennung und Simulation von logischen Schaltungen f¨ ur E-Chalk. Diploma’s thesis, Fachbereich Mathematik und Informatik, Freie Universit¨ at Berlin (2004) 15. N. Masayuki, A. Takeshi, I.H.: Pattern recognition for logical circuits diagrams written by freehand. Technical Report 015 - 002, SIGNotes Computer Graphics and cad (1984) 16. Rojas, R.: Neural Networks. A Systematic Introduction. Springer Verlag (1996)