10.1109/ULTSYM.2010.0370
Reconstructing Transducer Surface Motion by Inverse Extrapolation of Measured Pressure Wavefields E.J. Alles
M.D. Verweij
K.W.A. van Dongen
Laboratory of Acoustical Imaging and Sound Control Delft University of Technology Delft, The Netherlands Email:
[email protected]
Laboratory of Electromagnetic Research Delft University of Technology Delft, The Netherlands Email:
[email protected]
Laboratory of Acoustical Imaging and Sound Control Delft University of Technology Delft, The Netherlands Email:
[email protected]
Abstract—Optimising the design of medical ultrasound transducers requires precise knowledge of the motion of the transmitting elements, especially if cross-talk between neighboring elements plays a significant role. Direct measurement of the motion of the elements is complicated. Therefore we propose to compute these velocity profiles from a pressure field measured in a plane parallel to the surface of the transducer. The method employs an inverse extrapolation of the measurements using an analytical deconvolution based on Weyl’s representation of the Green’s function. The method is tested for transducers operating in the MHz-range and with spatial dimensions in the order of 100 µm. Both measured and simulated pressure fields are used to investigate its performance. It is shown that relevant results, in terms of energy localisation and temporal behaviour, can be obtained for realistic distances between the transducer and measurement planes and for coarse sampling grids. In addition, the results show that sharp reconstructions of the velocity profiles are only possible if fine measurement grids are used and if the measurement distance is less than a wavelength of the ultrasound wave field.
even more challenging as new medical ultrasound transducer designs tend to utilize increasingly higher frequencies [5], while reducing the size and increasing the number of elements in an array [6]. In order to avoid the aforementioned difficulties with direct measurements, we propose a method based on indirect measurements. The method utilizes measurements of the pressure field over a plane parallel to the transducer surface, which are subsequently used to compute the normal component of the transducer surface velocity (referred to as the ”velocity profile”). In some research areas, this technique is referred to as Nearfield Acoustical Holography [7]. A study on this subject was performed by Sapozhnikov et al in [8] where holograpy results obtained using time-reversed acoustics were compared to LDV measurements. In this work we study the inversion of Rayleigh’s integral (a quantification of Huygens’ principle) using Weyl’s representation of the Green’s function [9], [10].
I. I NTRODUCTION
II. T HEORY
In medical ultrasound, array technology is used to efficiently scan three-dimensional volumes. Preferably, each active element vibrates independently to achieve maximum freedom in e.g. beam steering. However, cross-talk (mechanical coupling between neighboring elements) causes areas larger than the individual elements to vibrate. By making appropriate choices for materials and constructions during the design phase, the cross-talk can be reduced [1], [2]. Making those choices requires precise knowledge of the velocity profile of the transducer surface. The motion of a transducer surface is both hard to predict and to measure; available models are often incomplete or insufficiently accurate, and accelerometers and other contactmethods disturb the motion due to their inertia [3]. A viable option is the usage of Laser Doppler Vibrometry (LDV) [4]. This can be used for structures submerged in water where it can generate spot sizes of 20 µm or less while operating at frequencies of 20 MHz and above. However, this requires specialized and expensive hardware. The problems become
978-1-4577-0380-5/10/$25.00 ©2010 IEEE
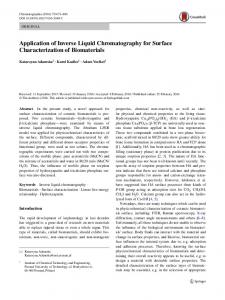
The configuration studied is shown in Fig. 1. A number of vibrating transducer elements is located in the planar spatial domain Sv in which each point has a Cartesian coordinate rv = (xv , yv , zv = 0). At a distance d apart from Sv , the pressure is measured in the planar spatial domain Sp in which each point has a Cartesian coordinate rp = (xp , yp , zp = d). First forward extrapolation (’propagation’) will be treated, followed by inverse extrapolation (’backpropagation’). The latter includes the analytic deconvolution using Weyl’s representation of the Green’s function. Finally, issues concerning evanescent wave fields will be discussed. A. Forward extrapolation The acoustic pressure field pˆ(rp ) generated by the velocity profile vˆn (rv ) equals Z ˆ p − rv )dA(rv ), pˆ(rp ) = 2iωρ vˆn (rv )G(r (1)
1458
rv ∈Sv
2010 IEEE International Ultrasonics Symposium Proceedings
From equation (4) follows that v˜n (kx , ky , z = 0) =
p˜(kx , ky , z) . ˜ x , ky , z) 2iωρG(k
(6)
˜ x , ky , z) can be computed numerically using FFTs. Here G(k However, for a homogeneous medium it is computationally ˜ x , ky , z). more efficient to find an analytic expression for G(k
Fig. 1. Sketch of the configuration described in this work. The five transmitting elements depicted in gray and located in the plane Sv radiate an acoustic field which is measured in the plane Sp . A point in Sv is indicated by a position vector rv , and a point in Sp is indicated by a position vector rp .
C. Weyl’s representation of Green’s function ˜ x , ky , z), G(r) ˆ To obtain an analytic expression for G(k is first transformed to the {kx , ky , kz , ω}-domain by performing a three-dimensional Fourier transform. Next an inverse spatial Fourier transform with respect to kz is applied. This inverse Fourier transform can be computed using Cauchy’s residue theorem and yields
with the Green’s function −ikkrp −rv k ˆ p − rv ) = e G(r , 4π krp − rv k
(2)
in which the symbol ˆ. is used to indicate that a given variable is defined in the temporal Fourier domain, ω is the angular frequency, ρ is the volume density of mass of the background medium, k = ωc is the wavenumber with c the propagation velocity, and k.k is the length of a vector. In the literature, this integral is referred to as the Rayleigh integral of the first kind [11]. Note that surface Sv should be chosen large enough to enclose all regions in which vˆn (rv ) is non-zero. Fourier domain variables are obtained via the temporal Fourier transform Z∞ ˆ ˆ f = f (ω) ≡ f (t)e−iωt dt. (3) −∞
(4)
where the symbol ˜. is used to indicate that a variable is given in the wavenumber-frequency domain, with corresponding wave numbers kx and ky . The wavenumber-frequency domain results are obtained via a double spatial Fourier transformation of frequency domain variables, i.e. f˜(kx , ky , z) ≡
Z∞ Z∞
(7)
where q ω22 − kx2 − ky2 for c q kz = −i ω2 − k 2 − k 2 for x y c2
ω2 c2
≥ kx2 + ky2
ω2 c2
< kx2 + ky2
.
(8)
This representation was first used by Weyl [9] and is therefore known as Weyl’s representation of the Green’s function. From equation (8) it can be observed that kz is only real 2 valued for ωc2 ≥ kx2 + ky2 , a situation resulting in the formation of propagating waves. In the remaining cases, kz becomes imaginary, resulting in the formation of evanescent waves. These evanescent waves decay exponentially upon propagation and cause problems upon inverse extrapolation. D. Evanescent waves
Similar to Huygens’ principle, equation (1) states that the pressure at rp can be described by the sum of the pressures of a collection of point sources in Sv . The spatial convolution present in equation (1) can be computed efficiently in the wavenumber domain, viz. ˜ x , ky , z), p˜(kx , ky , z) = 2iωρ v˜n (kx , ky , z = 0) G(k
−ikz |z| ˜ x , ky , z) = e , G(k 2ikz
In the forward problem, evanescent waves pose no problem – since the corresponding exponential factor in equation (4) is decaying. In the inverse problem, however, the corresponding exponential factor in equation (6) is growing, i.e. evanescent waves increase exponentially and so does the numerical and/or experimental noise that is present in the data. This makes the inversion process numerically unstable. To overcome this problem, the velocity profile v˜(kx , ky , z = 0) in equation (6) will only be computed from the propagating wave fields while neglecting the evanescent wave fields. Consequently, results are expected to be smoothed, as waves represented by high wavenumbers are discarded upon inversion. III. E XPERIMENTS
fˆ(x, y, z, ω)ei(kx x+ky y) dx dy.
(5)
−∞ −∞
B. Inverse extrapolation In this work, our main concern is with the inverse problem, i.e. reconstructing velocity profiles from measured pressure fields. Since the forward problem amounted to a convolution, the inverse problem is composed of a deconvolution problem. The simplest approach to solve this problem is spectral division.
In this section first the spatial discretisation and method for the forward extrapolation will be studied, followed by in silico and finally experimental inverse extrapolation studies. All numerical experiments are based on the geometry shown in Fig. 1, i.e. five elements of 200 µm × 700 µm are placed centrally in the spatial domain Sv , which is a plane with dimensions 3.2 mm × 3.2 mm. The dimensions of the spatial domains Sv and Sp are equal. The background medium is water, with a speed of sound c = 1500 m/s. Each element
1459
2010 IEEE International Ultrasonics Symposium Proceedings
Fig. 2. The transient signals applied to the five elements. On the left the Gaussian pulse with a spectrum that is centered around 10 MHz is shown, on the right a single time slice of the original velocity profile is depicted.
is driven with a Gaussian pulse having a spectrum that is centered around 10 MHz (λ10 MHz = 150 µm), see Fig. 2. The elements have the same phase but different amplitudes. Two spatial discretations are considered; a coarse sampling of three points per wavelength at the center frequency, which amounts to squares of 50 µm × 50 µm, and a fine sampling of ten points per wavelength, yielding element sizes of 15 µm × 15 µm.
Fig. 3. Forward extrapolation results for the transducer geometry shown in Fig. 1 and the source signals shown in Fig. 2. In the top row d = 4 µm, in the bottom row d = 4 mm. The left column is based on a spatial discretisation of three points per wavelength, the right column on ten points per wavelength. Note that only for large d a coarse grid yields the same results as a fine grid.
A. Forward Extrapolation To determine the effect of spatial discretisation on the resulting pressure field, multiple pressure fields are computed for several discretisations and measurement distances d. The forward extrapolation is computed in the wavenumber domain using equation (4). The Fourier transforms are computed efficiently using FFTs, at the cost of an increase in memory load due to zero-padding of the velocity field. The results are shown in Fig. 3, and from this figure it is clear that reliable results for the pressure fields for all physically relevant distances d can be obtained using a discretisation of ten points per wavelength at the center frequency of the excitation pulse. This is in agreement with results from other studies. For large d a coarser grid suffices, the pressure field is smoother, i.e. it lacks the higher spatial frequencies that play a significant role in the near field. B. Inverse Extrapolation – In Silico To demonstrate the (in)stability of inverting evanescent waves, the pressure field at d = 400 µm is computed for the situation sketched in Fig. 1, together with the velocity profile of Fig. 2. A fine discretisation is applied using elements of 15 µm × 15 µm. The resulting velocity profiles obtained by inverse extrapolation that both in- and excludes evanescent waves, are shown in Fig. 4. The effects caused by the instability are clearly visible, and the results confirm that evanescent waves should be omitted upon inverse extrapolation. In section III-A it has been shown that for a large distance d a coarse grid sufficed, whereas for small d a much finer grid was required. This experiment is repeated, but now for the inverse problem. The results are shown in Fig. 5, where the applied distances are d = 4 µm and d = 4 mm, and for both three and ten points per wavelength. The same conclusion holds; smaller distances require finer spatial sampling. However, too coarse sampling leads to wrong amplitudes
Fig. 4. Single time slices of the inverse extrapolation results using analytical deconvolution, both in- (left) and excluding (right) evanescent waves. The discretisation amounts to ten points per wavelength and d = 400 µm. Note the strong errors along the edge of the domain if evanescent waves are included in the inversion, indicating the numerical instability. In the left figure, the velocity axis has been clipped to improve clarity.
and erroneous temporal behaviour; both phase and frequency differences occur. As can be observed in Fig. 5, at large distance d the reconstruction results are smoothened. Much sharper reconstructions are obtained at small d. However, to obtain sharp reconstructions the distance d should be in the order of the wavelength of the acoustic signal or less, which is an unrealistic requirement for MHz-range transducers. Nevertheless, measurements at larger distances of several tens of wavelengths still yield reasonable results; the motion of the five separate elements can still be distinguished, even on a coarse grid. Note that in all cases presented in Fig. 5, Gibbs’ phenomena are present due to spatial discontinuities in the velocity profile. However, their effects are minor. C. Inverse Extrapolation – Experimental Finally the method is applied to actual measurements. For the measurements a small rectangular transducer of dimensions 200 µm × 100 µm and resonance frequency of 30 MHz was built, see Fig. 6, which is excited by a Gaussian pulse
1460
2010 IEEE International Ultrasonics Symposium Proceedings
Fig. 6. A microscope image (left) of the transducer, taken after removing only the loose matching layer membranes, clearly shows damage to the transducer. The red rectangle indicates the location of the actual active element. In the timeslice of the inversely extrapolated velocity profile (right), the locations and shapes of the vibrating areas coincide with the damaged areas of the transducer. Note that no motion is present at the location of the transducer element. The size of the dotted box is 3 mm × 2.4 mm. Fig. 5. Reconstructed velocity profiles using different distances d and discretisations. The geometry of Fig. 1 is used, and only analytical deconvolution is applied. Similar to Fig. 3, in the top row, the distance d = 4 µm, in the bottom row d = 4 mm. The left column is based on a spatial discretisation of three points per wavelength, the right column on ten points per wavelength. The top left figure, small d and coarse discretisation, clearly has a wrong amplitude. Not visible in the figure is the erronous temporal behaviour of the result of that same situation.
with a spectrum centered around 30 MHz (λ30 MHz = 50 µm). Coarse sampling was applied, using grid elements of dimensions 65 µm × 65 µm (0.77 points per wave length), at a distance d = 1.7 mm. Note that a finer discretisation will not necessarily result in better results, since the employed hydrophone has a diameter of several hundreds of micrometers and thus introduces strong spatial smoothing. In Fig. 6 the velocity profile obtained using analytic deconvolution for the situation described above is shown. Evanescent waves are omitted. In red the location of the transmitting element is indicated. At a first glance the result seems completely wrong, however, close inspection of the transducer under a microscope revealed that it was damaged; water was able to get underneath the supposedly waterproof matching layer. By means of electrolysis the structure underneath the matching layer was dissolved, resulting in a thin, loose membrane stretched between what remained of the original structure. It are these membranes rather than the actual element that account for the velocity profile in Fig. 6. The absence of motion at the site of the actual transducer element suggests that the element was damaged as well. Nevertheless, the experiment shows the possibility to reveal a detailed velocity profile of a transducer. IV. C ONCLUSION A method is presented to compute the surface motion of a transducer from pressure field measurements in a plane parallel to its surface. The method employs an inverse extrapolation of the measurements using an analytical deconvolution based on Weyl’s representation of the Green’s function. In order to stabalize the inversion, evanescent waves are omitted. Numerical and actual experiments on MHz-range transducers with dimensions in the order of 100 µm have shown that
some spatial smoothing is introduced by omitting evanescent waves, and that this smoothing effect increases in strength with increasing measurement distance. The results indicate that short measurement distances and fine sampling yield the best results. Sharp reconstruction is only possible for measurement distances in the order of or smaller than the ultrasound wavelength. For the MHz-range, typical ultrasound wavelengths are in the order of 100 µm making this requirement not realistic. Fortunately, even coarse sampling at large distances yields useful results in terms of energy localisation and temporal behaviour. This was demonstrated on actual measurements on a faulty transducer. R EFERENCES [1] S. Smith, G. Trahey, and O. Von Ramm, “Two-dimensional arrays for medical ultrasound,” Ultrason Imaging, vol. 14, no. 3, pp. 213–233, 1992. [2] J. Hatfield, N. Scales, A. Armitage, P. Hicks, Q. Chen, and P. Payne, “An integrated multi-element array transducer for ultrasound imaging,” Sens Actuators A Phys, vol. 41, no. 1-3, pp. 167–173, 1994. [3] N. Chang, D. P. Billington, and D. A. Nagy, “Effect of accelerometer mass on the flexural motion of plates,” Int J Solids Struct, vol. 14, no. 10, pp. 851–860, 1978. [4] N. Yoshida, “Laser doppler velocimeter,” in Handbook of Signal Processing in Acoustics, D. Havelock, S. Kuwano, and M. Vorlnder, Eds. New York: Springer, 2008, pp. 1329–1338. [5] F. Foster, C. Pavlin, K. Harasiewicz, D. Christopher, and D. Turnbull, “Advances in ultrasound biomicroscopy,” Ultrasound Med Biol, vol. 26, no. 1, pp. 1–28, 2000. [6] J. Jensen, “Medical ultrasound imaging,” Prog Biophys Mol Biol, vol. 93, no. 1-3, pp. 153–165, 2007. [7] E. Williams, H. Dardy, and R. Fink, “Nearfield acoustical holography using an underwater, automated scanner,” J Acoust Soc Am, vol. 78, p. 789, 1985. [8] O. Sapozhnikov, A. Morozov, and D. Cathignol, “Piezoelectric transducer surface vibration characterization using acoustic holography and laser vibrometry,” 2004, pp. 161–164, 2004 IEEE IUS Symposium. [9] H. Weyl, “Ausbreitung elektromagnetischer wellen ber einem ebenen leiter,” Ann Phys, vol. 60, pp. 481–500, 1919. [10] G. Sherman, A. Devaney, and L. Mandel, “Plane-wave expansions of the optical field,” Opt Commun, vol. 6, no. 2, pp. 115–118, 1972. [11] A. Berkhout, Applied Seismic Wave Theory. Amsterdam: Elsevier, 1987.
1461
2010 IEEE International Ultrasonics Symposium Proceedings