Reducing overconfidence in forecasting with repeated judgement elicitation Matthew Brian Welsh (
[email protected]) Steve. H. Begg (
[email protected]) Australian School of Petroleum, University of Adelaide, North Terrace Adelaide, SA 5005 Australia Abstract Overconfidence is the tendency for people to underestimate the true range of uncertainty regarding unknown or future values. It results in observed outcomes falling outside people’s estimated ranges more often than their stated confidence would suggest. Previous research has, however, demonstrated various ways of reducing this bias and the More-Or-Less-Elicitation (MOLE) tool has been designed to take these into account while leading people through an elicitation. Previous research showed MOLE’s benefit on a visual estimation task but real world elicitation is more likely to involve forecasting future values. The current study compared forecast ranges, for 7 and 28 day windows, elicited via the MOLE and direct estimation. A significant reduction in overconfidence (the mismatch between stated confidence and the proportion of ranges containing the true value) was observed – from more than 25% to only 7%. We conclude that the MOLE is a useful tool for assisting forecasting. Keywords: repeated judgement; elicitation; calibration; overconfidence; MOLE.
Introduction Overconfidence (Tversky & Kahneman, 1974) refers to the tendency for elicited ranges of possible outcomes to underestimate the true uncertainty in a person’s knowledge. That is, if a person is asked to give a range that they are confident to some stated level of confidence that a future (or otherwise unknown) value will fall within, then the common observation is that the true value is less likely to fall within that range than their stated confidence indicates. This effect, while robust and demonstrated to affect both naïve and expert participants (Lichtenstein, Fischhoff, & Phillips, 1982; Morgan & Henrion, 1990), has been shown to be context dependent, with different elicitation methods known to affect the degree of overconfidence observed in a sample (see, e.g., Block & Harper, 1991 ). In light of the contextual nature of overconfidence, the MOLE (More-Or-Less-Elicitation) process was developed to improve calibration of estimated ranges. Specifically, reducing overconfidence by leading participants through an elicitation process designed to limit bias and work in concert with people’s natural cognitive tendencies. Previous experiments (Welsh, Lee, & Begg, 2008, 2009), have shown that this process increased accuracy of best guesses as well as improving calibration on a simple, perceptual task – estimating the number of circles on a display. The elicitation tasks that are of greatest application to real-world problems, however, involve the prediction of
future states of the world. For instance, oil industry economics are dependent on the accurate forecasting of future oil prices. The efficacy of the MOLE method on these sorts of tasks is, therefore, of interest.
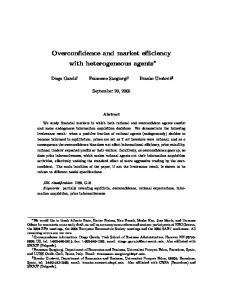
The MOLE process The MOLE was developed with four key insights in mind. The first has been known for over a century (Galton, 1907) – that repeated estimates of a parameter can, to the extent that errors in the estimates are independent, be averaged to produce a better estimate. Previous work on elicitation has also shown that repeatedly asking the same person to make the same estimate can increase accuracy to the extent that independence in the estimates is maintained (Herzog & Hertwig, 2009; Vul & Pashler, 2008). The second is that people are better at making relative than absolute judgements (Stevens, 1957). That is, allowing people to select from amongst options rather than having to generate their own leads to more accurate estimates; an observation with echoes in the overconfidence literature, specifically Winman, Hansson and Juslin’s (2004) observation that people are better at evaluating the probability of a value falling within a range than they are at generating a range to match a stated level of confidence. The third insight is that providing a starting point in an estimation process biases people’s estimates. Specifically, it seems to set the region that they are willing to explore when contemplating possible answers, such that estimates tend to cluster near any such anchoring value (Tversky & Kahneman, 1974). The same sort of priming effect seems, sometimes, to occur when people generate their own starting point (for a discussion of this, see Block & Harper, 1991). The final insight is that people, when deciding on an estimate, have some range of values that they would consider appropriate and, within which, they are indifferent. This explains the impact of anchoring values in that adjustments away from the anchor stop when this region of indifference is reached and thus estimates tend to lie at the anchor end of the region a person considers possible (Kahneman, 2011). The implication of this for range estimation is that a process building a range from the centre out will tend to produce a narrower range than one that creates a range from the outside in, as shown in Figure 1.
Aims The aim of this paper is to compare the calibration achieved
2637
by the computerized elicitation method (MOLE) described above with that of a direct estimation elicitation in which participants are asked to provide minimum and maximum values directly. Specifically, whether the advantage observed for the MOLE on visual tasks remains on a forecasting task, where participants estimate ranges they are confident will contain the true value that a parameter of interest will take at specified points in the future. (a)
Possible Low-End Values
Minimum Best Guess (b)
Possible Low-End Values
Figure 1. Pictorial representation of estimating the low-end value of an uncertainty range, working from: (a) the best guess; (b) a minimum value. Note that working from best guess rather than the minimum value results in a higher lowend estimate and thus a narrower range overall.
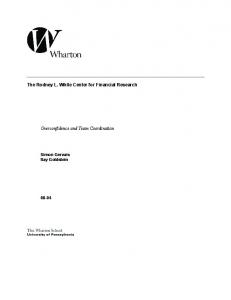
into a graphical user interface (GUI) for delivery via the MOLE but delivered as a paper and pencil test for the direct estimation. For the UK participants, both the MOLE and direct estimation methods were delivered via GUI. Figure 2 shows the GUI as it appears during elicitation using MOLE. Table 1. Commodities/parameters by quiz. Forecast Quiz 1 (Gold) Quiz 2 (Silver) Window 1 7 Gold price Silver price 2 28 Gold price Silver price 3 7 Maximum Temp Minimum Temp 4 28 Maximum Temp Minimum Temp 5 7 Rainfall total Wind Speed 6 28 Rainfall total Wind Speed 7 7 Share price Share index 8 28 Share price Share index 9 7 Oil price Gas price 10 28 Oil price Gas price NB – the specific values asked from varied across locations. E.g., the Share price asked for was for each participant’s own company and the share index was for their country of residence (Dow Jones for US; FTSE100 for UK).
Q.
Method Participants Participants were 158 oil industry personnel employed in the US (n =115) and UK (n = 43). While, for confidentiality reasons, demographic data are not included, previous work suggests a mean age of around 40 and an average of 15 years of industry experience is typical; as is a 3 or 4:1 male to female gender ratio (see, e.g., Welsh, Begg, & Bratvold, 2006; Welsh, Bratvold, & Begg, 2005). Given the involved companies’ interests in seeing overall results for their personnel, all participants willing to take part were accepted, rather than determining numbers in advance. However, analyses were not begun until all data collection was complete within a given jurisdiction.
Materials The MOLE and direct estimation methods both asked participants 10 questions regarding the values of 5 commodities/shares at times 7 and 28 days following testing. Two equivalent question sets were developed – labeled Gold and Silver after the first commodity included in each. Table 1 lists the commodities asked for in each. It is important to note that this design, with testing across an extended period and yet with all participants making forecasts across the same duration, results in individual results being dependent on the volatility of the parameters across that period. That is, participants using the same starting value on different days and making the same range estimate may end up with different calibration scores as a result of the true value on the target days differing. A period of low volatility could, thus, mask poor calibration. For the US participants, the quiz questions were coded
Figure 2. GUI showing snapshot of MOLE process
Procedure Participants were tested in small groups (2-4) within their company offices over a period of approximately 1 month – in each case. Which quiz a participant undertook under each elicitation method was determined randomly. That is, approximately half of participants completed the Gold quiz using the MOLE and Silver using the standard elicitation, while the remainder did the reverse. Which of the methods was delivered first was also randomized. The specific procedure used within each method is described below. Standard Elicitation Procedure Under the standard elicitation condition, participants were asked to give ranges they were certain would contain the true value of the parameters of interest at the specified time.
2638
That is, they were asked for their minimum and maximum values. (This was done in preference to the more common 80 or 90% confidence intervals to ensure comparability with the MOLE, which generates 100% confidence intervals.) These were either recorded on a paper copy of the quiz or entered directly into the GUI. Prior to testing, participants were asked to record the current value of the parameter of interest – to ensure that they had some idea of what the true value was and thus better reflect real forecasting tasks where people forecast values that they are familiar with. It was decided not to ask participants for a best guess as this affects the width of elicited ranges in complex ways (see, e.g., Block & Harper, 1991; Heywood-Smith, Welsh, & Begg, 2008), including a suggestion that it affects ranges differentially according to a person’s level of expertise in a subject (Bruza, Welsh, Navarro, & Begg, 2011). MOLE Procedure The MOLE required the elicitor to set initial bounds on the range of values that the computer uses – based on extrapolations of historical data or natural limits (where available). The bounds used for the different quiz questions are shown in Table 2. Note that some were based on the parameter’s current value while others were based on historical data. In both cases, however, the participant was tasked with entering the current value into the MOLE GUI immediately prior to the elicitation beginning. In this way, participants were assured of knowing something about the parameter in question. For each parameter elicitation, the program randomly selected two values from the uniform distribution delimited by these bounds and presented both to the participant, asking which was closer to the true value. The participant then rated their confidence in their choice on a scale from guessing to very high1 (as seen in Figure 1). This confidence rating was used by the MOLE to determine whether the range of values being considered should be truncated. Specifically, if the participant selected an option with maximum confidence, the MOLE ruled out any values lying closer to the non-selected option. That is, it truncated the range at the midpoint of the two current values and selected future values only from the remaining range. Any confidence level below the maximum resulted in no truncation of the range – the interpretation being that lower confidence ratings indicated a person still believed it possible that the alternate value could lie closer to the truth. Following this, the MOLE selected a new pair of values from the (possibly truncated) range and presented these for the participant to choose between – as detailed above. The MOLE iterated through his process 10 times (for 1
This scale was mapped over the top of the 50% - 100% confidence scale used in previous versions of the MOLE – as a result of discussions with the companies providing participants. While this, necessarily, reduces our ability to interpret results, it should be noted that the effect of this can only be to narrow ranges when the numerical scale might otherwise leave it intact. Thus, this change can only hinder the MOLE.
each parameter) with the range that remained at the end recorded as the participant’s final range estimate. As noted in previous versions of this task (Welsh, et al., 2008, 2009), it is possible to use MOLE results to generate a full distribution and calculate a best estimate from a participant’s responses. Given the use of a simple range elicitation as the comparison condition, however, this was not done here – avoiding concerns about the assumptions used to generate a best estimate from the raw data. Participants were not made aware of the underlying MOLE algorithm, ensuring that any attempts to ‘game the system’ would be made blind. Table 2. Initial bounds for MOLE process. US UK Q. Gold Silver Gold Silver 1 ±5% ±5% ±10% ±10% 2 ±10% ±10% ±10% ±10% 3 30-110F 30-110F -20-40C -20-40C 4 30-100F 30-110F -20-40C -20-40C 5 0-7 in. 0-60 mph 0-100mm 0-90kmph 6 0-20 in. 0-60 mph 0-200mm 0-90kmph 7 ±5% ±5% ±5% ±5% 8 ±10% ±10% ±10% ±10% 9 ±5% ±10% ±5% ±10% 10 ±10% ±20% ±10% ±20% Note: where a ±% value is indicated, the bounds were calculated from the current value of the parameter. Note 2: the UK 7-day bounds are, in places, wider than their US equivalents for reasons detailed below.
Results On Bounds The US sample was collected several months before the UK sample and, as such, observations from this were used to update our process for determining bounds. Specifically, it was observed that the bounds used for the Silver price underestimated the volatility in the market – preventing a number of participants from being able to capture the true value in their final ranges, no matter what choices they made during the MOLE. In light of this, the ranges used for the UK sample were widened on this question and analyses exclude this question from the US. Otherwise, the differences in bounds reflect differences in expected weather for the participants’ local areas and changes of units from metric to imperial where appropriate.
Equivalency of Quizzes Apart from the effect noted above for the silver question, the US sample’s performance on the questions from the Gold and Silver quizzes was statistically equivalent. Calibration on the ‘Gold’ and ‘Silver’ question sets was compared for both 7 day and 28 forecasts using Welch’s t-tests. These showed no difference between people’s performance on the two sets of questions, M = 82.8 and 84.0, t(228) = 0.42, p = 0.674 on the 7 day forecasts and M = 84.0 and 85.7, t(228)
2639
the MOLE and direct estimation was 17% on the 7 day forecast and 27% at 28 days. Paired sample t-tests comparing mean calibration at each forecast length confirmed these differences were significant, t(42) = 4.3 and 5.9, p = 1.06x10⁻⁴ and p = 5.97x10⁻⁷, A = 0.734 and 0.779. 1 Mean with 95% CI
= 0.58, p = 0.566 on the 28 day forecasts. The UK sample is slightly more complex in that, while there is no observed difference between participants’ performance on the Gold and Silver quizzes under the MOLE, there is one using the standard elicitation method, with the average calibration being 20% lower on the Gold quiz. On examination of the data, it was noted that, during the period of testing for the UK sample, the parameters on the Gold quiz happened to be markedly more variable than those on the Silver quiz. The average difference between the minimum and maximum values observed for the various parameters across the date range (i.e., D = (Max-Min)/Max) was 0.37 for the Gold quiz compared to 0.22 for the Silver. In light of the larger US sample’s results, however, it was decided that this did not call into question the equivalency of the questions, per se, and analyses are carried out on the combined data in both cases.
0.9 0.8 0.7 0.6 0.5
Calibration
7 Day MOLE
28 Day Est
Figure 3. Mean calibration by elicitation condition and forecast window (US sample) 1 Mean with 95% CI
Participants’ calibration was calculated simply as the proportion of their ranges containing the true value (given that 100% confidence intervals were elicited). Figures 3 and 4 show mean calibration by forecast window and elicitation conditions for the US and UK samples, respectively. Looking at Figure 3, initially, one sees two very clear results. The first is that the forecast length had no effect on people’s calibration – with little difference seen between the 7 and 28 day forecasts under either condition in paired samples t-tests, t(114) =0.493 and 1.81, p = .623 and .073, A (common language effect size - specifically, the measure of stochastic superiority; Vargha & Delaney, 2000) = .526 and .539, for the direct estimation and MOLE conditions respectively. That is, while participants did, in both conditions, increase the width of their ranges for the 28 day forecasts relative to the 7, the benefit in terms of calibration was zero as the additional range width was offset by the parameters’ greater volatility in the longer term. The second observation is that the MOLE method produced markedly better calibration for both 7 and 28 day forecasts – with approximately 17% more of its ranges containing the true value than is observed for the direct estimation method. Paired sample t-tests comparing participants’ calibration on the two elicitation methods (for each forecast length separately) unambiguously support this, t(114) = 6.92, p = 2.78x10⁻¹⁰ for the 7 day data and t(114) = 6.06, p = 1.77x10⁻⁸ for the 28 day forecasts. The effect sizes were large and close to identical, A = 0.734 and 0.730. Turning to Figure 4, one sees a similar pattern of results – although the 28 day result for the direct estimation method shows a decline in calibration as a result of the greater volatility in the Gold quiz questions discussed above. A paired sample t-test indicated that the difference observed here was significant, t(42) = 3.1, p = .004, A = .604. A second, paired sample t-test indicated no difference between participant’s 7 and 28 day forecast calibration using the MOLE, t(42) = 0.22, p = 0.824, A = 0.521. The difference between participants’ mean calibration on
0.9 0.8 0.7 0.6 0.5 7 day MOLE
28 day Est
Figure 4. Mean calibration by elicitation condition and forecast window (UK sample) Looking at Figure 4 and the t-test results described above, it seems clear that there is an interaction effect – with the longer period affecting calibration only for participants during the direct estimation condition. That is, greater volatility on the Gold quiz questions (discussed above) led to a decrease in calibration for participants undertaking the direct estimation conditions, but no such decrease for participants answering the same questions using the MOLE.
Discussion The results confirm that the MOLE’s advantaged over direct estimation elicitation methods in previous, perceptual studies (Welsh, et al., 2008, 2009) transfers to a forecasting
2640
paradigm with greater applicability to real world problems. While the MOLE does not eliminate overconfidence (this may, in fact, be impossible where error is involved - as discussed by Soll & Klayman, 2004), it reduces it to less than 10% in all conditions – averaging just under 7%. This is less than a third the overconfidence observed in the direct estimation conditions, which averages just over 25% across all conditions. Some other results do, however, require additional explanation; for instance, in the UK sample, additional volatility in some parameters across the experiment’s (moving) forecast window led to a marked decrease in calibration in the direct estimation task but not the MOLE. A likely cause of this is the outside-in method the MOLE uses to construct its final range. As shown in Figure 1, this is predicted to result in wider ranges – as was observed. These ranges are, however, still expected to correspond to an individual’s beliefs. By requiring participants to definitively rule values out before removing them from consideration (rather than asking whether they should be included), the MOLE preserves as much of a person’s ‘region of uncertainty’ as possible. Given the participant (presumably) believes any value within this range is possible – all of them should fall within a 100% confidence interval and the MOLE makes this far more likely. That this makes ranges wider is unsurprising but the fact that it also prevents the drop off in calibration seen with unexpectedly high volatility demonstrates the approach’s strength and seems to have strong parallels with Yaniv and Foster’s (1995) accuracy/informativeness trade-off. That is, people accept values presented by the MOLE as possible, despite the fact that they would not report such values themselves for fear of them being deemed uninformative. Another interesting observation is the equivalence of results across the forecast windows. Specifically, participants maintained the same calibration when predicting further into the future by giving wider ranges, mirroring the observation that expert and novice forecasters maintain similar levels of overconfidence despite differences in knowledge (McKenzie, Liersch, & Yaniv, 2008). This suggests that people may have a stable, preferred level of calibration.
Caveats As noted above, both the MOLE and direct estimation conditions are assumed, herein, to yield 100% confidence intervals – that is intervals the participant believes will definitely contain the true range. While this could, in the direct estimation condition, lead to ‘sandbagging’ (i.e., generating 0 to ∞ ranges to guarantee success), this is not observed in the data due to people’s tendency towards informativeness (Yaniv & Foster, 1995). (In fact, such wide ranges are not generally appropriate. For example, “temperature measured at Heathrow Airport” will not ever exceed 400°C - the autoignition point of jet fuel and, thus, the temperature at which the airport (and its thermometers) will cease to exist.)
It should also be noted that a typical calibration task asking for 80% confidence intervals can equally easily be ‘gamed’ by providing 80% extremely wide ranges and 20% extremely narrow (or just plain wrong) estimates. Any tendency that a person has towards such behavior would, presumably, benefit their calibration scores in the direct estimation task to a greater extent than in the MOLE which, as noted above, did not make clear to participants the process by which it created a range from their responses. Thus, to the extent that such effects impact the data, it would be expected to erode differences between the two conditions – which remain marked. The second concern is the requirement that the experimenter set the initial bounds for the MOLE – as demonstrated by our own failure to account for the volatility of the silver price. While this increases the potential for overconfidence in the MOLE results – by causing cases where it is impossible to create a range that contains the true value – more judicious use of historical data and natural bounds renders this a relatively minor concern. Certainly, defining an initial range is a problem shared with any elicitation method that seeks to guide participants to consider a wider range (see, e.g., Haran, Moore, & Morewedge, 2010, who ask participants to assign probabilitites across the full range of possible answers - as defined by the experimenters).
Future Research While the basic efficacy of the MOLE process for reducing overconfidence has been demonstrated, there remain a number of questions regarding its operation that require further exploration. The first is to test the impact of changing the initial bounds on the final ranges generated from the MOLE – beyond the initial requirement of getting the bounds wide enough to begin with to ensure that the participants can create a range that contains the observed value. If the MOLE is working as it should, then wider ranges shoulder result only in people cutting more of the range away to reach the same final width – with the other possibility being that the initial selection of bounds affects the final range and thus that a reevaluation of the MOLE might be required in light of such evidence of bias. Additional work is also required to determine whether the current mechanism for reducing those bounds is too conservative or, alternatively, not conservative enough. That is, whether people are accidentally removing sections of range that they do not intend to or unable to remove sections that they consider unfeasible. The current MOLE process does not have a mechanism for testing this – for example, by occasionally providing a value from outside the current range as a test that it is, in fact, considered unfeasible. Finally, while not contemplated in the current experiment, the MOLE procedure is designed to improve accuracy as well as calibration – via repeated judgements and the elimination or watering down of anchoring/priming effects. Given this, a variety of experimental tests are possible. For instance: altering the number of iterations the MOLE runs
2641
for and observing the effect this has on best estimates; and measuring the decline in the strength of any anchoring values as the MOLE progresses. This work would seem to lead, naturally, to consideration of the best algorithms for selecting values to be presented to participants. Currently, the MOLE selects values randomly from a uniform distribution covering the remaining range at any point in the experiment and runs for a set number of iterations. A more intelligent algorithm, however, could take into account past values or select the most efficient comparisons when testing a participant’s range or determining when the process should be terminated.
Conclusion The MOLE method produces ranges significantly wider than those generated by participants required to directly estimate the minimum and maximum points of a range. This results in markedly less overconfidence. Given the common observation that people, in general, are overconfident – underestimating the range of possible outcomes – the use of elicitation tools such as the MOLE, designed in line with established psychological theory, seems a useful method for improving forecasting accuracy.
Acknowledgments The authors thank the sponsors of the Centre for Improved Business Performance research program at the University of Adelaide’s Australian School of Petroleum: BG Group, ExxonMobil, Santos & Woodside.
References Block, R. A., & Harper, D. R. (1991). Overconfidence in estimation: testing the anchoring-and-adjustment hypothesis. Organizational Behavior and Human Decision Processes, 49, 188-207. Bruza, B., Welsh, M. B., Navarro, D. J., & Begg, S. H. (2011). Does anchoring cause overconfidence only in experts? Paper presented at the Annual Meeting of the Cognitive Science Society (33rd: 2011: Boston, USA) CogSci 2011. Galton, F. (1907). Vox populi. Nature, 75, 450-451. Haran, U., Moore, D. A., & Morewedge, C. K. (2010). A simple remedy for overprecision in judgment. Judgment and Decision Making, 5(7), 467-476. Herzog, S. M., & Hertwig, R. (2009). The wisdom of many in one mind: improving individual judgments with dialectical bootstrapping. Psychological Science, 20(2), 231-237. Heywood-Smith, A., Welsh, M. B., & Begg, S. H. (2008). Cognitive errors in estimation: does anchoring cause overconfidence? Paper presented at the Society of Petroleum Engineers 84th Annual Technical Conference and Exhibition, Denver, Colorado. Kahneman, D. (2011). Thinking, Fast and Slow. New York, NY: Farrar, Straus, Giroux. Lichtenstein, S., Fischhoff, B., & Phillips, L. D. (1982).
Calibration of probabilities: the state of the art to 1980. In D. Kahneman, P. Slovic & A. Tversky (Eds.), Judgment under Uncertainty: Heuristics and biases. Cambridge: Cambridge University Press. McKenzie, C. R., Liersch, M. J., & Yaniv, I. (2008). Overconfidence in interval estimates: What does expertise buy you? Organizational Behavior and Human Decision Processes, 107(2), 179-191. Morgan, M. G., & Henrion, M. (1990). Uncertainty: a guide to dealing with uncertainty in quantitative risk and policy analysis. Cambridge: Cambridge University Press. Soll, J. B., & Klayman, J. (2004). Overconfidence in Interval Estimates. Journal of Experimental Psychology: Learning, Memory and Cognition, 30(2), 299-314. Stevens, S. S. ( 1957). On the psychophysical law. Psychological Review, 64(3), 153-181. Tversky, A., & Kahneman, D. (1974). Judgment under uncertainty: Heuristics and biases. Science, 185, 11241131. Vargha, A., & Delaney, H. D. (2000). A critique and improvement of the CL common language effect size statistics of McGraw and Wong. Journal of Educational and Behavioral Statistics, 25(2), 101-132. Vul, E., & Pashler, H. (2008). Measuring the crowd within: probabilistic representations within individuals. Psychological Science, 19(7), 645-647. Welsh, M. B., Begg, S. H., & Bratvold, R. B. (2006). SPE 102188: Correcting common errors in probabilistic evaluations: efficacy of debiasing. Paper presented at the Society of Petroleum Engineers 82nd Annual Technical Conference and Exhibition., Dallas, Texas, USA. Welsh, M. B., Bratvold, R. B., & Begg, S. H. (2005). SPE 96423 - Cognitive biases in the petroleum industry: impact and remediation. Proceedings of the Society of Petroleum Engineers 81st Annual Technical Conference and Exhibition. Welsh, M. B., Lee, M. D., & Begg, S. H. (2008). More-orLess Elicitation (MOLE): Testing a heuristic elicitation method. In V. Sloutsky, B. Love & K. McRae (Eds.), 30th Annual Conference of the Cognitive Science Society. Austin, TX: Cognitive Science Society. Welsh, M. B., Lee, M. D., & Begg, S. H. (2009). Repeated judgments in elicitation tasks: efficacy of the MOLE method. In N. Taatgen, H. v. Rijn, L. Schomaker & J. Nerbonne (Eds.), Proceedings of the 31st Annual Conference of the Cognitive Science Society. Austin, TX: Cognitive Science Society. Winman, A., Hansson, P., & Juslin, P. (2004). Subjective probability intervals: how to reduce overconfidence by interval evaluation. Journal of Experimental Psychology: Learning, Memory and Cognition, 30(6), 1167-1175. Yaniv, I., & Foster, D. D. (1995). Graininess of judgment under uncertainty: an accuracy-informativeness tradeoff. Journal of Experimental Psychology: General, 124(4), 424-432.
2642