James C. Ross and Charles C. Jorgenson, Ames Research Center, Moffett Field, ... Point of Contact: James C. Ross, Ames Research Center, MS 247-2, Moffett ...
NASA Technical
Memorandum
112193
Reducing Wind Tunnel Data Requirements Using Neural Networks James C. Ross and Charles C. Jorgenson, Ames Research Center, Moffett Field, California Magnus Norgaard, Danish Technical University, Institute of Automation, Lyngby, Denmark
May 1997
National Aeronautics
and
Space Administration Ames Research Center Moffett Field, California 94035-1000
REPORT
DOCUMENTATION
Form
PAGE
Approved
dUBNo o7o4-o188
Public reporting burden for this collection Of information is estimated to average 1 hour per response, including the time for rewewing instructions, searching existing data sources. gathering and maintaining the data needed, and completing and reviewing the collection of intormation, Send comments regarding this burden estimate or any other aspect of this collection of information, including suggestions for reducing this burden, to Washington Headquarters Services. Directorate for information Operations and Reports. 1215 Jefferson Davis Highway, Suite 1204. Arlington, VA 22202-4302, and to the Office of Management and Budget, Paperwork Reduction Project (0704-0188). Washington. DC 20503.
1. AGENCY
USE ONLY
(Leave
blank)
2.
REPORT
DATE
3.
May 1997 4. TITLE
AND
Reducing
REPORT
TYPE
Technical
AND
DATES
SUBTITLE
5.
Wind Tunnel Data Requirements
COVERED
Memorandum FUNDING
NUMBERS
Using Neural Networks 519-20-22
6. AUTHOR(S)
James C. Ross, Charles
C. Jorgenson,
and Magnus
Norgaard* 8.
7. PERFORMING ORGANIZATION NAME(S)ANDADDRESS(kS) Ames Research Moffett
PERFORMING ORGANIZATION REPORT NUMBER
Center A-976463
Field, CA 94035-1000
9. SPONSORING/MONITORING
AGENCY
NAME(S)
AND
10.
ADDRESS(kS)
National Aeronautics and Space Administration Washington, DC 20546-0001
11.
SUPPLEMENTARY
SPONSORING/MONITORING AGENCY REPORT NUMBER
NASA TM-112193
NOTES
Point of Contact:
James C. Ross, Ames Research
Center, MS 247-2,
Moffett Field, CA 94035-1000
(415) 604-6722 *Danish Technical Universit_¢, Institute of Automation, 12a. DISTRIBUTION/AVAILABILITY STATEMENT Unclassified
13.
L_cn_b},, Denmark 12b.
DISTRIBUTION
CODE
-- Unlimited
Subject
Category
02, 09
ABSTRACT
(Maximum
200 words)
The use of neural networks
to minimize the amount
of data required
to completely
define the aero-
dynamic performance of a wind tunnel model is examined. The accuracy requirements for commercial wind tunnel test data are very severe and are difficult to reproduce using neural networks. For the current work, multiple input, single output networks were trained using a Levenberg-Marquardt algorithm for each of the aerodynamic coefficients. When applied to the aerodynamics of a 55% scale model of a U.S. Air Force/ NASA generic fighter configuration, this scheme provided accurate models of the lift, drag, and pitchingmoment coefficients. Using only 50% of the data acquired during the wind tunnel test, the trained neural network had a predictive accuracy equal to or better than the accuracy of the experimental measurements.
14.
SUBJECT
TERMS
Neural network,
15.
NUMBER
16.
PRICE
OF PAGES
15
Wind tunnel, Aerodynamics
CODE
A03 17.
SECURITY CLASSIFICATION OF REPORT
Unclassified NSN
7540-01-280-5500
18.
SECURITY CLASSIFICATION OF THIS PAGE
19.
SECURITY CLASSIFICATION OF ABSTRACT
20,
LIMITATION
OF ABSTRACl
Unclassified Standard
Form
PreseT=bed by ANSI 298-102
298
(Rev.
Std. z39-1e
2-89)
30 P.I. = Area
between
h
I
24
20
i iiiii!!iiiiiiii!!!!!i !
LfD
LEF
................ i...........
i
i
0.0
0.2
-2 -0.2
0 0.4
0.6
0.8
1.0
10
0
11. Definition
of maneuver
20
30
TEF
CL Figure
13
L/D performance
index.
Figure 12. Contour plot of performance mance index is maximized for LEF/7-EF
index. Perfor= 24°/13 °.
8.0 35
I
30 I_ _ [ ',
6.0
r'diling-edge llilp ....... Experiment ,¢" .,Neural network j"
"
25i_,__..._.................... _ Flap angle , L/D 4.0 1
I I_
i:
,_" :
I
_
"
I i " ,/ I _ i /_ 15 I_ ....... • .......... _......... _
,"
0
5
l0
15
0
20
5
i
:"
13. Cross plot of I_/D measurements model
the angle-of-attack
for flaps scheduled range
and neural-
to maximize
from 0 ° to 20 °.
10
15
20
c_. deg.
or, deg.
12
"
01'1
0.0
network
"
i _Experiment NePal network ....................
10 .............. ',..._ ...........................................................
2.0
Figure
................ i!
I_/D across
Figure
14. Flap schedule
model
which
maximizes
from 0 ° to 20 °.
generated L/D across
using
neural-network
angle-of-attack
range
1.4
1.4
I
I
I
i
_
.:
•...........
: ...........
: ...........
•...........
_...........
_...........
.............. i............... i............... i............... i............ ............. 1.2
1.2
l.O
0.8
..............
6 ...............
_................
g ...............
• ...............
_..............
..............
_................
_................
&............
-...............
._..............
.........
I
I
I
I
.:
"
_
:
$ ..........
_,...........
.:..........
-
/. ...........
-..........
_..........
.._
1.0
0.8
C L e L
0.6
0.2
........
nt
/
_
d
0.0 -5
[ ____.Neural
i
i
0
5
'l 10
0.4
......... .." ........
0.2
......... i
L
network
I
i
t
-
15
20
]-
i_
_
0.05
0.1
i_,i
0.0 0
] --m-.
i ', 0.15
0.2
,
Neural
0.25
,
0.3
network
i
, -
0.35
0.4
25 C D
c_, deg. (a) Lift versus
(b) Drag polar
angle of attack
1.4
7.0
1.2
6.0
.....................................................
1.0
0.8 e L
0.6
0.4
................... :.....................................................................
0.2
!.................. _................... _ __.o__Measurement i / . .[]..Neural network
•i
0.0 0
' ,
0.05
,
O. 1
O.15
2.0
....... , ............ _............ 4............. _............ _............. _.......... .
_
1.0
........ ,_............ _............ ._..
i "
o.o
0.2
0
0.2
0.4
0.6
CM (c) Pitching-moment Figure
10. Comparison
(fig. 9) does not contain
of predicted
0.8
1
1.2
1.4
CL
coefficient and measured
(d) Lift-to-drag aerodynamic
characteristics
for LEF/'I-EF
ratio = 340/30 °. Training
set
this configuration.
11
....
[
•_o_,_i FEN. I
0
lO
20
30
34
0
10
2O
3O
m
Figure
8. Error estimates
for training
_LE
set which
I0
accounts
for nonlinear
20
aerodynamic
3O
behavior
of the SHARC
model.
34
TEN, i
GLen:
0
CDerr CMen-
±
I0
2O
3O
Figure
9. Error estimates
aerodynamic
10
behavior
for training of the SHARC
set containing model.
only 50% of the flap configurations
which
still accounts
for nonlinear
1.4
1.4
| ."
1.2
.............. .."............... _............... ".-" ................ _........... 7.
I
I
I
I
I
"
i
_
"
-"
"
.;............
._...........
.:...........
.a ...... ._ ........
i
1.2
"" -
I
..........
_
_............
: ...........
i
i
i
.-
iiiiiiiiliiiiiii iiiii iiiiiiiiiiiiiiiiiiii iil i ii i
0.8
:
".."
:
:
i
"
i
!
:
.......... _........... 7"
.."
•_
0.8
..........t ........... i7
.-." ........... .t........... _........... _.......... _..........
0.6
..........
$ ...........
1.0
1.0
C L
C L
0.6
.;.....
.:...........
i. ...........
._...........
_-...........
_..........
0.4 ........................ Z *............... ":............
_._._Measurements :................ :............... _"..............F
I.....
0.2
{i
0.0 -5
i --°--_=-_,_°_l, , , /
/
_
0.00
0.05
0.0
0
5
10
15
20
25
i
_ _ .... _r_'_'w_o_ i
i
0.10
17"1_-;
0.15
0.20
a, deg (a) Lift versus
angle
0.25
Neurlnet 0.30
_
0.35
|
0.40
CD of attack
(b) Drag polar
1.4 ! 1.2
1.0
0.8 C L
0.6
.,_
10.0
,_i
i
i
i
i
...................................... i i_g,__ i i............. ............ ................................................. ,o ........... :. _ _............... _...........
................. ........................... .................
.............................................................................. i_fi i i ,_6o......... ........... ............. ........... ................ I_.............. i.................. _................... i.................
0.4
0.2
................. "_ ................. i'""l i_
0.0 o0.1
0
_.._Measurement
ii I--I] ,--Neural 0.1
0.2
_network
0.3
2.0
/ 0.0 0.4
0
0.2
0.4
0.6
CM
(c) Pitching-moment
Figure
7. Comparison
does not contain
of predicted
this configuration.
0.8
1
1.2
1.4
C L
coefficient
and measured
(d) Lift-to-drag aerodynamic
characteristics
for LEF/7"EF
ratio
= 30°/20 °. Training
set (fig. 6)
10
20
30
34
CLeft 0
CDerr
10
2O
Figure Note
6. Training
set which
that the error bars
assumes
for pitching
linear aerodynamic moment
represent
behavior only one-half
for leading-
and trailing-edge
of that error.
flap deflections.
1.0
1.0
I
i. 0.8
0.8 ........................................................
i/.
............ 0.6
0.6
CL
C L
0.4
0.4
0.2
0.2
t............. i................... ........ +N+r sumene 0.0
0.0
...........
I
I
0.05
0.10
-02
-0.2
-5
0
5
10
15
000
20
I.O
versus I
0.15
network I 0.20
I 0.25
(b) Drag polar
angle of attack I .:
i
[ --B--Neural I CD
ct, deg. (a) Lift coefficient
p
I •
i
_-"
I
I_ o.
I
I
"
0.8
0.6 4 CL 0.4
....................
_............ "t.: ............ _............ _...........
L/D 2
0.2
iiiiiiiiiiiiii ............ l..........
0
0.0
"g ......... I---_Mea_urement [ [ --g--Neural
network
_
.N.eura!-network
ouput
| |
I
-0.2
I
I
I
I
I
-2
0.00
-0.2 0.02
0.04
0.06rM0.08_,
(c) Pitching-moment
Figure
5. Comparison
shown
in figure
of predicted
4, does not include
0.10
0.12
0.0
0.4
(d) Lift-to-drag aerodynamic
0.6
0.8
1.0
CL
coefficient
and measured
0.2
0.14
characteristics
for LEF/TEF
ratio
= 15°/10 °. Training
set used,
this configuration.
7
Output
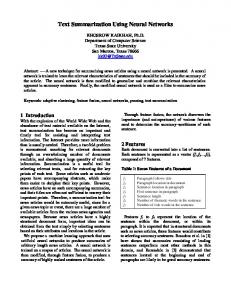
Hidden Layer
Input Layer Figure 3. Neural-network architecture used for mddeling aerodynamics.
0
10
3O
2O
34
CLer_ EDen:
0
7).OlO0
l0
±
2O
3O
Errors
for LEF/TEF
= 15°/10°:
Errors
for LEF/TEF
= 30°/11.5°:
Averaged Figure Shaded
rms errors
4. Summary boxes
as open bars in lower-left
CLerr
for all geometries
of root-mean-square
indicate
CLerr
which box.
= 0.0020,
CDerr
= 0.0002,
= 0.0016,
CDerr
= 0.0007,
in training
set: CLerr
were contained
= 0.0003.
CMerr
= 0.0013,
(rms) error from neural-network
flap configurations
CMerr
= 0.0015.
CDerr
computation
in the training
data.
= 0.0002,
CMerr
of aerodynamic Experimental
= 0.0003. coefficients.
rms errors
are shown
References 1. Schreck, S. J.; and Faller, W. E.: Encoding of Three-Dimensional Unsteady Separated Flow Field Dynamics in Neural Network Architectures. AIAA Paper 95-0103, presented at AIAA 33rd Aerospace Sciences Meeting and Exhibit, Reno, Nev., Jan. 1995. 2. McMillen,
R. L.; Steck, J. E.; and Rokhsaz,
K.:
Application of an Artificial Neural Network as a Flight Test Data Estimator. AIAA Paper 95-0561, presented at AIAA 33rd Aerospace Sciences Meeting and Exhibit, Reno, Nev., Jan. 1995. 3. Rokhsaz, K.; and Steck, J. E.: Application of Artificial Neural Networks in Nonlinear Aerodynamics and Aircraft Design. SAE Paper 932533, SAE Transactions, 1993, pp. 1790-1798. 4. Rokhsaz,
K.; and Steck, J. E.: Use of Neural
Networks in Control of High-Alpha Maneuvers. Journal of Guidance, Control, and Dynamics, vol. 16, no. 5, Sept.-Oct. 1993, pp. 934-939. 5. Totah,
J.: Simulation
Evaluation
Flight Controller.
AIAA
of a Neural Based
presented at the AIAA Flight Simulation Technology Conference, San Diego, Calif., July 1996. 6. Jorgensen, C. T.: Direct Adaptive Aircraft Control Using Dynamic Cell Structure Networks. NASA TM-112198, May 1997. 7. Hayken, S.: Neural Networks. New York, 1994.
Macmillan,
8. Alexander, M. G.: Pneumatic Forebody Vortex Control and Leading Edge Flap Hingeline Blowing Using the 55% SHARC Model. USAF Report WL-TR-96-3002, Wright Laboratory, Jan. 1996. 9. Langan, K. J.; and Samuels, J. J.: Experimental Investigation of Maneuver Performance Enhancements on an Advanced Fighter/Attack Aircraft. AIAA Paper 95-0442, presented at AIAA 33rd Aerospace Sciences Meeting and Exhibit, Reno, Nev., Jan. 1995. 10. Norgaard, M.; Jorgensen, C. G.; and Ross, J. C.: Neural-Network Prediction of New Aircraft Design Coefficients. May 1997.
NASA TM-112197,
Paper 96-3503,
Output Layer
-lidden Layer
"'"
k_.) k_J k. Input Layer
Figure 1. Simple neural network.
)
Leading-edge deflection,
flap LEF
Trailing-edge flap deflection, TEF (segments deflected together)
Figure 2. Plan view of SHARC model showing control surfaces tested.
Better selections of the configurations contained in the training set improve the accuracy of the model while still reducing the number of configurations relative to the full training set. Figure 8 shows one such selection and the resulting rms errors. This training set contains 60% of the flap configurations and predicts the aerodynamics of the configurations that are not in the training set to within the experimental error (unfilled rectangles in the lower-right box of fig. 8). Figure 9 shows the rms errors for a training set which contains only 50% of the flap configurations and still maintains predictive accuracy that is better than the experimental error. Figure 10 shows comparisons of the computed and measured aerodynamic coefficients for the 34°/30 ° flap configuration. The agreement is good in spite of the fact that the network is actually extrapolating outside of the range of the training set for both the leading- and trailing-edge flap deflections. Although risky, extrapolating slightly beyond the range of trained inputs did not lead to large errors in this particular example. The accuracy of the predictions obtained using the training sets shown in figures 8 and 9 demonstrates that neural-network techniques can be used to reduce the amount of wind tunnel data required to obtain an accurate representation model.
of the aerodynamics
index =
0
(L/D)dC L
.3
LEF/TEF
-[I00.16 (L/D)dCL
;0o/0o
A graphical representation of the performance index is shown in figure 11. Finding the flap geometry which maximizes this performance index involved significant data analysis by a test engineer. The neural-network model, on the other hand, provided a very quick analysis to determine the flap angles which maximize this parameter
The second optimization performed on the SHARC model was to develop the schedule of leading- and trailing-edge flap angles which maximized the L/D at every angle of attack. This would normally be done by cross plotting L/D data from several runs and finding which leading- and trailing-edge flap-angle combination generates the highest L/D at various angles of attack. An example is shown in figure 13. The network model was used to directly determine the flap-angle combinations that maximize L/D at any desired angle of attack. The network prediction for the optimized L/D versus angle of attack is also shown in figure 13. The schedules for the leading- and trailing-edge flap angles are shown in figure 14 for the network model and from the traditional method of cross plotting the wind tunnel data. It is noted that there is little difference between the two flap schedules.
of a given wind tunnel
Analysis of wind tunnel data after, or even during, a test is another area in which neural networks can significantly accelerate the aircraft design processes. An example of this use is in two different optimization procedures performed on the SHARC model. One of the objectives of the test was to examine the effect of vortex generators mounted onto various parts of the wing on the L/D behavior across a range of angles of attack appropriate for sustained maneuvers. A performance index was defined which, for a given combination of LEF/TEF, is given by:
Performance
picture of how flap deflections influence performance. A contour plot of the performance index as a function of leading- and trailing-edge flap deflections generated using the neural model is shown in figure 12. The neural network predicted that the performance index is maximized when LEF/TEF = 24°/13 °.
and at the same time provided
a more complete
Conclusions Wind tunnel testing of new airplane designs accounts for a significant part of the cost of the aerodynamic development process. Methods of reducing the amount of data acquired during a wind tunnel test would immediately reduce the cost of testing. The ability of neural-network models to fill in a design space for the flap deflections of a large-scale generic fighter model from sparse data was demonstrated. In the example shown, network models of the lift, drag, and pitching-moment coefficients as well as the lift-to-drag ratio produced accurate predictions when trained using only 50% of the data contained in the basic configuration test matrix. In addition, the resulting neural model of the aerodynamics provides a simple way to interrogate the entire design space allowing very flexible examination of configuration alternatives. The optimization of flap deflections using the network model to maximize the lift-to-drag ratio was demonstrated providing the same results as the traditional method of cross plotting data from numerous configurations. It is hoped that this technique will be employed during wind tunnel tests to determine when sufficient data have been acquired.
coefficients wasalsoreported byMcMillenetal.(ref.2). A sketch ofthenetwork architecture used forthepresent studyisshowninfigure3.Ingeneral, anincrease inboth thenumber ofnodes inagivenhidden layerandinthe number ofhidden layersinaneural network increases the accuracy ofmodeling nonlinear systems. Forthework presented here,15nodes inasinglehidden layerproved tobesufficient.
Results As expected,
when the aerodynamic
data for all of the
20 flap configurations were used to train the network models, the resulting accuracy was excellent for all of the configurations. Figure 4 shows a summary of the errors in the aerodynamic coefficients for all of the flap configurations. The shaded squares in the figure show which configurations were included in the training set (all 20 in this case) and the bars show the rms errors for the three aerodynamic coefficients. A bar as tall as a square corresponds to an rms error of 0.0100. The experimental data had uncertainties (standard deviation) of ACL = _+0.0035, ACD = _+0.0015, and ACM = _+0.0025. The unshaded bars in the lower-right corner of the figure show the uncertainties for all of the wind tunnel data. The network errors
Thethreeindependent variables forthisstudywerethe leadingandtrailing-edge flapdeflection angles (LEFand TEF)andtheangleofattack(c_). Theoutputs werelift, drag,andpitching-moment coefficients (CL,CD,and CM)andlift-to-drag ratio(L/D),whichrequired atotal of fournetworks. It isnotstrictlynecessary tomodel L/Dsincetheinformation issimplytheratioofCLto CD.SinceL/Dwasanimportant parameter forthewind are well within the experimental uncertainty for all of the tunneltest,it wascomputed directlytoincrease the configurations in the matrix. The network errors for the accuracy (errorsarecompounded whenL/Discomputed two configurations not included in the full training set are fromCL andCD). also quite small: for LEF/TEF = 15°/10°: Theranges oftheinputparameters examined duringthe windtunneltestwereasfollows:_ from-4°to30°in CLerr = 0.0020, CDerr = 0.0002, CMerr = 0.0003 various steps; LEFof0°, 10°, 20°,30°,and34°;andTEF for LEF/TEF = 30°/11.5°: of0°, 10% 20°,and30°.Thisgivesatotalof20flap CLerr = 0.0016, CDerr = 0.0007, CMerr = 0.0015 configurations in thebasictestmatrix.Twoother configurations weretestedthatarenotshowninthe A comparison of the measured and predicted aeromatrix:LEF/TEF = 15°/10 °andLEF/TEF = 30°/11.5 °. dynamic coefficients is shown in figures 5(a)-5(d) for These twoconfigurations werenotincluded inthe the 15°/10 ° configuration using the full training set of trainingoftheneuralnetworks butwereused toassess figure 4. The lift coefficient was very well predicted for theaccuracy ofthenetwork predictions. angles of attack less than about 10° (fig. 5(a)), and the corresponding drag and pitching-moment coefficients Inordertodetermine theamount ofdatarequired to are also accurately predicted (figs. 5(b) and 5(c), respecaccurately trainthenetworks, several different subsets tively). The L/D is accurately captured by the network (training sets) of thedataweregenerated thatincluded model for lift coefficients below that for maximum L/D, limitednumbers oftheflapconfigurations. Eachtimea beyond L/Dmax it is slightly overpredicted. flapconfiguration wastested, measurements weremade whereas The values of L/D determined directly from the neuralatseveral angles ofattack butnotnecessarily atthesame network model and from the network CL and CD values angles. Thenumber ofangles ofattack alsovariedfor eachflapconfiguration. Ingeneral, modelchanges takeas are nearly identical. muchormoretimeinthewindtunnelthantheacquisition Several other subsets of the measured aerodynamic data oftheaerodynamic data.Theneural networks werethere- were used to train the network. The training set shown in foretrainedusingdatasetswhichcontained various figure 6 is one way to reduce the data requirements and numbers offlapconfigurations butalloftheangles of would be sufficient if the aerodynamics of this airplane attackforeachconfiguration. Theaccuracy ofthenetmodel changed in a linear fashion with flap deflections. workswasevaluated bycomputing theroot-mean-squareThis training set contains 40% of the flap configurations (rms)errorofeachaerodynamic coefficient. Thedeviacontained in the full training set. As is apparent from the tionsfromthemeasured datawerecomputed ateach error bars, the network model in this case did a relatively angleofattackforagivenflapconfiguration fromwhich poor job of predicting the performance of flap configurathermserrorswerecomputed. Theerrorsshould below tions for which it had not been trained. The predicted forconfigurations included in thetrainingsets.Compari- and measured aerodynamic coefficients for the 300/20 ° sonofthenetwork outputs forconfigurations onwhich configuration (not in the training set) are shown in thenetworks werenottrainedwithexperimental results figure 7. The agreement is poor, as expected from the yieldsanindication ofthepredictive capability ofthe rms errors shown in figure 6. network model.
factors needtobestored bythecomputer along changes duringflight(e.g.,duetodamage toanairplane weighting withtheinformation concerning thearchitecture ofthe in flight)(ref.6). trained network. Thetrainednetwork modelcanbe Thecurrent studywasundertaken todirectly examine programmed (e.g.,inC)andlinkedtoanydesired howmuchwindtunneldataarerequired inordertotrain analysis oroptimization code.Suchacapability has aneuralnetwork topredicttheaerodynamic performance obvious benefits forsharing databetween various groups ofafighterconfiguration withanaccuracy comparable to andwhenrapidcomputation ofaerodynamic forcesand theexperimental accuracy. Complete descriptions ofthe moments arerequired forflight-simulation tasks. operation ofneural networks areavailable inmanyrefermodeling canalsoidentifybador ences (seeref.7).Ingeneral, thetypeofnetwork weused Neural-network unexpected data during awind tunnelorotherkindof (multilayer perceptron) consists ofanumber ofnodes test. Asmeasurements arecompared withneural-network (oftenreferred toasneurons) arranged inlayers. A sketch predictions, anomalies become readily apparent and ofasimplenetwork isshownin figure1.Theinputnodes test p arameters can bemodified t ocheck whether the passtheinputdatatothehidden layerofnodes, eachof measurements areinerror o rthenetwork n eeds additional whichapplyanonlinear transfer function totheweighted training. Themodeling capability canalsofacilitate sumoftheinputsandpassalongtheresulttotheoutput tailoring t hetest m atrix toincrease thedensity ofthetest layerwithitsownsetofweighting factors. A network can matrix where r equired. Areas o fhigh gradients maybe contain anynumber ofinput,hidden, andoutputnodes. made more apparent during atest b yuse oftheneural Theremayalsobemorethanonehidden layerofnodes. thanbyotheranalyses ofthedata. Thisformofneural network iscapable ofapproximating network anycontinuously differentiable function (ref.7). Thispaperdescribes theapplication ofaparticular neuralnetwork methodology tomodeling theaerodynamics ofa Thevalues fortheindividual weighting factors are large-scale windtunnelmodel. TheSubsonic High-Alpha determined bymeans ofatrainingprocedure inwhich Research Concept (SHARC) program wasconducted manysetsofinputswithknownoutputs arefedtothe inputlayer.Theweighting factors areadjusted iteratively jointlybytheU.S.Air ForceWrightAeronautical andNASAinthe40-by80-Foot Wind tominimize theerrorsintheoutputs (difference between Laboratory TunnelatNASAAmesResearch Center. Theprogram thecomputed andknownvalues). Manyalgorithms are ofageneric available toadjusttheweighting factors. Oncetrained, the testedboth10%and55%scalemodels advanced fighteraircraft(fig.2)(refs.8 and9).Thetest network canthencompute outputs tosetsofinputsthatit program included thedetermination oftheflapscheduling hasnotbeentrainedon.If thetrainingissuccessful, the (leading andtrailingedge)thatgavethehighest lift-tooutputs accurately predict thebehavior ofthesystem for dragratiooverthemaneuver angle-of-attack range. In anyinputs. ordertoaccomplish suchatask,alargenumber offlapTheworkdescribed in thispaperwasundertaken with deflection combinations hadtobetested. Thislargesetof thegoalofminimizing theamount ofdatarequired from aerodynamic dataprovided anexcellent opportunity to windtunneltests. Theideaisthatwhileatestisin examine thecapabilities oftheneural-network methods, progress, aneuralnetwork istrainedusingtheaeroparticularly regarding theabilitytoobtainveryhigh dynamic dataastheyareobtained. Thenetwork then levelsofmodeling accuracy withlimitedtrainingdata. predicts theresults ofthenextrunwithdifferent Theworkpresented hereisforthe55%scale model geometry ortestconditions based onthe"knowledge" results. thatit hasobtained uptothatpoint.Tobeeffective, the network mustgainsufficient knowledge about themodel sothatthepredictions matchthemeasured results to Approach withintheaccuracy ofthemeasured windtunneldata Previous publications present details of the neural method beforetheentiretestmatrixhasbeenrun.Withthis used here to model aerodynamics (see ref. 10). In sumtrained network, theaerodynamics ofthemodelcanbe mary, individual 3-input, 1-output networks were used to computed forbothtested anduntested conditions. model each of the desired aerodynamic coefficients. A Therearenumerous otherusesofaneural network trained Levenberg-Marquardt training scheme was used because tocompute aerodynamics. Forexample, trained neural it provided better accuracy than the more prevalent backnetworks wouldprovideaverysimplewaytointerrogate propagation training method. The single output networks anexperimental database. Thisabilityeliminates theneed for each of the aerodynamic coefficients provided more accurate modeling than multiple-output networks. The tointerpolate thedataacross numerous variables. The need for individual networks for modeling aerodynamic network computations canbedoneusingadesktop PC withoutusingtheaerodynamic database atall.Onlythe
Reducing
Wind
Tunnel
Data
Requirements
Using
Neural
Networks
JAMES C. ROSS, CHARLES C. JORGENSON, AND MAGNUS NORGAARD* Ames Research
Center
Introduction
Summary The use of neural
networks
to minimize
the amount
of
data required to completely define the aerodynamic performance of a wind tunnel model is examined. The accuracy requirements for commercial wind tunnel test data are very severe and are difficult to reproduce using neural networks. For the current work, multiple input, single output networks were trained using a LevenbergMarquardt algorithm for each of the aerodynamic coefficients. When applied to the aerodynamics of a 55% scale model of a U.S. Air Force/NASA generic fighter configuration, this scheme provided accurate models of the lift, drag, and pitching-moment coefficients. Using only 50% of the data acquired during the wind tunnel test, the trained neural network had a predictive accuracy equal to or better than the accuracy of the experimental measurements.
Nomenclature C
wing reference
chord length
CD
drag coefficient,
CL
section
CM
pitching-moment
D
drag force
L
lift force
L/D
lift-to-drag
LEF
leading-edge
M
pitching
moment
q
dynamic
pressure,
S
wing reference
TEF
Trailing-edge
V
velocity
D/(qS)
lift coefficient,
L/(qS)
coefficient,
angle
(pV2)/2
area flap deflection
angle
Subscripts err
root-mean-square
max
maximum
large number of conditions and geometries. Test parameters typically include such things as control-surface and/or high-lift system deflections, variation in the angles of attack and sideslip, and velocity (Mach number) variations. The result is a long and expensive test program with a large amount of data to sort through and interpret. Subsequent analysis of the data is time consuming, typically consisting of a large number of cross plots to develop an understanding of how all of the geometric variations change the aerodynamic forces and moments as a function of angles of attack and sideslip. The resulting aerodynamic database is used to analyze the airplane'g performance throughout its operating envelope as well as in-flight simulations to assess handling qualities before the airplane is built. Because of the large expense associated with wind tunnel testing and the subsequent analysis of the aerodynamic data, technologies which reduce these costs (without sacrificing accuracy) can significantly increase the proftability of a new airplane.
M/(qSc)
ratio, CL/C D flap deflection
Wind tunnel testing is an integral part of the design of all airplanes (as well as most automobiles and trucks). Since the aerodynamic performance of an airplane is nonlinear due to the effects of viscosity, there is a need to test a
(rms) error
*Danish Technical University. Institute of Automation, Lyngby, Denmark.
Simply stated, the problem that we addressed is how to reduce the amount of wind tunnel data required to completely define the aerodynamic performance of a given model to the desired accuracy. The ability of neural networks to accurately learn highly nonlinear, multiple input/output relationships makes this a promising technique for modeling of aerodynamic test data. This sort of curve (or surface) fitting offers the most likely path to minimizing data requirements. There has been considerable interest recently in aeronautical applications of neural networks. In an early study, Schreck and Failer (ref. I) successfully trained a neural network to predict the unsteady pressure variations on a pitching wing. This work demonstrated the network's capability to learn the behavior of a highly nonlinear aerodynamic system. Other applications have since been reported for characterizing flight-test data (refs. 2 and 3). Neural networks have also been applied flight controls for defining control laws (refs. 4 and 5) and for updating control laws when aircraft performance
to