Reference values for chromium, nickel and vanadium in urine of youngsters from the urban area of Rome Alessandro Alimonti,*a Francesco Petrucci,a Michael Krachler,b Beatrice Boccaa and Sergio Carolia a
Istituto Superiore di SanitaÁ, Viale Regina Elena 299, 00161 Rome, Italy. E-mail:
[email protected]; Fax: z39 06 4990 2366; Tel: z39 06 4990 2080 b Karl-Franzens UniversitaÈt Graz, Institut fuÈr Analytische Chemie, UniversitaÈtsplatz 1, A8010 Graz, Austria
Received 28th February 2000, Accepted 21st June 2000 Published on the Web 11th July 2000 In the assessment of human health risk, the obtainment of reference values in biological tissues and/or ¯uids is crucial to estimate the type and magnitude of occupational and environmental exposure. In this context, urine is the major excretion route for many noxious substances that have entered the organism and can be viewed as one of the most useful materials for biomonitoring campaigns. In this study, reference concentration ranges for Cr, Ni and V in urine were achieved in a sub-population of 131 youngsters, aged 6±10, attending primary schools in the urban area of Rome. Subjects under drug therapy or affected by any pathological diseases were not included in this investigation. Strict precautions against contamination or loss of the analytes of interest were adopted for all steps. Determinations were performed by means of high resolution inductively coupled plasma mass spectrometry. In general, the natural log-transformed concentration data for the three elements investigated conformed to a satisfactorily normal distribution. The estimated reference ranges were as follows (mg g21 creatinine): Cr, 0.07±0.76; Ni, 0.20±1.23; V, 0.02±0.22. The sex of the youngsters was tentatively treated as a statistical explanatory variable using the Fischer F-test on variance.
Introduction Human biomonitoring continues to receive considerable attention as the effort to reduce the uncertainty in health risk assessment increases. The primary goal of biomonitoring studies is to evaluate human exposure by comparing the measured concentrations of elements with those of control groups or with literature-based ``background'' values. Thus, in the assessment of health risk, the knowledge of reference values (RVs) in human tissues and ¯uids provides a meaningful insight into the extent of the exposure and is of fundamental importance in environmental pollution control. In fact, the concentration of potentially toxic elements in the organism generally re¯ects the levels of total exposure; no increase in these values provides evidence of no variation in the background exposure, whilst the occurrence of enhanced values is a warning to the scienti®c community as well as to the decisionmakers. Urine is one of the most useful materials in biomonitoring campaigns because it is easily collected and stored with no serious risk of contamination. This biological ¯uid is also an appropriate marker of exposure in the case of Cr, Ni and V. Urinary excretion of these metals, in fact, varies as a function of the degree of exposure and it is frequently used to monitor exposed and unexposed subjects.1±4 Although the role of Cr, Ni and V as essential elements in humans is no longer debated, the interest in these metals is mainly dictated by their noxious potential as industrial and environmental pollutants.2,5±11 Chromium exposure can be primarily ascribed to anthropogenic activities. In urban areas the use of concrete and the combustion of oil, coal and gasoline represent the major potential sources of environmental pollution for this metal.12 Typical Cr concentrations in the atmosphere of urban areas are found to be less than 0.1 mg m23. However, the adverse effects DOI: 10.1039/b001616k
of chronic exposure to Cr cannot be neglected even at very low concentrations.13 Individual Ni exposure, in turn, seems to be also associated with the level of urbanization.2 This may be traced back to Ni content in automobile exhausts and in bitumen, the main component of asphalt. Nickel occurs also in road dust; Nicontaining particles may thus easily ®nd their way into the respiratory tract.14 Environmental contamination by V is mainly due to the burning of oil and coal in power and heat-producing plants. Vanadium concentrations in the atmosphere varies considerably also as a function of seasonal parameters, e.g., use of heating systems. Typical levels for this element in the urban atmosphere range from 0.25 to 300 ng m23 with annual mean values up to 100 ng m23 for large towns.15 In general, in remote rural sites the levels of these metals are far below the typical concentrations found in urban and industrial environments. On the other hand, an essential prerequisite of the RVs approach is the homogeneity of the population selected by geographic (e.g., industrial, urban, rural), demographic (age, sex) and lifestyle criteria (e.g., diet, smoking). In other words, the RVs obtained from a wellde®ned population subgroup may not be useful for another subgroup even when all the sampling parameters are homogeneous.16 From this viewpoint, epidemiological studies on children have some advantages in that the characteristics of their residential exposure can be obtained more easily since they are less mobile than adults. In addition to this, schoolchildren are less affected by other potential sources of exposure, such as smoking and contact with Cr±Ni plated objects, not to speak of the fact that confounding effects due to previous chronic professional exposures can obviously be ruled out. In the present work the urinary concentrations of Cr, Ni and V were determined in children aged 6±10 years as a subpopulation of the urban area of Rome, i.e., an example of an environment with a high degree of urbanization. J. Environ. Monit., 2000, 2, 351±354
This journal is # The Royal Society of Chemistry 2000
351
Table 1 Analytical quality control and detection power of the HR-ICP-MS determination of Cr, Ni and V in urine samples after UV digestion and dilution 1 : 20 NIST SRM 2670 /mg l21 Isotope
Certi®ed
Obtaineda
Spike/mg l21
Recovery (%)
Precisionb (%)
LODc/mg l21
Cra Nia 51 a V
(13)d (70)d Ð
9.77¡0.27 61.3¡3.4 6.31¡0.13
20 20 20
101¡4 97¡4 102¡3
2.8 5.5 2.1
0.13 0.34 0.03
52
58
a
Mean¡s. bCalculated on 10 repeated measurements of the NIST SRM 2670 without spikes. c3s criterion. dIndicative values.
Experimental
Analytical determinations
Population characteristics
Calibration curves were set up with matrix-matched calibration standards by adding to the samples adequate amounts of Cr, Ni and V stock solutions (SPEX, Edison, NJ, USA) to reach ®nal concentrations of 0.1, 0.2, 0.5 and 1.0 mg l21. To compensate for instrumental drifts and matrix effects, Y (SPEX) was used as internal standard, at a concentration of 1.0 mg l21. Analyses were carried out by high resolution inductively coupled plasma mass spectrometry (HR-ICP-MS). The apparatus used was the ELEMENT spectrometer (Finnigan MAT, Bremen, Germany) equipped with an ultrasonic nebulization device (U-5000ATz, CETAC Technologies Inc., NB, USA). The spectrometer was used in the medium resolution mode (m/ Dm~3000) to separate the analyte signals from severe polyatomic interferences, such as those of 35Cl16O on 51V, 40 Ar12C on 52Cr and 44Ca16O on 60Ni. These are caused by high concentrations of bulk elements (C, Ca and Cl). The entire analytical procedure as well as the performance of the method in terms of precision, sensitivity, accuracy and limits of detection (LODs), calculated on the basis of the 3s value of the background signal, had already been tested.18 For the determination of the creatinine content, urine samples were centrifuged at 3500 rpm for 10 min and then diluted 1z34 with physiological solution prior to analysis. This was done by an enzymatic test using the commercial kit MPR3 Creatinine PAP 883 263 (Boehringer Mannheim Corp., Indianapolis, IN, USA) followed by colorimetric measurements using the centrifugal analyzer COBAS FARA (Roche, Basel, Switzerland).
The reference sub-population considered includes 131 youngsters attending primary schools in the urban area of Rome. Sampling was approved by the internal health care service of each school and informed consent was obtained from parents. The subjects were enrolled on the basis of a questionnaire speci®cally developed for this project in order to obtain information on age, sex, dietary habits and health conditions. The eligibility criteria adopted rejected children under drug therapy or affected by speci®c diseases in¯uencing the metabolism of the trace metals of interest, such as juvenile diabetes and contact dermatitis.17 Experimental data were normalized to the creatinine content to take account of the variability of urine concentration during the day. Moreover, to minimize both over- and underestimation in calculating the normalized concentrations, only urine samples were included with creatinine values falling in the range 0.7±1.0 g l21. Sample collection and pretreatment As reported in a previous paper, strict precautions were taken throughout the analytical procedure to minimize sample contamination.18 In short, spot morning urine samples were collected in 100 ml polyethylene tubes (Kartell1, Milan, Italy), which had been decontaminated beforehand, and stored at 228 ³C until analysis. Decomposition of the organic matrix was performed by UV photolysis using an in-house UVdigestor equipped with a 500 W Hg lamp (Helios Italquarz, Milan, Italy). To aliquots of 5 ml of urine were added 2.0 ml H2O2 (Suprapur1, Merck, Darmstadt, Germany) and 1.0 ml of sub-boiling HNO3 (Suprapur1, Merck) before irradiating with a UV lamp. The solutions obtained were diluted with highpurity water to achieve a ®nal dilution of 1z19. All sample manipulations were performed in a Class-100 clean room.
Statistical analysis Basic statistical ®gures, i.e., mean, standard deviation (s), 5% trimmed mean, geometric mean (GM), median, mode and percentiles were calculated. The distribution of the data was tested by using Kolmorogov±Smirnov statistics (the K-S test)
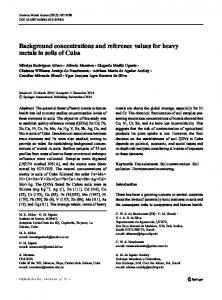
Fig. 1 Q±Q plots of the natural log-transformed data normalized by creatinine content: A, Cr; B, Ni; C, V.
352
J. Environ. Monit., 2000, 2, 351±354
Table 2 Distribution parameters of the trace element concentrations in urine (normalized by creatinine content) K-S test Element
Critical valueb
Dmaxa
Value
Symmetry skew/SE skewc
Kurtosis kurtosis/SE kurtosisd
Cr
Actual 0.162 0.166 8.54 12.87 Log-transformed 0.068 0.166 2.46 22.60 Ni Actual 0.142 0.155 6.73 5.22 Log-transformed 0.055 0.155 20.64 21.33 V Actual 0.163 0.149 8.80 8.91 Log-transformed 0.069 0.149 21.38 20.88 a The most extreme absolute difference of observed values from the normal curve. bFrom the tables, at P¢0.01. cSkew divided by standard error of the skew. Critical values: 0, symmetry; w2.6, right skew; v22.6, left skew; dKurtosis divided by standard error of the kurtosis. Critical values: 0, regular Gaussian form; w2.6, too-peaked distribution; v22.6, too-¯at-topped distribution.
and by evaluating the amount of skew and kurtosis. Gender was also tentatively treated as an explanatory variable by applying the Fischer F-test on the variances. The statistical package SPSS Basic (SPSS Inc., Chicago, IL, USA) was used for the calculation.
Results and discussion Analytical quality control Table 1 reports the performance of the analytical procedure in terms of recovery and precision. The recovered concentrations of the elements of interest fall within the 97±102% range of the expected values. The relative standard deviation (RSD) of the measurements for all the three analytes was always better than 6%. These ®ndings can be considered to be satisfactory for the aim of the present investigation. Assessment of the reference values Table 2 summarizes the statistical data obtained for assessing the distribution of Cr, Ni and V concentrations in urine as normalized by the creatinine content. In general, the element level pattern was rather unsatisfactorily described by a normal distribution in terms of the K-S test (Dmax greater than or close to the critical value) as well as in terms of symmetry and kurtosis (ratio between skew or kurtosis and the relevant standard error much higher than the critical value). Only natural log-transformed variables provided good approximations to the normal distribution (see Fig. 1), although for Cr the skew toward higher values and the deviation of the kurtosis were close to the corresponding critical values. In consideration of this, all statistical analyses were performed after logarithmic transformation of the original values. Table 3, in turn, reports the descriptive statistics of the data, including the 5% trimmed mean, i.e., the arithmetic mean of the data in the 5±95% fractiles. The similarity between means (normal and 5% trimmed) and median for each analyte further corroborate the evidence of a good central tendency. Concentrations falling below the LODs afforded by the technique pose a problem in that they are actually unknown values that nevertheless must be accounted for because it would Table 3 Descriptive statistics for Cr, Ni and V (mg g21 creatinine) in urine Element a
Undetectability (%) Meanb sb 5% trimmed meanb GMc Medianb a
Cr
Ni
V
22.9 0.324 0.333 0.300 0.177 0.240
11.4 0.558 0.480 0.531 0.386 0.434
3.0 0.104 0.090 0.098 0.072 0.084
Percentage of values below the LOD. bCalculated excluding undetectable values. cCalculated assigning one-half of the relevant LOD instead of excluding undetectable values.
be arbitrary and misleading simply to discard them. An acceptable compromise under such conditions is to assign values, conventionally equal to 0.56LOD, to those unknown concentrations in the calculation of the GM, so as to be able also to compare the present data with those obtained by Apostoli et al.19 Discrepancies between means or medians and GM can be explained by the relative number of undetectable concentrations (®rst row of data in Table 3). As expected, in fact, the GM values were found to be lower than the corresponding means and medians, especially for Cr and Ni, for which higher percentages of undetectability were found. Table 4 summarizes the results obtained for the elements under study in terms of experimental, fractile, reference and uncertainty ranges. The reference ranges reported here were calculated on the basis of the 5% trimmed mean¡2s in order to minimize the in¯uence of the skew in both directions.16 Due the fact that the mean22s value turned out to be always lower than the low-end of the experimental range, this last value was included in the reference range. As a general behaviour, these reference ranges were roughly equivalent to those obtainable with the 5±95% percentiles (fourth column vs. third column of Table 4), this providing further evidence of an adequate normal distribution of the log-transformed data. Table 4 also reports, in the ®fth column, the upper range of uncertainty, de®ned as the interval between the highest reference value and the highest experimental value. At the moment, the results included in this uncertainty range can be considered as alert ®gures requiring that the relevant subjects be followed with special attention. On the other hand, no lower ranges of uncertainty, i.e., the interval from the low reference limit to the lowest experimental result, were reported because these two values practically coincided. Due the lack of data dealing with analogous young populations, the present ®ndings were compared to the data of adults (sixth column of Table 4). In this study Cr and Ni showed reference intervals narrower than those reported by Minoia et al.21 In particular, the upper end of the Cr reference range was found to substantially coincide with that suggested by Kristiansen et al.20, although it exceeded the value proposed by Apostoli et al.,19 i.e. 0.76 mg l21 vs. 0.65 and 0.24 mg l21, respectively. However, it is worth mentioning that the data published by Apostoli et al.19 were estimated by giving to all the undetectable samples theoretical values equal to 0.56LOD, i.e., 0.025 mg l21. Although this approach allows more complete information on the lowest ®ndings to be obtained, it results in ranges lower than those achieved excluding all samples below the LOD, as in the present study. In the case of Ni, the upper end of the reference range recently observed by Kristiansen et al.20 for a Danish population is surprisingly higher than the upper end of the interval proposed in this study as well as than that estimated by Minoia et al.,21 i.e., 3.17 mg l21 vs. 1.23 and 1.74 mg l21, respectively. Until further experimental information is available on the factors of nonoccupational exposure, e.g., food intake, this discrepancy is hard to explain only on the basis of the characteristics of the populations studied. As concerns V, the reference range J. Environ. Monit., 2000, 2, 351±354
353
Table 4 Concentration ranges (calculated excluding undetectable values) of trace elements in urine (concentrations in mg g21 creatinine) Element
Experimental range
5±95% range
Reference range
Upper range of uncertainty
Literature data on adults
Cr
0.07±2.06
0.12±1.07
0.07±0.76a
0.76±2.06
Ni
0.20±2.58
0.22±1.55
0.20±1.23a
1.23±2.58
V
0.02±0.49
0.03±0.29
0.02±0.22a
0.22±0.49
0.04±1.50b nr±0.65c nd±0.24d 0.06±1.74b nr±3.17c 0.20±1.00b
a
The low-end value is the lowest value of the experimental range. bData in mg l21, from ref. 21. cData in mg l21 (transformed from nmol l21), from ref. 20; nr, not reported. dData in mg l21, from ref. 19; nd, not detectable.
published in 1990 for the Italian population21 is much higher than the corresponding range observed in this study and exceeds also the upper uncertainty range estimated here, i.e., 0.20±1.00 mg l21 vs. 0.02±0.22 and 0.22±0.49 mg l21. This large difference can probably be ascribed to the characteristics of the subjects (youngsters vs. adults) as well as to the downward trend characterizing today the ``normal'' intervals of the general population. Over the last decades, in fact, the content of many elements dropped more and more to values which re¯ect better control of pre-analytical and analytical factors, more adequate criteria for selection of the population groups and, hopefully, decreased levels of general exposure. The evaluation of the effects of the sex variable on the urinary content of Cr, Ni and V was also attempted. In urine, no marked sex-related differences (at Pv0.05) between male and female youngsters were found for Cr and Ni. This fact con®rms previous results available for adult populations.20 Only for V did the Fisher F-test reveal slightly signi®cant differences on the variances (at Pv0.01) with mean¡s values equal to 0.11¡0.013 for males and 0.10¡0.009 mg l21 for females.
Conclusions
3 4 5 6 7 8 9 10 11 12 13 14
Due the fact that the population under study consisted of a suf®cient number of selected children, these results can be assumed to represent reference ranges for the entire juvenile population. Moreover, these ®ndings corroborate the trend in recent years toward a continued reduction in the reference values for trace elements such as Ni and V. On the other hand, for Cr recent literature data are fully con®rmed. Finally, a possible in¯uence of the gender on urinary V levels is also suggested.
15
References
20
1 M. A. Armienta-HernaÁndez and R. Rodriguez-Castillo, Environ. Health Perspect., 1995(supp. 1), 47. 2 T. Smith-Sivertsen, V. Tchachtchine, E. Lund, V. Bykov,
354
J. Environ. Monit., 2000, 2, 351±354
16 17 18 19
21
Y. Thomassen and T. Norseth, Environ. Health Perspect., 1998, 106(8), 503. E. J. Bernacki, G. E. Parsons, B. R. Roy, M. Mikac-Devic, C. D. Kennedy and F. W. Sunderman, Jr., Ann. Clin. Lab. Sci., 1978, 8, 184. E. Sabbioni and M. Maroni, A study on vanadium in workers from oil ®red power plants, EUR 9005, Commission of the European Communities, Luxembourg, 1983, vol. IV, pp. 1±38. A. G. H. Love, in Chromium, metabolism and toxicity, ed. D. Burrows, CRC Press, Boca Raton, FL, 1983, pp. 1±22. M. Anke, L. Angelow, M. Glei, M. Muller and H. Illing, Fresenius' J. Anal. Chem., 1995, 352, 92. B. S. Jandhyala and G. J. Hom, Life Sci., 1983, 33, 1325. J. A. Fagliano and J. E. Savrin, Chromium Medical Surveillance Project, Final Technical Report, Department of Health, Trenton, NJ, 1994. S. Attila, in Metals Ions in Biology and Medicine, ed. Ph. Collery and M. Poirier, John Libbey Eurotext, Paris, 1990, pp. 315±319. F. W. Sunderman, Jr., Scand. J. Work Environ. Health, 1993, 19(19), 34. M. Kiviluoto, L. Pyy and A. Pakarinen, Scand. J. Work Environ. Health, 1979, 5, 362. International Agency for Research on Cancer, Monograph on the evaluation of carcinogenic risks to humans: Chromium, nickel and welding, IARC, Lyon, 1989, vol. 49. V. Bianchi and A. G. Levis, Sci. Total Environ., 1988, 71, 351. T. Smith-Sivertsen, E. Lund, Y. Thomassen and T. Norseth, Arch. Environ. Health, 1997, 52(6), 464. World Health Organization, Vanadium: Environmental Health Criteria, WHO, Geneva, 1988, vol. 81. International Federation of Clinical Chemists (IFCC), Clin. Chim. Acta, 1987, 170, 33. A. Alimonti, F. Petrucci, B. Santucci, A. Cristaudo and S. Caroli, Anal. Chim. Acta, 1995, 306, 35. M. Krachler, A. Alimonti, F. Petrucci, F. Forastiere and S. Caroli, J. Anal. At. Spectrom., 1998, 13, 701. P. Apostoli, G. Maranelli, P. G. Duca, P. Bavazzana, A. Bartoli, A. Cruciatti, G. Elia, C. Minoia, R. Piccinim, E. Sabbioni, G. Sciarra and C. Soave, Int. Arch. Occup. Environ Health, 1997, 70, 173. J. Kristiansen, J. M. Christensen and B. S. Iversen, Sci. Total Environ., 1997, 204, 147. C. Minoia, E. Sabbioni, P. Apostoli, R. Pietra, L. Pozzoli, M. Gallorini, G. Nicolau, L. Alessio and E. Capodaglio, Sci. Total Environ., 1990, 95, 89.