The Journal of Neuroscience, May 1, 2013 • 33(18):7681–7690 • 7681
Systems/Circuits
Refractoriness Enhances Temporal Coding by Auditory Nerve Fibers Michael Avissar,1 John H. Wittig Jr,1,2 James C. Saunders,3 and Thomas D. Parsons1,3 1Department of Clinical Studies, New Bolton Center, School of Veterinary Medicine, 2Department of Bioengineering, School of Engineering and Applied Science, and 3Department of Otorhinolaryngology: Head and Neck Surgery, School of Medicine, University of Pennsylvania, Philadelphia, Pennsylvania 19104
A universal property of spiking neurons is refractoriness, a transient decrease in discharge probability immediately following an action potential (spike). The refractory period lasts only one to a few milliseconds, but has the potential to affect temporal coding of acoustic stimuli by auditory neurons, which are capable of submillisecond spike-time precision. Here this possibility was investigated systematically by recording spike times from chicken auditory nerve fibers in vivo while stimulating with repeated pure tones at characteristic frequency. Refractory periods were tightly distributed, with a mean of 1.58 ms. A statistical model was developed to recapitulate each fiber’s responses and then used to predict the effect of removing the refractory period on a cell-by-cell basis for two largely independent facets of temporal coding: faithful entrainment of interspike intervals to the stimulus frequency and precise synchronization of spike times to the stimulus phase. The ratio of the refractory period to the stimulus period predicted the impact of refractoriness on entrainment and synchronization. For ratios less than ⬃0.9, refractoriness enhanced entrainment and this enhancement was often accompanied by an increase in spike-time precision. At higher ratios, little or no change in entrainment or synchronization was observed. Given the tight distribution of refractory periods, the ability of refractoriness to improve temporal coding is restricted to neurons responding to low-frequency stimuli. Enhanced encoding of low frequencies likely affects sound localization and pitch perception in the auditory system, as well as perception in nonauditory sensory modalities, because all spiking neurons exhibit refractoriness.
Introduction Temporal coding of information is important in the auditory system, where neurons produce precisely timed spikes that synchronize and entrain to acoustic waves between 20 and 2000 Hz (Kiang, 1965; Rose et al., 1967; Joris et al., 1994; Ko¨ppl, 1997; Furman et al., 2006; Avissar et al., 2007). Both synchronization and entrainment by the auditory nerve are critical to sound encoding and are involved in the discrimination of pitch (Cariani, 1999), intensity (Colburn et al., 2003), and location (Carr and Konishi, 1988). Synchronization requires that spikes align precisely to a particular phase of the stimulus cycle (Kiang, 1965; Rose et al., 1967), whereas entrainment requires that a single spike occurs each and every cycle of the stimulus (Rhode and Smith, 1986; Joris et al., 1994). Therefore, these two measures of spike-time precision occur at different temporal scales, with synchrony quantifying within-cycle precision and entrainment quantifying between-cycle precision. Synchronization and entrainment are largely independent dimensions of temporal codReceived July 16, 2012; revised Feb. 17, 2013; accepted March 19, 2013. Author contributions: M.A., J.H.W., J.C.S., and T.D.P. designed research; M.A. performed research; M.A. and J.H.W. analyzed data; M.A., J.H.W., J.C.S., and T.D.P. wrote the paper. This work was supported by awards from the National Institute on Deafness and Other Communication Disorders, National Institutes of Health (Grant #DC000710 to J.C.S. and Grant #DC003783 to T.D.P.), and the Pennsylvania Lions Hear Res Foundation (to J.C.S. and T.D.P.). Correspondence should be addressed to Thomas D. Parsons, VMD, PhD, University of Pennsylvania, School of Veterinary Medicine, 382 West Street Road, Kennett Square, PA 19348. E-mail:
[email protected]. DOI:10.1523/JNEUROSCI.3405-12.2013 Copyright © 2013 the authors 0270-6474/13/337681-10$15.00/0
ing. For example, a neuron that spikes at a precise phase every other cycle is perfectly synchronized but shows compromised entrainment, whereas a neuron that fires exactly one spike each cycle at random phases shows no synchronization but robust entrainment. A reduction of either synchronization or entrainment reflects less precise interspike intervals and therefore could reduce information transfer to downstream neurons. A universal property of spiking neurons is refractoriness, a transient decrease in discharge probability following a spike (Hodgkin and Huxley, 1952; Gray, 1967) that prevents back propagation of action potentials. The refractory period lasts about 1 ms (Gray, 1967). Both the duration of acoustic stimulus cycles and the interval between auditory nerve spikes can occur on time scales in the range of the refractory period, such that the refractory period could prohibit spikes during consecutive cycles or cause spikes to shift phase alignment between consecutive cycles. Therefore, refractoriness has the potential to affect two aspects of temporal coding in auditory neurons: entrainment and synchronization. Previous work has shown that refractoriness enhances coding in the visual system by reducing trial-to-trial noise in neural responses (Berry and Meister, 1998; Kara et al., 2000; Uzzell and Chichilnisky, 2004). The intent of the present study was to characterize the effect of refractoriness in the peripheral auditory system, where the stimulus period can be less than or greater than the refractory period. We demonstrate that the relationship between the refractory period and stimulus period determines the effect of refractoriness on entrainment and synchronization. Re-
7682 • J. Neurosci., May 1, 2013 • 33(18):7681–7690
fractoriness enhances entrainment when the refractory period is less than the stimulus period. Given the relatively short duration of the refractory period, the ability of refractoriness to improve temporal coding is restricted to neurons responding to lowfrequency stimuli. This is a significant finding because a general mechanism for enhancing spike-time precision in auditory neurons has been identified and characterized, and the analysis undertaken here provides a framework for evaluating the relationship of stimulus frequency to refractory period in other sensory systems.
Materials and Methods Data collection. Details of the experiment and exclusion criteria for cells have been described previously (Avissar et al., 2007). Briefly, 3- to 24-dold White Leghorn chickens (Gallus domesticus) of either sex were surgically prepared for access to the cochlear nerve through the scala tympani. The University of Pennsylvania Institutional Animal Care and Use Committee approved the protocol for the treatment and maintenance of animals. Animals were tested in a double-walled, acoustically shielded chamber. A borosilicate glass microelectrode (15–30 M⍀) filled with 3 M KCl was secured to a microdriver and advanced in 1 m steps. Electrical signals were amplified and fed to an oscilloscope, audio monitor, and level detector. A broadband noise stimulus was used to detect isolated cochlear nerve fibers. Using 40 ms tone bursts, a tuning curve was constructed for each fiber by recording the evoked discharge rate at different intensity–frequency combinations between 0 and 100 dB SPL and 0.1 and 6.0 kHz. From the tuning curve, the characteristic frequency (CF) and rate-level threshold at CF were determined visually. Cochlear nerve fibers were then stimulated with repeated, phase-locked, 40 ms tone bursts, 2.5 ms rise and fall times, ⫹20 dB above the rate-level threshold at CF. A 400 ms silent interval between tone bursts allowed recovery of the cell from neural adaptation (Spassova et al., 2004). The presentation of each tone burst was defined as one trial. At least 200 trials were presented to each cell and the occurrence times of spikes on each trial were stored on a hard disk with 10 s resolution. Cells were excluded if there were insufficient data, the health of the preparation was in question, or if the data did not pass a statistical stationarity test (Avissar et al., 2007). A total of 85 cells were included in the study. Selection of analysis window. The rise and fall times of stimulus intensity were each 2.5 ms to minimize spectral distortion, so this collective transition time of 5.0 ms of the 40 ms tone burst was excluded and resulted in a 35 ms window of analysis. Conduction time down the sound tube, based on its length, was 0.269 ms, and the analysis window was additionally adjusted to account for this delay. However, the “group delay” that encompasses latencies due to middle-ear conduction, cochlear mechanics, the hair cell transduction mechanism, synaptic transmission, and neural conduction (Ko¨ppl, 1997) was not explicitly accounted for because its measurement was beyond the scope of this study. Estimating the absolute refractory period. The absolute refractory period is often estimated in vivo using a stimulus that drives the neuron continuously and robustly (Li and Young, 1993). However, lowfrequency auditory nerve fibers are never subject to a continuous driving force because the filtering properties of the cochlea ensure that low-CF nerve fibers are excited by a phasic, periodic stimulus, even if stimulated with broadband noise. Therefore, the refractory period in low-CF fibers might be overestimated. In contrast, high-frequency auditory nerve fibers are subject to a driving force that is nearly continuous (Palmer and Russell, 1986), so the refractory period in high-CF fibers can be estimated accurately using established techniques (Li and Young, 1993). Spontaneous activity could, in theory, be used to provide a constant drive to low-CF fibers, but this would not represent a robust stimulus and therefore could also lead to overestimation of the refractory period. Because we were interested in the refractory period across the tonotopic axis of the cochlea, we developed a method to estimate the refractory period for both low and high CF fibers using pure tone stimuli. We initially assumed that the shortest interspike interval over a long stimulus presentation provided an estimate of the absolute refractory period ().
Avissar et al. • Refractoriness Enhances Temporal Coding
However, we found that this method is sensitive to false triggers during data collection, causing spuriously short interspike intervals. To avoid this, we selected the shortest interspike interval that was part of a set of adjacent bins in the interspike interval histogram (bin width ⫽ 10 s) that contained at least 0.2% of the total number of intervals. This selection criterion appeared to eliminate all spuriously short interspike intervals, which constituted ⬍1% of the recorded interspike intervals for most cells (76 of 85 cells) and at most 1.92% of the recorded intervals in one cell. Stochastic model of nerve responses. A statistical model was developed for each fiber’s responses, and then the statistical model was used to predict the effect of removing the refractory period on a cell-by-cell basis. Spikes were generated using a time-varying Poisson process modified by a dead time that represented the fiber’s absolute refractory period. In a Poisson model with dead time, the probability of a spike occurrence ( P) depends not only on the time (t), but also on the time elapsed since the last spike (). The function P(t,) was divided into two independent functions: (1) an excitation function s(t) (in events/second), that represented the firing rate of the neuron free of the effects of refractoriness and was driven by a Poisson process that depended on external factors, and (2) a recovery function r(), that represented refractoriness and was an intrinsic property of the neuron (Gaumond et al., 1983). The free firing rate revealed the underlying Poisson process responsible for driving the neuron and its synchronization to the stimulus waveform, whereas the recovery function corresponded to the absolute refractory period observed in the neuron. The recovery function weighted the excitation function according to the recovery state of the neuron such that:
P 共 t, 兲 ⫽ s 共 t 兲 r 共 兲 ⌬t,
(1)
where r() is equal to, or between, 0 and 1. For a dead time model with an absolute refractory period (), but not relative refractory period, r() is a delayed step function:
r共兲 ⫽
再0,1, ⱕ⬎ .
(2)
When using a recovery function of the form in Equation 2, we calculated the excitation function, s(t), directly from the instantaneous firing rate, R(t), or peristimulus-time histogram (Jones et al., 1985; Bi, 1989). For recovery functions of more general forms (i.e., those that included a relative refractory period), we used a more intuitive and equivalent method based on exact spike times (Johnson and Swami, 1983; Berry and Meister, 1998). At each time t, the average recovery state of the neuron was evaluated from the observed responses. This was done by evaluating r() at every t for each trial and then averaging across trials. The resulting average, W(t), represented the estimated probability that the neuron was free of the effects of refractoriness at a given time. The excitation function was then calculated as:
s共t兲 ⫽
R共t兲 . W共t兲
(3)
When W(t) equalled 0, which occurred when the estimated was longer than the shortest observed interval, s(t) was set to 1000 events/s ⫻ R(t) to avoid undefined values (Berry and Meister, 1998). A Poisson process with a dead time was fit separately to each fiber’s data using Equations 1 and 2 with 10 s time steps and 200 trials. The Poisson model determined for each fiber yielded a simulated response with approximately the same peristimulus-time histogram as the observed response. Each fiber had a unique excitation function that represented its average time-varying firing rate without refractoriness. Each fiber had a unique excitation function that represented its average timevarying firing rate without refractoriness. Each fiber’s response was simulated without refractoriness by using just the excitation function: P(t) ⫽ s(t)⌬t. The excitation function was derived once and then used to generate spike times and/or event times stochastically for each of the 200 simulated trials. Real neurons undergo a relative refractory period after the absolute refractory period. During the relative refractory period, the spike prob-
Avissar et al. • Refractoriness Enhances Temporal Coding
J. Neurosci., May 1, 2013 • 33(18):7681–7690 • 7683
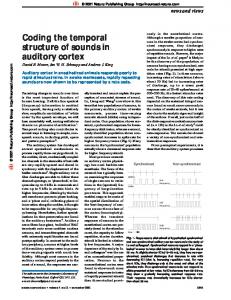
We calculated an EI based on the spike times of each nerve fiber (EIS) and compared it with the same metric calculated for the simulated excitatory events after removing refractoriness (EIE). To estimate the error in measuring EIS and to determine if a difference between EIS and EIE was significant, a bootstrap procedure was used. The probability distribution of interspike intervals for each neuron was used to generate a simulated distribution with the same number of intervals. The EI of this simulated distribution was calculated. The process was repeated 1000 times and the SD of simulated EIS values represented the error in measuring EIS. This process was also repeated for the interspike interval distribution of the neuron’s response without refractoriness to determine the error of measuring EIE. Furthermore, during each iteration of the bootstrap procedure, the simulated EIS was compared with the simulated EIE. The resultant bootstrap distriFigure 1. Auditory nerve responses entrain and synchronize to the acoustic stimulus waveform. The raster plots display the bution of EI differences was used to determine occurrence times of spikes in two auditory nerve fibers. The CF of each fiber is displayed on top along with in green. The length the probability that the two values were indisof the green line segment at the top of each panel corresponds to the duration of on the same time scale as the figures. The top tinguishable, and p ⬍ 0.05 was considered to subpanels display the responses of the fibers over all 200 trials and the bottom subpanels magnify the figures to display only five represent a significant difference in EI. trials. The sinusoidal blue lines depict the shape of the pure tone stimulus waveform at CF. We also quantified entrainment using the original version of the measure (Joris et al., 1994) for comparison. As mentioned above, ability is reduced, but does not reach zero. Measuring the complete r() this measure falls to zero as stimulus frequency exceeds maximum spike requires driving the neuron with a constant stimulus. However, by narate. Cells may still entrain to the stimulus at high frequencies by consisture, acoustic stimuli are not constant, because even constant pure tones tently spiking once every 2 cycles (1:2 entrainment), once every 3 cycles are waves that fluctuate in amplitude. Rather than attempt to measure (1:3), or once every 4 cycles (1:4). These forms of entrainment would r(), a Poisson process was simulated for each cell with a recovery funcresult in interspike intervals that are multiples of the stimulus period tion of the form: (Marshall and Lang, 2004). We calculated the EI for 1:N entrainment (for N ⫽ 2, 3, and 4) as the proportion of interspike intervals in the range of 1 ⫺ e ⫺ 冑 共 ⫺ 兲 / r, ⬎ N stimulus periods ⫾ half of a stimulus period. r共兲 ⫽ (4) 0, ⱕ , Quantifying synchronization. Spike times were converted into phase values corresponding to the phase of the sinusoidal stimulus at which where r is a time constant that determines how fast the relative refracthey occurred. To determine the precision of timing, a vector strength tory period recovers and is the measured absolute refractory period (VS) analysis was used (Goldberg and Brown, 1969). Briefly, each spike (Jones et al., 1985). The underlying excitation function s(t) was deterwas represented as a unit vector pointing in the direction of its occurmined using Equation 3. For each cell, r was varied by applying values of rence phase. The mean vector was calculated. Its direction represented 0.5, 1, and 2 ms. We evaluated whether the relative refractory period the mean phase angle of the neuron’s response and its magnitude improved the precision of the model by comparing variability (i.e., enrepresented VS, which ranges between 0 and 1, where 0 represents no tropy) in spike counts and patterns (Strong et al., 1998) of the observed synchronization to the periodic stimulus and 1 represents perfect synand modeled responses. chronization. VS values were converted to a temporal dispersion metric Quantifying entrainment. The ability of an auditory nerve fiber to dis(), a standard method for estimating the jitter in spike timing that charge exactly one spike per cycle is defined as entrainment (Joris et al., corresponds to the neuron’s ability to synchronize (Paolini et al., 2001). 1994; Kalluri and Delgutte, 2003). Here we calculated an entrainment In addition to calculating the temporal dispersion of all spikes, we also index (EI) from the proportion of cycles eliciting exactly one spike. Our calculated the dispersion of the first spike of a cycle (1) and the subsemethod is slightly different from the two versions of EI described previquent spikes of a cycle (2) separately for neurons that fired multiple ously. Joris et al. (1994) reported the proportion of interspike intervals spikes per cycle. These “multiple spikers” were defined as neurons for within 0.5 to 1.5 stimulus periods, whereas Kalluri and Delgutte (2003) which ⱖ2% of the stimulus cycles that evoked at least one spike also reported the number of interspike intervals smaller than 1.5 stimulus evoked a second spike. To delineate the cycles, the response was divided periods divided by the number of stimulus cycles. Our measure reseminto a set of consecutive response windows that were each one stimulus bles the original metric by Joris et al. (1994), which ranges from one for a cycle long. The response windows were centered on the mean phase angle neuron that spikes once-and-only-once each stimulus cycle, to zero for a of each fiber’s responses (Goldberg and Brown, 1969). Only cycle-long neuron that always skips consecutive cycles or spikes several times response windows that fell fully within the 35 ms analysis window were throughout each cycle. A limitation of the original metric is that the index included. Partial response windows at the beginning or end of the analfalls to zero as stimulus frequency increases above a cell’s maximum spike ysis window were not considered. For each response window, the first rate, and therefore it provides little or no sensitivity for high-CF cells. spike to occur was always used in the calculation of 1 regardless of Our variation of EI overcomes this limitation by quantifying the prowhether it occurred early or late in the cycle. portion of cycles with exactly one spike rather than the proportion of Temporal dispersion values were compared between two conditions intervals corresponding to exactly one cycle. Our variation of EI also for each neuron, a value computed from observed spikes (S) and a value allows for greater independence of synchrony and entrainment. For computed from the simulated excitatory events after removing refractoexample, if a poorly synchronized neuron spiked very late one cycle riness (E). To estimate the error in measuring S and to determine if a and very early the following cycle, our measure of entrainment would difference between S and E was significant, a bootstrap procedure was remain high because one spike occurred each cycle, whereas the origused. The probability distribution of spike phases for each neuron was inal metric would drop if the interspike interval was less than half the used to generate a simulated distribution with the same number of stimulus period.
再
7684 • J. Neurosci., May 1, 2013 • 33(18):7681–7690
Avissar et al. • Refractoriness Enhances Temporal Coding
Figure 3. The ratio of the refractory period to the stimulus period determines whether neurons fire multiple spikes per cycle. a, The percentage of stimulus cycles in which a fiber fired more than one spike is plotted against CF for each fiber. The horizontal dashed line indicates 2%, the criterion for multiple spikers. b, The percentage in a is plotted against /T.
phase lock) to the stimulus waveform by producing spikes that occur at a specific phase. The spikes on the left have a temporal dispersion of 206 s and those on the right have a value of 816 s. Figure 2. Refractoriness outlasts the excitatory phase of the stimulus cycle for most nerve fibers. a, Histogram displaying the distribution of across all cells. b, plotted as a function of CF for each fiber. Each point is a measurement from one fiber. The curved dashed line depicts the duration of the excitatory phase of the stimulus cycle at each CF (i.e., half a cycle). c, Histogram displaying the distribution of /T across all cells. spikes. The temporal dispersion of this simulated distribution was calculated. The process was repeated 1000 times and the SD of simulated S values represented the error in measuring S. This process was also repeated for the phase distribution of the neuron’s response without refractoriness to determine the error of measuring E. In addition, during each iteration of the bootstrap procedure, the simulated S was compared with the simulated E. The resultant bootstrap distribution of differences was used to determine the probability that the two values were indistinguishable, and p ⬍ 0.05 was considered to represent a significant change in temporal dispersion.
Results Auditory nerve responses entrain and synchronize to the acoustic stimulus waveform Action potential (spike) times were recorded in single fibers of the auditory nerve during repeated presentations of a pure tone (Fig. 1). The test stimuli were 20 dB more intense than the level that caused a detectable increase in spike rate at the fiber’s CF, the frequency at which the fiber was most sensitive. Fibers typically responded with only one, or less than one, spike per cycle (Fig. 1, left), although low-CF fibers sometimes responded with multiple spikes per cycle (Fig. 1, right). A fiber’s discharge pattern was considered perfectly entrained if a spike occurred once on each and every stimulus cycle. The neurons depicted in Figure 1 are 90.1% (left) and 59.3% (right) entrained. In addition to exhibiting entrainment, the two examples in Figure 1 also synchronize (i.e.,
The refractory period can be less than or greater than the stimulus period Each fiber’s absolute refractory period was approximated as the shortest observed interspike interval. In Figure 1, the duration of is depicted for each cell as a green line ( ⫽ 2.01 and 1.31 ms) and in each case was shorter than the stimulus period (⌻ ⫽ 3 and 8 ms). Is the relationship between and ⌻ a general property of the auditory system? This was explored by first estimating for our sample of 85 individual fibers with characteristic frequencies ranging from 123 to 3247 Hz. The average for all of the fibers in the sample was 1.58 ms. The distribution of is shown in Figure 2a. Ninety-three percent of fibers had a refractory period between 0.5 and 2.5 ms and more than half ranged between 1 and 2 ms. Previous estimates of the absolute refractory period of avian auditory nerve fibers in vivo range from ⬃500 microseconds to 2.2 ms in starling, pigeon, and barn owl (Manley et al., 1985; Gummer, 1991; Neubauer et al., 2009). Most of our estimates also fell within that range, although we did estimate refractory periods in excess of 2.5 ms in 4 of 85 fibers. This may reflect overestimation from erroneously eliminating short intervals thought to be spurious (see Materials and Methods); however, excluding these cells had no effect on our subsequent analysis and conclusions. The value was next sorted according to each cell’s stimulus frequency (Fig. 2b). The dashed line in Figure 2b represents the duration of half a cycle of stimulation at each CF, and thereby represents the excitatory phase of the acoustic stimulus based on the biophysics of hair cell signal transduction (Palmer and Russell, 1986). The average was 1.73 ⫾ 0.58 ms (mean ⫾ SD) for CF ⬍ 500 Hz and 1.41 ⫾ 0.42 ms for CF ⬎ 500 Hz (unpaired two-tailed t test, p ⬍ 0.001), suggesting that the refractory period
Avissar et al. • Refractoriness Enhances Temporal Coding
J. Neurosci., May 1, 2013 • 33(18):7681–7690 • 7685
cycle. Cells were classified as either “single spikers” or “multiple spikers” based on the proportion of stimulus cycles that elicited multiple spikes (see Materials and Methods). All multiple spikers had CFs ⬍300 Hz (Fig. 3a). However, not all fibers with CFs ⬍300 Hz were multiple spikers. Therefore, CF alone was not sufficient to predict whether a cell would be a multiple spiker. It was hypothesized that the ratio /⌻ would be a better predictor of this response feature based on the biophysics of signal transduction in the cochlea. All neurons with /T ⬎0.5 were single spikers, whereas, with the exception of one cell, all neurons with /T ⬍0.5 were multiple spikers (Fig. 3b). We conclude that in auditory nerve fibers, a refractory period that spans two-thirds or more of the excitatory half cycle is sufficient to prevent multiple spikes per cycle when the stimulus intensity is ⫹20 dB above threshold (/T ⬃0.3, vertical dashed line). Removing refractoriness To quantify the effect of refractoriness on entrainment and synchronization in vivo, we parameterized a statistical model to each individual fiber that accurately predicted that fiber’s spiking response, and then eliminated the refractory period from the model to study the effects of refractoriness (Gaumond et al., 1982, 1983). Each auditory nerve fiber’s response was modeled as an inhomogeneous (time-varying) Poisson proFigure 4. Examples of removing refractoriness. a, Raster plots of simulated responses (spikes) using a Poisson-with-dead-time cess modified by a dead time (the estimate model derived from the observed responses in Figure 1. b, Raster plots of simulated responses (excitatory events) using the same of ). This required finding the unique model as in a but without refractoriness. Excitatory events can occur in rapid succession, as reflected by the occurrence of tight Poisson process, which when modified by clusters of events with no apparent space between them. The aligned late-cycle responses in the left panel are due to noise in the the estimate of the absolute refractory pecalculated excitation function for this fiber. The fiber’s observed responses contained a few late discharges (Fig. 1a) that occurred riod, reproduced the observed probability in time bins when the neuron was usually refractory. This caused an overestimate of the excitation function for those time bins, of spike occurrence at each time point which in turn caused alignment of stochastic events at those time bins. Such overestimates were rare across the population of (Gaumond et al., 1983; Berry and Meister, fibers. 1998). Each cell’s time-varying Poisson process was used to produce stochastic is longer at low CF. It is possible that at low CFs is sometimes spike times for a single trial, and this procedure was repeated 200 overestimated due to interactions with the stimulus (see Materitimes to generate simulated data for all trials. Figure 4a illustrates als and Methods), and this could account for the difference obthe simulated firing patterns during repeated pure tone stimuli served between low- and high-CF fibers. and demonstrates how the model mimics the behavior of audiThe ratio of to the stimulus period ( T) for each cell (Fig. 2c) tory nerve responses qualitatively (compare with Fig. 1). The was calculated. This ratio (/T ) ranged from 0.15 to 3.86 and was similarity between the modeled and recorded responses of these ⬎1.0 for most cells. For all cells with a CF ⬍500 Hz (n ⫽ 35), /T two examples was typical of all cells. The addition of a relative was ⬍1.0; for all cells with CF ⬎1000 Hz (n ⫽ 30), /T was ⬎1; refractory period improved the accuracy of each fiber’s model and for cells with CF between 500 and 1000 Hz, /⌻ was ⬍1.0 responses only marginally (see Materials and Methods), and 55% the time (11 of 20; Fig. 2c). The ratio of the refractory period therefore we opted for parsimony and present subsequent results to the stimulus period (/T ) was examined in subsequent analbased on a model of absolute, but not relative, refractory period. yses to determine whether the ratio is critical to our understandRemoving the refractory period from the model exposed the ing of how refractoriness influences neural coding. underlying Poisson process. This so-called excitation function yields discrete, suprathreshold excitatory events that become Ratio of the refractory period to the stimulus period spikes only if the nerve is not refractory, and therefore represent determines whether neurons fire multiple spikes per cycle the synaptic drive onto the fiber (Jones et al., 1985). Figure 4b Auditory nerve fibers were grouped into two response phenoshows the simulated excitatory events for the representative fitypes, those that did or did not discharge multiple spikes per bers in Figure 1. By removing refractoriness, the number of
7686 • J. Neurosci., May 1, 2013 • 33(18):7681–7690
Figure 5. Entrainment is enhanced when the refractory period is less than the stimulus period. a, EIS plotted against CF for each cell. b, Difference in EI between observed responses and the model without refractoriness is plotted versus CF. Positive values reflect an enhancement of entrainment by refractoriness. c, Same difference as in b is plotted against /T.
events per cycle increased such that most stimulus cycles triggered more than one event. Our measure of entrainment is maximal when each and every cycle is coded with a single spike. Therefore, removing the refractory period resulted in a reduction of entrainment compared with both the observed data (Fig. 1) and the model with refractoriness (Fig. 4a). The excitatory events were distributed over a wider range of phases on any given stimulus cycle and, thus, represented a reduction in synchronization. These observations indicated that refractoriness improved temporal coding in these example fibers, because with removal of the refractory period, both synchronization and entrainment were degraded. Entrainment is enhanced when the refractory period is less than the stimulus period An entrainment index derived from measured spikes (EIS) was computed across the sample of nerve fibers (Fig. 5a). We quantify EIS as the proportion of cycles with exactly 1 spike, which ranges from 0 for no entrainment to 1 for perfect entrainment. Our metric is related to the original definition of EI in the literature (Joris et al., 1994), but was modified to provide a more sensitive measure of entrainment for high-CF cells (see Materials and Methods). EIS ranged from 0.08 to 0.989 and identified two populations of cells. At CFs ⬍480 Hz, the value of EIS was between 0.8 and 1, whereas for CFs ⬎480 Hz, EIs declined smoothly from 0.9 to 0.1. The effect of refractoriness on entrainment was then measured by comparing EIS with EIE, the value computed from ex-
Avissar et al. • Refractoriness Enhances Temporal Coding
citatory events after removing refractoriness. The difference between the two (EIS ⫺ EIE) quantifies the effect of refractoriness on entrainment (Fig. 5b,c). At CFs ⬍440 Hz, entrainment was enhanced by as much as 0.9; from 440 to 700 Hz, the enhancement rapidly declined; and at CFs ⬎700 Hz, enhancement was eliminated. At low CFs, the refractory period enhanced entrainment by eliminating multiple events in a cycle, so that the nerve fiber usually fired exactly one spike per cycle. At higher CFs, the refractory period had little effect on a cell’s ability to entrain to the stimulus with exactly one spike per cycle. We also evaluated entrainment using the original definition of the metric in the literature (Joris et al., 1994), where EI is quantified as the proportion of interspike intervals equal to one stimulus period (data not shown). For frequencies ⬍500 Hz, the original metric and our metric yielded nearly identical results, and this held true for both observed responses and excitatory events. However, for CFs ⬎700 Hz, the original metric was at or near 0 for the observed responses and between 0.1 and 0.4 for the excitatory events, leading to a moderate degradation of entrainment due to refractoriness. At high frequencies, the original metric was at or near 0 because the stimulus frequencies exceeded the maximum spike rate of the cells. When a neuron cannot fire one spike each cycle (1 spike to 1 cycle entrainment, or 1:1 entrainment), it is possible that it can consistently fire once every other cycle (1:2), or every third cycle (1:3), thereby generating spike intervals that are multiples of the stimulus period (Marshall and Lang, 2004). We computed entrainment to multiples of the stimulus period by quantifying the proportion of interspike intervals equal to a multiple of the stimulus period (see Materials and Methods; data not shown). In general, entrainment to multiples of the stimulus period was not as robust as 1:1 entrainment. The maximum EI was 0.6 at CF ⫽ 775 Hz for 1:2 entrainment, 0.35 at 1167 Hz for 1:3 entrainment, and 0.24 at 1641 Hz for 1:4 entrainment. After removing refractoriness, the maximal enhancement in EI was found to be 0.48 at CF ⫽ 676 Hz for 1:2 entrainment, 0.27 at 1167 Hz for 1:3 entrainment, and 0.17 at 1641 Hz for 1:4 entrainment. At higher CFs, refractoriness degraded fractional entrainment (as it did for 1:1 entrainment using the original metric), and the frequency at which this degradation occurred was higher for larger multiples of the stimulus period. In summary, refractoriness enhances entrainment to multiples of the stimulus period, although this effect is less robust than 1:1 entrainment. The enhancement occurs at higher frequencies and the frequency depends on how many stimulus cycles are skipped during entrainment. Characteristic frequency largely predicted the effects of refractory period on entrainment; however, the ratio of the refractory period to the stimulus period was also examined to determine whether it provided any additional insight. This was accomplished by plotting the difference between EIS and EIE as a function of this ratio (/T; Fig. 5c). The enhancement of entrainment was observed for ratios up to ⬃0.9 with an apparent peak at /T of 0.7. We hypothesize that enhancement increased as /T increased from 0.2 to 0.7 because the refractory period progressively reduced the possibility of a second spike. Entrainment decreased for /T ⬎0.7 because refractoriness resulted in an increased likelihood of complete cycle skipping. These observations indicate that entrainment was enhanced in lower CF fibers for which the ratio of the refractory period to the stimulus period was less than ⬃0.9.
Avissar et al. • Refractoriness Enhances Temporal Coding
J. Neurosci., May 1, 2013 • 33(18):7681–7690 • 7687
Figure 6. The impact of refractoriness on synchronization of single and multiple spikers. Example period histograms for two neurons are shown. a, Smoothed period histogram depicting the probability of event occurrence at each phase of the stimulus cycle for the fiber in Figure 1, left. The blue dashed line depicts the stimulus waveform. The length of the green double-arrowed line corresponds to the duration of in the phase domain. The black histogram shows the phase distribution of spikes in measured responses and the red histogram shows the phase distribution of excitatory events from simulated responses of the model without refractoriness. The inset displays the same histograms normalized so that the area under them is equal. The of spike and excitatory event timing is shown below the inset. The period histogram was smoothed by a running average spanning 10% of the stimulus cycle length for clearer presentation. b, Same as a but for the fiber in Figure 1, right.
Synchronization is enhanced when the refractory period is less than the stimulus period The temporal dispersion of spikes (S) and excitatory events (E) quantifies the temporal jitter of responses with respect to stimulus phase. Figure 6 illustrates the average response each stimulus cycle, the period histogram, for the same example fibers depicted in Figure 1. Temporal dispersion is a standard method for quantifying synchronization of a response to a periodic stimulus (Goldberg and Brown, 1969; Paolini et al., 2001). The precision of timing in the representative cells is submillisecond even in response to low-frequency tones, as evidenced by S values of 206 and 816 s. The lower CF cell (Fig. 6b) locks to two phases, possibly a consequence of having a refractory period short enough to permit multiple spikes per cycle. Multiple spikers sometimes fire at two precise phases; therefore, in addition to measuring the dispersion of all spikes, the temporal dispersion of the first and second spike was also measured separately (Fig. 6b). The effect of refractoriness on temporal dispersion was evaluated by comparing S with E. The distribution of excitatory events over one cycle is plotted in red for the representative cells in Figure 6. The peaks of the period histogram were broader for the excitation functions than for the observed spikes. This was true even when the histograms were normalized so that the area under each curve was 1 (Fig. 6a,b, insets). The value of E is higher than S for the higher CF cell, which suggested an improvement in timing of 47 s due to refractoriness. In contrast, the value of E was lower than S in the lower CF, multiple-spiker cell. This would suggest that refractoriness degraded timing. However, when we measured the temporal dispersion of first (first) and second (second) spikes separately, we found that each had less jitter than the unimodal distribution of excitatory events. This represented an improvement in timing of 100 –200 s. Therefore, the biphasic shape of the multiple spiker’s phase histogram served to increase the standard metric of temporal dispersion, but did not represent actual degradation of spike-time precision. This discrepancy may reflect the fact that temporal dispersion is an inappropriate measure of spike-time precision for cells with biphasic period histograms, because the calculation
for temporal dispersion assumes that temporal jitter is distributed normally (Paolini et al., 2001). Therefore, in subsequent analyses (where noted), the timing of the first spike from multiple spikers was used to calculate temporal dispersion. Temporal dispersion is summarized across the population of fibers in Figure 7a. The value of S progressively decreased from ⬃1000 to ⬃100 s as a function of CF. The open circles represent the temporal dispersion of all spikes (red) or the first spike per cycle (black) of multiple spikers. The solid line indicates a theoretical upper bound to temporal dispersion at each CF, the value expected for a fiber that did not synchronize. At lower CFs, the observed temporal dispersion was much lower than the upper bound, indicating that the spikes were restricted to a narrow range of phases. At higher CFs, the observed temporal dispersion converged with the upper bound, indicating that the neurons failed to phase
lock to the stimulus. To examine the effect of refractoriness on temporal dispersion, the difference between the temporal dispersion of observed spikes and excitatory events, S and E, was calculated. A positive value meant that refractoriness reduced dispersion and therefore enhanced timing. Figure 7b summarizes the results for all cells. Cells were divided into multiple spikers (open circles) and single spikers (filled circles). Refractoriness degraded timing of multiple spikers when the temporal dispersion of all observed spikes was compared with all simulated excitatory events (open red circles). However, refractoriness enhanced timing of the first spike per cycle for the same cells (open black circles), as was observed for the example cell in Figure 6b. Gray filled circles represent single spikers for which dispersion changed significantly due to refractoriness, as determined by a bootstrap procedure (95% confidence level, see Materials and Methods). Refractoriness enhanced spike-time precision by up to 250 s for nerve fibers with CFs ⬍500 Hz. Little or no enhancement was observed for fibers with CF ⬎800 Hz. Characteristic frequency appeared to predict whether refractoriness affected temporal dispersion; however, the ratio of the refractory period to the stimulus period also was examined to determine whether it provided any additional insight (Fig. 7c). An improvement in spike timing only occurred at ratios ⬍0.9 for single spikers and for the first spike per cycle of multiple spikers. The greatest enhancements tended to occur at the lowest ratios, although some low-ratio fibers failed to show enhancement. Both CF and /T appear equally capable of predicting whether refractoriness enhances precision, with CF ⫽ 500 Hz and /T ⫽ 0.9 being the boundaries below which enhancement is possible. These results demonstrate that refractoriness can increase synchronization of spike discharge to the stimulus waveform and argue for an important role of the refractory period in this facet of temporal coding. Enhancements of entrainment and synchronization are correlated Both entrainment and synchronization represent independent dimensions of temporal coding in the auditory nerve. Refracto-
7688 • J. Neurosci., May 1, 2013 • 33(18):7681–7690
Avissar et al. • Refractoriness Enhances Temporal Coding
Figure 8. Enhancements of entrainment and synchronization by refractoriness are correlated. The change in synchronization due to refractoriness is plotted against the respective change in entrainment. Enhancement in synchronization only occurred when there was a large enhancement in entrainment. Open circles represent the first spike per cycle for multiple spikers.
Figure 7. Synchronization is enhanced when the refractory period is less than the stimulus period. a, Temporal dispersion of observed spikes is plotted versus CF. Each point is a measurement from one fiber. The curved gold line is the precision of spike times that would be predicted for a completely unsynchronized response (flat period histogram) at each CF, according to the equation 1/(CF * 冑12). Open circles depict the temporal dispersion of all spikes in each cycle (red) or just the first spike in each cycle (black) for cells that fire multiple spikes per cycle. b, Difference in temporal dispersion between the observed spikes and the simulated excitatory events with refractoriness removed. Positive values correspond to an enhancement in precision by refractoriness. Solid black circles correspond to single-spiking cells for which the change in S was not significant as determined by a bootstrap procedure (see Materials and Methods). The gray circles are single spikers that showed a significant enhancement in precision. c, Change in precision plotted as a function of /T.
riness tended to enhance both, particularly when the refractory period was less than the stimulus period. The change in temporal dispersion as a function of change in entrainment index was plotted for each fiber to better understand if the two enhancements were related (Fig. 8). An improvement in synchronization only occurred when entrainment was enhanced by 0.5 or more. Therefore, refractoriness improved entrainment independently of synchronization. The refractory period improved temporal coding of low-CF fibers by enhancing entrainment and in some instances by also enhancing spike-time precision.
Discussion Role of refractoriness in achieving high levels of entrainment Chicken auditory nerve fibers exhibited exemplary entrainment (Fig. 5), with some cells reaching near perfection (EIS ⬃1.0). This
is different from mammalian auditory nerve fibers, in which maximal entrainment reaches only 0.8 (Joris et al., 1994). Conceptual insight regarding how refractoriness contributed to the high degree of entrainment reported here may be gleaned from the cochlear nucleus of mammals. Within this nucleus, globular bushy cells exhibit enhanced entrainment and synchronization because of two mechanisms that depend on the convergence of multiple synaptic inputs (see review by Joris and Smith, 2008). Convergence allows coincidence detection to sharpen timing while also enabling a “first come, first served” mechanism to enhance both entrainment and timing (Rothman et al., 1993; Xu-Friedman and Regehr, 2005a,b). Refractoriness promises to improve entrainment via a similar first-come, first-served mechanism if multiple suprathreshold EPSPs converge on the auditory nerve afferent fiber, and the refractory period only allows the first one to trigger a spike. The first-come, first-served mechanism yields increasing precision and reliability as the number of converging excitatory events increases (Wittig and Parsons, 2008). This mechanism could explain the superior entrainment by auditory nerve fibers from birds compared to those from mammals, because mammalian auditory nerve fibers receive input from only one synaptic ribbon (Liberman, 1980), whereas chicken fibers receive input from multiple synaptic ribbons (Martinez-Dunst et al., 1997). Therefore, chicken fibers benefit from a larger pool of readily releasable synaptic vesicles, which should yield a more precise and reliable first-come, first-served response when combined with a refractory period that limits responses to late excitatory events. Role of refractoriness in achieving precise spike timing The auditory system’s capacity for spike-time precision depends on several biophysical specializations. Specializations at the presynaptic side of the hair cell–afferent fiber synapse include a dense body to maintain a readily releasable pool (Smith and Sjo¨strand, 1961; Wittig and Parsons, 2008), rapidly activating and deactivating voltage-gated calcium channels (Lewis and Hudspeth, 1983; Beutner and Moser, 2001; Spassova et al., 2001), fast mobile calcium buffers (Roberts, 1993; Edmonds et al., 2000; Heller et al., 2002), and potent calcium pumps to extrude calcium from the cytoplasm (Dumont et al., 2001). Although such spe-
Avissar et al. • Refractoriness Enhances Temporal Coding
cializations play an important role in allowing precisely timed neurotransmitter release by the hair cell, less attention has been directed toward how timing is preserved during the conversion of neurotransmitter release to a train of spikes. The results of the present study demonstrate that refractoriness can enhance spiketime precision during this conversion, particularly for low-CF single spikers and for the first spike per cycle of multiple spikers. Refractoriness enhanced synchronization of the first spike per cycle by eliminating late excitatory events, which tightened the distribution of observed spike phases (Fig. 6). Refractoriness appeared to degrade spike timing of multiple spikers when we included all spikes per cycle, although this may reflect the fact that temporal dispersion is not an appropriate metric for characterizing temporal jitter with a biphasic period histogram (Paolini et al., 2001). Therefore, it appears that both sides of the synapse are involved in achieving precise timing. The presynaptic side uses specializations that are unique to the auditory system, whereas the postsynaptic side exploits a universal property of all neurons. Role of refractoriness in the auditory system Entrainment and synchronization are thought to be important for coding pitch and sound location (Carr and Konishi, 1988; Cariani, 1999; Colburn et al., 2003; Joris and Smith, 2008). A neural code based on spike timing implies that the temporal pattern of spikes elicited by different stimuli could be used to reliably discriminate these stimuli. Our study was not designed to examine whether the observed changes in temporal precision affect discrimination, though our measurements allow for consideration of the functional implications of refractoriness in auditory perception. Refractoriness reduced temporal dispersion by as much as 200 s for low-CF fibers (Fig. 7b,c). Given that the maximum interaural time difference is ⬃100 –200 s in chicken (Hyson, 2005) and that humans can discriminate sound locations corresponding to ⬃10 s differences (⬃1.5 s differences in barn owl; Mills, 1958; Knudsen and Konishi, 1979), the observed improvement in precision may play a large role in enhancing sound localization. Furthermore, humans discriminate small changes in the pitch of low-frequency sounds that correspond to differences in periodicity of microseconds (Knudsen, 1923). Therefore, it is likely that the enhanced precision reported in this study is responsible for improved temporal coding of soundsource location and pitch. Role of refractoriness in other sensory systems Temporal coding is a salient feature of the auditory system, but it also is employed by other sensory systems (Cariani, 2004). Therefore, it is interesting to consider whether refractoriness plays a universal role in enhancing temporal coding in all sensory systems. In nonauditory sensory systems, periodic stimuli are often limited to much lower frequencies than are found in acoustic stimuli. Phased-locked responses have been observed up to 20 Hz in the olfactory system to odorant pulse trains (Lemon and Getz, 1997), up to 100 –120 Hz in the visual system to flicker (Eysel and Burandt, 1984), up to 300 Hz in the somatosensory system to flutter vibration (Talbot et al., 1968), and up to 400 Hz in the vestibular system to head vibration (Young et al., 1977). These frequencies overlap with the lower frequency acoustic stimuli reported here; therefore, refractoriness likely improves entrainment and precision in these other sensory systems as well. Additional roles for refractoriness have also been recognized in visual systems coding transient stimuli, in which the refractory period enabled reproducibility of temporal spike patterns (Berry and Meister, 1998) and precision of spike timing (Uzzell and Chi-
J. Neurosci., May 1, 2013 • 33(18):7681–7690 • 7689
chilnisky, 2004). Therefore, we conclude that in those sensory systems in which temporal coding occurs on a timescale similar to that in the auditory system, refractoriness can play a critical role in the temporal coding of information about the outside world.
References Avissar M, Furman AC, Saunders JC, Parsons TD (2007) Adaptation reduces spike-count reliability, but not spike-timing precision, of auditory nerve responses. J Neurosci 27:6461– 6472. CrossRef Medline Berry MJ 2nd, Meister M (1998) Refractoriness and neural precision. J Neurosci 18:2200 –2211. Medline Beutner D, Moser T (2001) The presynaptic function of mouse cochlear inner hair cells during development of hearing. J Neurosci 21:4593– 4599. Medline Bi Q (1989) A closed-form solution for removing the dead time effects from the poststimulus time histograms. J Acoust Soc Am 85:2504 –2513. CrossRef Medline Cariani P (1999) Temporal coding of periodicity pitch in the auditory system: an overview. Neural Plast 6:147–172. CrossRef Medline Cariani PA (2004) Temporal codes and computations for sensory representation and scene analysis. IEEE Trans Neural Netw 15:1100 –1111. CrossRef Medline Carr CE, Konishi M (1988) Axonal delay lines for time measurement in the owl’s brainstem. Proc Natl Acad Sci U S A 85:8311– 8315. CrossRef Medline Colburn HS, Carney LH, Heinz MG (2003) Quantifying the information in auditory-nerve responses for level discrimination. J Assoc Res Otolaryngol 4:294 –311. CrossRef Medline Dumont RA, Lins U, Filoteo AG, Penniston JT, Kachar B, Gillespie PG (2001) Plasma membrane Ca 2⫹-ATPase isoform 2a is the PMCA of hair bundles. J Neurosci 21:5066 –5078. Medline Edmonds B, Reyes R, Schwaller B, Roberts WM (2000) Calretinin modifies presynaptic calcium signaling in frog saccular hair cells. Nat Neurosci 3:786 –790. CrossRef Medline Eysel UT, Burandt U (1984) Fluorescent tube light evokes flicker responses in visual neurons. Vision Res 24:943–948. CrossRef Medline Furman AC, Avissar M, Saunders JC (2006) The effects of intense sound exposure on phase locking in the chick (Gallus domesticus) cochlear nerve. Eur J Neurosci 24:2003–2010. CrossRef Medline Gaumond RP, Molnar CE, Kim DO (1982) Stimulus and recovery dependence of cat cochlear nerve fiber spike discharge probability. J Neurophysiol 48:856 – 873. Medline Gaumond RP, Kim DO, Molnar CE (1983) Response of cochlear nerve fibers to brief acoustic stimuli: role of discharge-history effects. J Acoust Soc Am 74:1392–1398. CrossRef Medline Goldberg JM, Brown PB (1969) Response of binaural neurons of dog superior olivary complex to dichotic tonal stimuli: some physiological mechanisms of sound localization. J Neurophysiol 32:613– 636. Medline Gray PR (1967) Conditional probability analyses of the spike activity of single neurons. Biophys J 7:759 –777. CrossRef Medline Gummer AW (1991) First order temporal properties of spontaneous and tone-evoked activity of auditory afferent neurones in the cochlear ganglion of the pigeon. Hear Res 55:143–166. CrossRef Medline Heller S, Bell AM, Denis CS, Choe Y, Hudspeth AJ (2002) Parvalbumin 3 is an Abundant Ca 2⫹ Buffer in Hair Cells. J Assoc Res Otolaryngol. Hodgkin AL, Huxley AF (1952) A quantitative description of membrane current and its application to conduction and excitation in nerve. J Physiol 117:500 –544. Medline Hyson RL (2005) The analysis of interaural time differences in the chick brain stem. Physiol Behav 86:297–305. CrossRef Medline Johnson DH, Swami A (1983) The transmission of signals by auditorynerve fiber discharge patterns. J Acoust Soc Am 74:493–501. CrossRef Medline Jones K, Tubis A, Burns EM (1985) On the extraction of the signalexcitation function from a non-Poisson cochlear neural spike train. J Acoust Soc Am 78:90 –94. CrossRef Medline Joris PX, Smith PH (2008) The volley theory and the spherical cell puzzle. Neuroscience 154:65–76. CrossRef Medline Joris PX, Carney LH, Smith PH, Yin TC (1994) Enhancement of neural synchronization in the anteroventral cochlear nucleus. I. Responses to
7690 • J. Neurosci., May 1, 2013 • 33(18):7681–7690 tones at the characteristic frequency. J Neurophysiol 71:1022–1036. Medline Kalluri S, Delgutte B (2003) Mathematical models of cochlear nucleus onset neurons: I. Point neuron with many weak synaptic inputs. J Comput Neurosci 14:71–90. CrossRef Medline Kara P, Reinagel P, Reid RC (2000) Low response variability in simultaneously recorded retinal, thalamic, and cortical neurons. Neuron 27: 635– 646. CrossRef Medline Kiang NYS (1965) Discharge patterns of single fibers in the cat’s auditory nerve. Cambridge, MA: MIT. Knudsen EI, Konishi M (1979) Sound localization by the barn owl (Tyto alba). J Comp Physiol A Neuroethol Sens Neural Behav Physiol 133:1–11. CrossRef Knudsen VO (1923) The sensibility of the ear to small differences of intensity and frequency. Phys Rev 21:84 –102. CrossRef Ko¨ppl C (1997) Phase locking to high frequencies in the auditory nerve and cochlear nucleus magnocellularis of the barn owl, Tyto alba. J Neurosci 17:3312–3321. Medline Lemon W, Getz W (1997) Temporal resolution of general odor pulses by olfactory sensory neurons in American cockroaches. J Exp Biol 200: 1809 –1819. Medline Lewis RS, Hudspeth AJ (1983) Voltage- and ion-dependent conductances in solitary vertebrate hair cells. Nature 304:538 –541. CrossRef Medline Li J, Young ED (1993) Discharge-rate dependence of refractory behavior of cat auditory-nerve fibers. Hear Res 69:151–162. Medline Liberman MC (1980) Morphological differences among radial afferent fibers in the cat cochlea: an electron-microscopic study of serial sections. Hear Res 3:45– 63. CrossRef Medline Manley GA, Gleich O, Leppelsack HJ, Oeckinghaus H (1985) Activity patterns of cochlear ganglion neurones in the starling. J Comp Physiol A Neuroethol Sens Neural Behav Physiol 157:161–181. CrossRef Marshall SP, Lang EJ (2004) Inferior olive oscillations gate transmission of motor cortical activity to the cerebellum. J Neurosci 24:11356 –11367. CrossRef Medline Martinez-Dunst C, Michaels RL, Fuchs PA (1997) Release sites and calcium channels in hair cells of the chick’s cochlea. J Neurosci 17:9133–9144. Medline Mills AW (1958) On the minimum audible angle. J Acoust Soc Am 30:237– 246. CrossRef Neubauer H, Ko¨ppl C, Heil P (2009) Spontaneous activity of auditory nerve fibers in the barn owl (Tyto alba): analyses of interspike interval distributions. J Neurophysiol 101:3169 –3191. CrossRef Medline Palmer AR, Russell IJ (1986) Phase-locking in the cochlear nerve of the guinea-pig and its relation to the receptor potential of inner hair-cells. Hear Res 24:1–15. CrossRef Medline
Avissar et al. • Refractoriness Enhances Temporal Coding Paolini AG, FitzGerald JV, Burkitt AN, Clark GM (2001) Temporal processing from the auditory nerve to the medial nucleus of the trapezoid body in the rat. Hear Res 159:101–116. CrossRef Medline Rhode WS, Smith PH (1986) Encoding timing and intensity in the ventral cochlear nucleus of the cat. J Neurophysiol 56:261–286. Medline Roberts WM (1993) Spatial calcium buffering in saccular hair cells. Nature 363:74 –76. CrossRef Medline Rose JE, Brugge JF, Anderson DJ, Hind JE (1967) Phase-locked response to low-frequency tones in single auditory nerve fibers of the squirrel monkey. J Neurophysiol 30:769 –793. Medline Rothman JS, Young ED, Manis PB (1993) Convergence of auditory nerve fibers onto bushy cells in the ventral cochlear nucleus: implications of a computational model. J Neurophysiol 70:2562–2583. Medline Smith CA, Sjo¨strand FS (1961) A synaptic structure in the hair cells of the guinea pig cochlea. J Ultrastruct Res 5:184 –192. CrossRef Spassova MA, Avissar M, Furman AC, Crumling MA, Saunders JC, Parsons TD (2004) Evidence that rapid vesicle replenishment of the synaptic ribbon mediates recovery from short-term adaptation at the hair cell afferent synapse. J Assoc Res Otolaryngol 5:376 –390. CrossRef Medline Spassova M, Eisen MD, Saunders JC, Parsons TD (2001) Chick cochlear hair cell exocytosis mediated by dihydropyridine-sensitive calcium channels. J Physiol 535:689 – 696. CrossRef Medline Strong SP, Koberle R, de Ruyter van Steveninck RR, Bialek W (1998) Entropy and information in neural spike trains. Phys Rev Lett 80:197–200. CrossRef Talbot WH, Darian-Smith I, Kornhuber HH, Mountcastle VB (1968) The sense of flutter-vibration: comparison of the human capacity with response patterns of mechanoreceptive afferents from the monkey hand. J Neurophysiol 31:301–334. Medline Uzzell VJ, Chichilnisky EJ (2004) Precision of spike trains in primate retinal ganglion cells. J Neurophysiol 92:780 –789. CrossRef Medline Wittig JH Jr, Parsons TD (2008) Synaptic ribbon enables temporal precision of hair cell afferent synapse by increasing the number of readily releasable vesicles: a modeling study. J Neurophysiol 100:1724 –1739. CrossRef Medline Xu-Friedman MA, Regehr WG (2005a) Dynamic-clamp analysis of the effects of convergence on spike timing. I. Many synaptic inputs. J Neurophysiol 94:2512–2525. CrossRef Medline Xu-Friedman MA, Regehr WG (2005b) Dynamic-clamp analysis of the effects of convergence on spike timing. II. Few synaptic inputs. J Neurophysiol 94:2526 –2534. CrossRef Medline Young ED, Ferna´ndez C, Goldberg JM (1977) Responses of squirrel monkey vestibular neurons to audio-frequency sound and head vibration. Acta Otolaryngol 84:352–360. CrossRef Medline