Regional variability in the frequency and magnitude of large explosive volcanic eruptions Tom Sheldrake and Luca Caricchi Department of Earth Sciences, University of Geneva, rue des Maraîchers 13, 1205 Geneva, Switzerland ABSTRACT or regionally). Change points in data completeQuantifying the frequency at which volcanic eruptions of different size occurs is impor- ness are identified based on analyzing the rate of tant for hazard assessment. Volcanic records can be used to estimate the recurrence rate of volcanic events (Coles and Sparks, 2006; Furlan, large-magnitude eruptions (magnitude ≥4), but recording biases that impact data complete- 2010; Mead and Magill, 2014; Rougier et al., ness complicate analysis. To overcome these biases, we conceptualize the volcanic record as 2016), which allows return periods for differa series of individual and unique time series associated by a common behavior. Thus, we ent eruption magnitudes to be estimated. In the approach issues of completeness on a volcano-by-volcano basis and use a hierarchical Bayes- Bayesian approach we adopt, the f-M behavior is ian approach to characterize the common frequency-magnitude (f-M) behavior for different quantified based on the proportion of each erupgroups of volcanoes. We identify variations in the f-M relationship between different volcano tion magnitude from individual, but exchangetypes and between different volcanic arcs. By accounting for systematic under-recording in able, volcanic records. Thus, we attempt to stathe volcanic record, we also calculate the global recurrence rates for large-magnitude erup- tistically account for under-recording based on tions during the Holocene, which are similar to previous estimates. However, higher recur- the proportion of each eruption magnitude in a rence rates for smaller-magnitude events are observed, which is a result of our adjustments period of time, rather than the number of events for data completeness. Quantifying how the f-M relationship varies between different groups for each magnitude. of volcanoes provides an opportunity to understand how the tectonic setting influences f-M We search for an observation window (tstart behavior, which is important to quantify long-term regional volcanic hazard. – tpresent, where t is time; Fig. 1) in which the processes that control the preservation of volINTRODUCTION We use the LaMEVE database (version canic deposits are consistent through time, so Various physical processes, occurring across 3.1), which provides a record of large-magni- that the proportion of each eruption magnia range of spatial and temporal scales, con- tude explosive eruptions (M ≥ 4) throughout the tude is constant. Essential to our approach is trol the frequency and size of volcanic erup- Quaternary (Crosweller et al., 2012). The data the notion of unique records, where volcanoes tions (Caricchi et al., 2014). Quantifying the suffer from a bias associated with measurement are only included in the analysis if their oldest frequency-magnitude (f-M) relationship for error, meaning a disproportionally large num- recorded eruption occurred before a particular different groups of volcanoes, or for different ber of events are rounded to the nearest integer date (tunique; Figs. 1A and 1B). This is based on regions on Earth, provides an opportunity to link (Brown et al., 2014). To overcome this bias we the assumption that for the whole tephrostratigthese physical processes to the tempo and size of group eruptions into different magnitude classes raphy at one volcano, any deposit that has not volcanism. Calculation of the f-M relationship (e.g., magnitude 4.0–4.9 = M4), rather than try to been eroded and lies above (i.e., is younger than) is based on analyzing the eruption record (e.g., fit a parametric distribution to the data. the oldest observed eruption is recorded. For Mason et al., 2004; Deligne et al., 2010). The In our analysis, we make an assumption an observation window, as the value of tunique eruption record, however, suffers from issues of of exchangeability (Bebbington, 2014; Shel- changes, the proportion of each eruption magnidata completeness related to natural (aleatory) drake, 2014), which implies that fundamental tude must remain constant. Importantly, changsources of bias associated with preservation processes leading to large-magnitude explosive ing the value of tunique only determines whether of deposits (Deligne et al., 2010; Brown et al., eruptions, associated with the accumulation of the record of each volcano is included in the 2014) and human-induced (epistemic) sources eruptible magma and triggering of an eruption, analysis (Fig. 1B). If a volcano is included (i.e., of bias resulting from the short duration of his- are shared by different volcanoes. The frequency it has at least one eruption older than tunique), all torical records (Coles and Sparks, 2006; Fur- of eruptions of M < 4 is potentially influenced data within the observation window are conlan, 2010; Rougier et al., 2016). This systematic by additional processes such as second boiling sidered and are used to calculate the proportion variation in under-recording limits the ability to (Tait et al., 1989), and hence smaller eruptions of each eruption magnitude for each value of analyze records from different time periods or may not satisfy the exchangeability assumption. tunqiue (Fig. 1C). Using a value of 2000 CE for tpresent, we pereven different regions on Earth. We develop a Similarly, we restrict the upper bound of the method to account for under-recording biases, data set to M7, as the processes triggering larger form a chi-square test of homogeneity for the which permits the analysis and comparison of eruptions could differ from those responsible for proportion of eruption magnitudes for two values the eruption record for different groups of vol- eruptions of lower magnitude (Deligne et al., of tstart: 50 ka and 11.7 ka (i.e., the Holocene) (see canoes and different volcanic regions on Earth. 2010; Gregg et al., 2012; Caricchi et al., 2014). the GSA Data Repository1). The hypothesis of To further satisfy the assumption of exchange- homogeneous under-recording is rejected for tstart DATA ability and common geo-tectonic processes, we = 50 ka (p ≈ 0; Fig. 2A) but accepted for tstart = The size of an eruption can be represented restrict the analysis to arc volcanoes. using the magnitude scale (Pyle, 2000), which 1 Data Repository item 2017028, summary of UNDER-RECORDING ANALYSIS is a continuous measure of mass: statistical methods, is available online at www Traditionally, completeness in the eruption .geosociety.org/pubs/ft2017.htm or on request from M = log10 [erupted mass (kg)] – 7. (1) record is analyzed at a group level (e.g., globally
[email protected]. GEOLOGY, February 2017; v. 45; no. 2; p. 111–114 | Data Repository item 2017028 | doi:10.1130/G38372.1 | Published online 12 December 2016 © 2016 The Authors. Access: This paper is published under the terms of the CC-BY license. GEOLOGY 45 |Open Number 2 | www.gsapubs.org | VolumeGold
111
Figure 1. Diagram presenting methodology to analyze group completeness for unique volcanic records (volcanoes A–D). A,B: For a specific observation window (tstart – tpresent, where t is time), number of events of different magnitude (indicated by bars of different height and color) is counted. A series of intervals in observation window is chosen (tunique = {tstart, t1, t2}), and if individual volcanic record has no events older than tunique, then volcano is not included in analysis for that tunique (e.g., volcano A for all values of tunique). C: For each magnitude, number of events from all volcanoes that satisfy tunique criterion are summed (ΣM), and relative proportions (PM) calculated for each value of tunique.
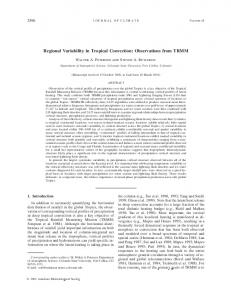
Figure 2. Analysis of under-recording for magnitude M4–M7 eruptions (using the same color scheme as Fig. 1) from unique records at arc volcanoes for two observation windows (see Fig. 1 for explanation of observation window and parameters). A: For tstart = 50 ka (t is time), value of relative proportion PM for a particular magnitude is not stationary (each diamond represents different value of tunique). B: For tstart = 11.7 ka, value of PM is approximately stationary and level of under-recording constant. C: Number of M4 events in our Holocene data for different values of tunique, with change point in recording rate calculated at 0.47 ka (see Data Repository [see footnote 1]).
11.7 ka (p = 1; Fig. 2B). The lack of homogeneity in the longer observation window may be due to a combination of decreasing number of volcanoes satisfying the tunique criterion and preferential recording of larger eruptions (Kiyosugi et al., 2015). Alternatively, these changes may also represent a natural process related to changes in the rate of preservation associated with glacial erosion, or perhaps to changes in the dynamics of magmatic systems as a result of deglaciation (Watt et al., 2013; Rawson et al., 2016). For the Holocene observation window, when the value of tunique is younger than ca. 0.5 ka, the proportion of M4 events is not constant (Fig. 2B), which is due to a change point in the recording rate of M4 events (Fig. 2C). This suggests that for the Holocene, once volcanoes that have only a historical record (i.e., dominated by smaller M4 events) are removed from the analysis, the rate of under-recording is constant for all eruption magnitudes (Deligne et al., 2010). Wellstudied volcanoes with records older than 0.5 ka are not subject to a historical bias. Indeed, the majority of volcanoes meeting the 0.5 ka criterion are in regions where extensive research has been undertaken (e.g., Japan, n = 44), and very few are in regions where the geological record is scarce (e.g., Indonesia, n = 6).
FREQUENCY-MAGNITUDE RELATIONSHIP To statistically characterize the f-M relationship for volcanic eruptions, we use the hierarchical Bayesian method set out by Sheldrake (2014) (see the Data Repository). In this approach, the proportion of eruptions of different magnitude is quantified considering groups of volcanoes associated by a common behavior (e.g., arc volcanoes), while maintaining that each volcano is characterized by a unique behavior. The statistical model is set up as uninformative, so that prior to observing the data, each eruption size is equally likely and there is no subjective judgement. Once updated by the data, the Bayesian model is used to calculate (1) a prior distribution that characterizes the common global f-M behavior, and (2) a series of posterior distributions that characterize the f-M behavior at individual volcanoes. The prior distribution is modeled using a Dirichlet distribution, as we characterize eruption magnitude as a discrete multivariate data set (i.e., mutually exclusive events) where the probability of the different events adds to unity. The Dirichlet distribution is advantageous, as it does not put any restrictions on the shape of the distribution, allowing different behaviors to be identified for different groups of volcanoes.
Based on the analysis of under-recording, we include only volcanoes that have a record older than 0.5 ka and count events that occurred only during the Holocene. In total, 197 volcanoes and 664 eruptions (our global data set) meet these requirements and are included in the statistical analysis. The posterior probabilities (Pr) for different magnitude events (m) occurring in different groups of volcanoes are characterized by powerlaw behaviors (Fig. 3; see the Data Repository):
Pr(M = m) ~
m
, (2) where g is a decay parameter and is the inverse of the power-law exponent, = 1 , (3) which enables the comparison of f-M behavior between different groups. Not all posterior distributions for individual volcanoes exhibit a power law (Fig. 3) because all states of the common magmatic processes are not necessarily observed at a single volcano, especially over the time scale of the Holocene. As an example, a volcano might be characterized by frequent magma replenishment leading to closely spaced smaller-magnitude eruptions, such that the inter-eruptive time is not sufficient to accumulate magma to feed larger-magnitude eruptions.
112 www.gsapubs.org | Volume 45 | Number 2 | GEOLOGY
Figure 3. Frequency-magnitude (f-M) behavior for different volcano morphologies (A,B), different volcanic arcs (C–E), and all volcanoes (F) in the analysis. Plotted on each chart are posterior results for individual volcanoes (dashed lines), fitted power-law behavior for respective group (crosses), number of volcanoes in each group (n), and value of power-law exponent (a; 2 standard deviations in parentheses). Inset on each chart is probability (prob.) density plot for crustal thickness at volcanic centers for each group using data from the global crustal model Crust 1 (Laske et al., 2013).
Importantly, an aleatory level of under-recording still persists in the eruption record, as not all volcanic deposits are well preserved (e.g., 1991 CE eruption of Mount Pinatubo, Philippines; Gran et al., 2011). Consequently, the slopes of the calculated power laws are unlikely to represent the true f-M behavior for volcanic eruptions. Nevertheless, the level of aleatory under-recording is stationary in time (Fig. 2B), allowing different groups of volcanoes to be compared. To investigate the robustness of the method, we distinguish volcanoes based on their morphology, as presented in the LaMEVE database. The two most populous volcano types in our analysis are calderas (n = 34) and stratovolcanoes (n = 121). The power-law exponent describing the common behavior in these two groups is lower for caldera volcanoes (a = 2.27; Fig. 3A) than for stratovolcanoes (a = 2.63; Fig. 3B), which is expected given that calderas are associated with larger volcanic eruptions (Brown et al., 2014; Cashman and Giordano, 2014; Whelley et al., 2015). This gives us confidence that the
methodology correctly characterizes the volcanic record, and allows us to investigate different volcanic arcs (Figs. 3C–3E). Variation in the f-M relationship is observed between different volcanic regions, with powerlaw behavior that can be either steeper (i.e., proportionally more smaller-magnitude events) or shallower (i.e., proportionally more largermagnitude events) than the global f-M relationship (Fig. 3). This ability to compare different volcanic regions offers a unique opportunity to understand how tectonic setting influences the frequency of explosive eruptions between M4 and M7. As an example, here we look at the role of crustal thickness. At a global scale, there is no clear relationship between crustal thickness and the steepness of the power-law behavior (Figs. 3C–3E), although our data restrain us from exploring this relationship fully as different parameters influence the rate and explosivity of arc volcanoes (e.g., Hughes and Mahood, 2008; Acocella and Funiciello, 2010). At a regional scale, however, when comparing different portions of the
Japanese arc where magma output is similar (e.g., Izu-Bonin versus Honshu; Table 1), the steeper power-law behavior is observed for sub-regions with the thinnest crust, which also have the lowest caldera density (Table 1). Nevertheless, it is clear that at a global scale, other parameters such as convergence rate or obliquity of convergence (Table 1) will be more important in controlling the f-M relationship. Quantifying the f-M relationship for Holocene eruptions is an important step to perform long-term volcanic hazard assessment at regional and global scale, but requires accounting for aleatory sources of under-recording. We calculate the global f-M relationship (see the Data Repository) by assuming that the level of underrecording (l) varies linearly with the power-law behavior, meaning that natural sources of underrecording (e.g., erosion) remove from the record a proportionally greater number of smaller events with respect to larger ones:
Pr(M = m) ~ (
)m. (4)
TABLE 1. RESULTS OF THE FREQUENCY-MAGNITUDE ANALYSIS, CALDERA DENSITY, CRUSTAL THICKNESS, AND SUMMARY OF TECTONIC FEATURES FOR ACTIVE VOLCANIC ARCS Number of Number of calderas volcanoes per 1000 km*
Mean crustal thickness§ (km)
Magma output rate# Trench-normal (km3/yr/100 km) subduction rate# (mm/yr)
Trench-parallel subduction rate# (mm/yr)
Arc
Power-law exponent α
Izu-Bonin Northeast Japan (Honshu) Southwest Japan (Kyushu) Southern Andes Kamchatka, Russia
3.80 ± 0.74 2.90 ± 0.17
10 18
3.3 13.0
15.1 ± 6.5 30.1 ± 3.0
4 ± 0.9 × 10⁻⁴ 1.5 ± 0.4 × 10⁻⁴
50 92
25 3
3.39 ± 0.83
8
7.5
21.2 ± 6.0
3 ± 0.7 × 10⁻³
60
23
2.39 ± 0.14 2.31 ± 0.14
17 24
6.9 14.5
38.5 ± 6.3 34.0 ± 5.3
1.3 ± 0.4 × 10⁻³ 3 ± 0.9 × 10⁻³
62 74
51 13
*Hughes and Mahood (2008). § Laske et al. (2013). # Acocella and Funiciello (2010).
GEOLOGY | Volume 45 | Number 2 | www.gsapubs.org
113
Additionally, on the basis of previous studies, we assume that (1) the global recording rate of M4 events since 1961 CE is complete, based on a calculated change point in underrecording (Furlan, 2010), which allows us to compute the expected number of M4 events during the Holocene; and (2) the completeness in the global record of M7 events in the Holocene is 70% (Brown et al., 2014). Importantly, there is no time dependence in Equation 4, as our calculations are based on the proportion of events, rather than a count of events, and so we assume that any time dependence is removed in the under-recording analysis. Fitting the global relationship from Figure 3F, we obtain a value of l = 0.319, which we use to estimate the number of eruptions per unit time. At a global scale for arc volcanoes (~88% of the LaMEVE database), the expected number of eruptions of each magnitude in the Holocene is similar in order of magnitude to that obtained from the analysis of a single global data set of 2000 yr (Mason et al., 2004; Fig. 4). However, the ability of our method to adjust for incompleteness is reflected in the estimates for M4, M5, and M6 eruptions that are, respectively, 50%, 33%, and 14% larger than those of Mason et al. (2004), supporting the consensus that smaller eruption magnitudes suffer greater levels of under-recording in the Holocene (Brown et al., 2014). These observations provide support to the validity of our method, suggesting the Bayesian approach can be used to identify variations in the f-M behavior for different groups of volcanoes, and potentially for other geological processes such as earthquakes. CONCLUSION We present a new method to approach underrecording, based on viewing the eruption record as a group of unique time series rather than a
Figure 4. Estimated number of eruptions of different magnitude (M4–M7) in Holocene using analysis in this study and results of Mason et al. (2004). Given the difference in methodology of these two analyses, similarity of results grants support for approach used here and results presented in Figure 3.
single global data set. With this approach, the rates of under-recording are systematically constrained. Using a hierarchical Bayesian approach, these unique records have been analyzed to understand common f-M behavior for groups of volcanoes. The results indicate that f-M behavior varies for different volcanic arcs, which is essential to developing appropriate volcanic hazard models for regions with a record of volcanic eruptions. Furthermore, quantifying variability in f-M behavior potentially provides insights into how tectonic setting controls volcanic activity. Tackling the analysis of unique volcanoes to understand common processes is a major frontier in volcanology (Cashman and Biggs, 2014). Bayesian methods provide an opportunity to understand common physical and geological processes from a series of unique data sets, which here are individual eruption records. With increases in the size of global data sets, we envisage that the application of Bayesian methods to other multivariate data sets, such as geochemistry, may provide an opportunity to link magmatic processes to the size and tempo of volcanism. ACKNOWLEDGMENTS Many thanks to Mark Bebbington, Valerio Acocella, and an anonymous reviewer for their informative comments, which greatly improved the manuscript. Sheldrake and Caricchi are supported by ERC grant 677493-FEVER. REFERENCES CITED Acocella, V., and Funiciello, F., 2010, Kinematic setting and structural control of arc volcanism: Earth and Planetary Science Letters, v. 289, p. 43–53, doi:10.1016/j.epsl.2009.10.027. Bebbington, M., 2014, Long-term forecasting of volcanic explosivity: Geophysical Journal International, v. 197, p. 1500–1515, doi:10.1093/gji/ggu078. Brown, S.K., et al., 2014, Characterisation of the Quaternary eruption record: Analysis of the Large Magnitude Explosive Volcanic Eruptions (LaMEVE) database: Journal of Applied Volcanology, v. 3, 5, doi:10.1186/2191-5040-3-5. Caricchi, L., Annen, C., Blundy, J., Simpson, G., and Pinel, V., 2014, Frequency and magnitude of volcanic eruptions controlled by magma injection and buoyancy: Nature Geoscience, v. 7, p. 126– 130, doi:10.1038/ngeo2041. Cashman, K., and Biggs, J., 2014, Common processes at unique volcanoes: A volcanological conundrum: Frontiers in Earth Science, v. 2, 28, doi: 10.3389/feart.2014.00028. Cashman, K.V., and Giordano, G., 2014, Calderas and magma reservoirs: Journal of Volcanology and Geothermal Research, v. 288, p. 28–45, doi:10 .1016/j.jvolgeores.2014.09.007. Coles, S.G., and Sparks, R.S.J., 2006, Extreme value methods for modelling historical series of large volcanic magnitudes, in Mader, H.M., et al., eds., Statistics in Volcanology: London, Geological Society of London, p. 47–56. Crosweller, H.S., et al., 2012, Global database on large magnitude explosive volcanic eruptions (LaMEVE): Journal of Applied Volcanology, v. 1, 4, doi:10.1186/2191-5040-1-4. Deligne, N.I., Coles, S.G., and Sparks, R.S.J., 2010, Recurrence rates of large explosive volcanic eruptions: Journal of Geophysical Research, v. 115, B06203, doi:10.1029/2009JB006554.
Furlan, C., 2010, Extreme value methods for modelling historical series of large volcanic magnitudes: Statistical Modelling, v. 10, p. 113–132, doi:10.1177/1471082X0801000201. Gran, K.B., Montgomery, D.R., and Halbur, J.C., 2011, Long-term elevated post-eruption sedimentation at Mount Pinatubo, Philippines: Geology, v. 39, p. 367–370, doi:10.1130/G31682.1. Gregg, P.M., de Silva, S.L., Grosfils, E.B., and Parmigiani, J.P., 2012, Catastrophic caldera-forming eruptions: Thermomechanics and implications for eruption triggering and maximum caldera dimensions on Earth: Journal of Volcanology and Geothermal Research, v. 241–242, p. 1–12, doi: 10.1016/j.jvolgeores.2012.06.009. Hughes, G.R., and Mahood, G.A., 2008, Tectonic controls on the nature of large silicic calderas in volcanic arcs: Geology, v. 36, p. 627–630, doi: 10.1130/G24796A.1. Kiyosugi, K., Connor, C., Sparks, R.S.J., Crosweller, H.S., Brown, S.K., Siebert, L., Wang, T., and Takarada, S., 2015, How many explosive eruptions are missing from the geologic record? Analysis of the quaternary record of large magnitude explosive eruptions in Japan: Journal of Applied Volcanology, v. 4, 17, doi:1 0. 1186/ s13617-015-0035-9. Laske, G., Masters, G., Ma, Z., and Pasyanos, M.E., 2013, Update on CRUST1.0: A 1-degree global model of Earth’s Crust: Geophysical Research Abstracts, v. 15, Abstract EGU2013-2658. Mason, B.G., Pyle, D.M., and Oppenheimer, C., 2004, The size and frequency of the largest explosive eruptions on Earth: Bulletin of Volcanology, v. 66, p. 735–748, doi:1 0. 1007/ s00445-004-0355-9. Mead, S., and Magill, C., 2014, Determining change points in data completeness for the Holocene eruption record: Bulletin of Volcanology, v. 76, 874, doi:10.1007/s00445-014-0874-y. Pyle, D.M., 2000, Sizes of volcanic eruptions, in Sigurdsson, H., et al., eds., Encyclopedia of Volcanoes: San Diego, California, Academic Press, p. 263–269. Rawson, H., Pyle, D.M., Mather, T.A., Smith, V.C., Fontijn, K., Lachowycz, S.M., and Naranjo, J., 2016, The magmatic and eruptive response of arc volcanoes to deglaciation: Insights from southern Chile: Geology, v. 44, p. 251–254, doi:10.1130 /G37504.1. Rougier, J., Sparks, S., and Cashman, K., 2016, Global recording rates for large eruptions: Journal of Applied Volcanology, v. 5, 11, doi:10.1186/s13617 -016-0051-4. Sheldrake, T., 2014, Long-term forecasting of eruption hazards: A hierarchical approach to merge analogous eruptive histories: Journal of Volcanology and Geothermal Research, v. 286, p. 15–23, doi: 10.1016/j.jvolgeores.2014.08.021. Tait, S., Jaupart, C., and Vergniolle, S., 1989, Pressure, gas content and eruption periodicity of a shallow, crystallising magma chamber: Earth and Planetary Science Letters, v. 73, p. 191–204, doi: 10.1016/0012-821X(89)90025-3. Watt, S.F., Pyle, D.M., and Mather, T.A., 2013, The volcanic response to deglaciation: Evidence from glaciated arcs and a reassessment of global eruption records: Earth-Science Reviews, v. 122, p. 77–102, doi:10.1016/j.earscirev.2013.03.007. Whelley, P., Newhall, C., and Bradley, K., 2015, The frequency of explosive volcanic eruptions in Southeast Asia: Bulletin of Volcanology, v. 77, doi:10.1007/s00445-014-0893-8. Manuscript received 18 July 2016 Revised manuscript received 20 October 2016 Manuscript accepted 1 November 2016 Printed in USA
114 www.gsapubs.org | Volume 45 | Number 2 | GEOLOGY