Abstract. This research is performed to derive weather properly, i.e. relative humidity, based on precipitable water from MODIS (Moderate Resolution Imaging ...
Parwati Sofan, Totok Sugiharto and Hasnaeni
RELATIVE HUMIDITY ESTIMATION BASED ON MODIS PRECIPITABLE WATER FOR SUPPORTING SPATIAL INFORMATION OVER JAVA ISLAND
PARWATI SOFAN 1 , TOTOK SUGIHARTO 2 AND HASNAENI 3
Abstract This research is performed to derive weather properly, i.e. relative humidity, based on precipitable water from MODIS (Moderate Resolution Imaging Spectroradiometer) data which on board of T15RRAAQUA satellites. As one of dynamic atmospheric parameters, the precipitable water has ability to indicate the dryness or wetness of a certain area. It can be derived by MODIS at 0.865. 1.24, 0.905. 0.936 and 0.940 urn of its wavelength ranges. Verification of MODIS precipitable water is made using radiosonde data at 2 climatological stations in Java island (Jakarta and Surabaya). The result shows that the standard deviation between precipitable water which is derived by MODIS and radiosonde data (August - October 2004). is 1.6 cm. Meanwhile, through the statistical analysis, they have significant correlation of aboul 0.82. In adition, the relationship between the MODIS precipitable water and the altitude has a negative correlation (r = -0.98 (. It means thai the precipitable water tends lo decrease along with the increase of altitude. According to the climate condition in West Java which is mostly wetter rather than that of East Java, we knew thai the precipitable water in West Java is higher than East Java. Related to relative humidity, the MODIS precipitable water can be used to estimate relative humidity, based on topography area. the correlation coeficient between 0.84 - 0.92. Key words; MODIS Precipitable water. Radiosonde, Relative humidity. Verification
I, Introduction Studies to derived precipitable water vapor from MODIS (Moderate Resolution Imaging Spektronuliumeler) data was made in subtropical country by Kaufman and Gao (1992, 2003), Sobrino, el al, (2003), and Gao, et al, (2003). MODIS data with their ability in spectral (36 spectrum bands), temporal (daily time) and spatial resolutions (250m, 500m and I km)
are suitable for monitoring regional precipitable water over large area. As one of dynamic atmospheric parameters, the precipitable water has ability to indicate the dryness or wetness in a certain area. Dryness or wetness condition can be derived using MODIS's band al the center of wavelength on 0.865, 1.24, 0.905, 0.936. and 0.940 urn.
Researcher, Remuie Sensing Application and Technology Development Center. National Institute of Aeronautics and Space (LAPAN) (parwati s@'yahoo.com) HarthLine Remote Sensing Agency Indonesian Berau of Geophysics and Meteorology (BMG) REMOTE SENSING AND EARTH SCIENCES September 2007 Volume 4
33
Relative Humidity Estimation Based on MODIS Precipitable for Supporting Spatial Information over Java Island
Meanwhile, there are only a few studies of atmospheric properties by MODIS data at tropical country such as Indonesia. As we know Indonesia is one of tropical countries with many islands that has a specific climates, which has different variations according to geography, topography, and landuse condition. Java island is one of islands in Indonesia that has the highest mobility in many sectors with population of more than 113 million people (BPS. 2000). In other side, Java has a very specific characteristic climate, where eastern region has drier climate than that of west region. Therefore, it is needed the verification and validation for precipitable water information from MODIS data with in situ data. The verification of precipitable water from remote sensing data could be made by comparing with the results of radiosonde measurements from climatological stations. There are only 2 radiosonde stations in Java Island, i.e., in Jakarta and Surabaya. In order to provide a spatial weather information in a large area and up to dale, it is neceassary to develop weather information by indirect approehement using data of precipitable water from MODIS data. In this study, the relationship between preciptable water and surface relative humidity in Java island is also discussed. We hope that this research can produce the daily information of weather prediction from satellite data over large area in Java island.
II. Water Vapor Distribution
Water involves processes of evaporation from earth surface and condensation into cloud. then fall into earth by precipitation. Amount of water vapor in atmosphere is affected by temperature variations from altitude and local geography conditions. As other words, the content of water vapor in atmosphere can be spreaded out by their distributions both vertically and horizontally. The vertical distribution of air temperature and water vapor in atmosphere was described by Figure I. It can be seen that water vapor tends to decrease with the increasing of atmospheric height, instantaneous air temperature to be lower. As air temperature being higher, air capacity retaining water vapor becomes higher. Most of the total water vapor in the atmosphere appears at sea level up to 1.5 km from sea level, then 5-6% of water vapor appears more than 5 km height above sea level, 1% of water vapor in stratosphere about 12 km above sea level. Relative humidity tends to decrease according to altitude, with average 60-80% on surface and decrease to be 20^t0% at altitude 300 mbar (9 km) (Handoko, 19°5; American Geophysical Union, 2000).
Meanwhile, the horizontal distribution of total water vapor on surface reported by American Geophysical Union (2002), has high heat value in equator region, and then decreases with the increasing of latitudes and keeps decreasing till the lowest values in polar (Figure 2). However, this circumstance docs not occur in desert where water vapor in air is low even though its temperature is high.
Water vapor in atmosphere can be explained by the hydrology cycle that
34
REMOTE SENSING
EARTH SCIENCES September 2007 Volume 4
Parwati Sofan, Totok Sugiharto and Hasnaeni
Fig. 1. Scheme of layer of troposphere, stratosphere, and tropopause. Vertical temperature distribution (°C) and water vapor (g/kg) in atmosphere (milibar) and height of atmosphere (km) (American Geophysical Union, 2000).
Fig. 2. The horizontal distribution of precipitable water in 1992 (American Geophysical Union, 2000).
REMOTE SENSING AND EARTH SCIENCES September 2007 Volume 4
35
Relative Humidity Estimation Based on MODIS Precipitable Water for Supporting Spatial Information over Java Island
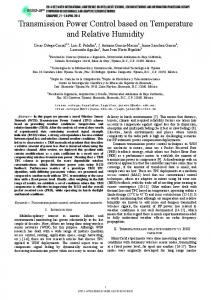
III. Precipitable Water Derivation from MODIS In remote sensing technology, the reflected solar radiation after absorbed by water vapour from the surface is transmitted up through the atmosphere to satellite sensor. The equivalent total vertical amount of water vapor can be derived by comparison between the reflected solar radiation in the absorption channel, and the reflected solar radiation in nearby nonabsorption channels (Kaufman and Gao, 1992). The MODIS instrument has 36 channels covering the spectral region between 0.4 and 15 urn. Five near-IR
channels in the 0.8-1.3 urn spectral region are useful for remote sensing of water vapor. The wavelength and widths of these channels from the original MODIS design specifications are given in Table 1. Figure 3 explains the transmittance spectra value of water vapor content over tropical to subtropical. Both channel 0.865 urn and 1.24 urn are nonabsorption channels, however channels 0.905, 0.935, and 0.940 urn are absorbption channel. Mostly, channel 18 is absorbed strongly by vapor. Channel 17 is absorbed weakly by vapor, and it is most useful in very humid conditions (Kaufman and Gao, 1992).
Table 1. Positions and Widths of Five MODIS Near-IR Channels Used in Water Vapor Retrievals Properties
MODIS Channel
Position, urn
Witdh, um
2 5
0.865 1.240
0.040 0.020
Absorption channel Absorption channel
17
0.905
0.030
Non absorption channel
18
0.936
0.010
Non absorption channel
19
0.940
0.050
Non absorption channel
Fig. 3. Positions and widths of five MODIS near-IR channel marked in thick horizontal bar, and 2-way atmospheric water vapor transmittance spectra for Tropical and Sub-Arctic Winter (Gao and Kaufman, 1992)
36
REMOTE SENSING AND EARTH SCIENCES September 2007 Volume 4
Parwati Sofan, Totok Sugiharto and Hasnaeni
In this study, there are some steps to process MODIS Level IB data i.e. radiometric correction (Bow-tie Correction) and geometric correction, and then conversion of digital number into reflectance value, separation of land, sea, and cloud mask using Sobrino et ah, (2003) method, and derivation of precipitable water (Gao and Kaufman, 2003). Land and sea mask is made by using near infrared spectrum which is highly absorbed in the deeper sea. Meanwhile, the cloud detection can be made by using the ratio of reflectance 2 and reflectance 1, or using the brightness temperature of channel 32. Computing precipitable water is consist of the 3-channel ratio method and the 2-channel ratio method. The tree (3)channel ratio method is used to compute precipitable water over land. While, the 2channel ratio method is used to compute precipitable water over cloud and sea with sun glint. The equations to compute precipitable water are proposed by Gao and Kaufman (2003) as follows:
Wi, W2, W3 = precipitable water vapor in channel 17 (0.905 pm), channel 18 (0.936 urn), and channel 19 (0.940 pm). fi, h, f3
=
weighting function for channel 17 (0.905 pm), channel 18 (0.936 pm), and channel 19 (0.940 pm).
Ti(i,2,3)
=
Transmittance in channel 17 (0.940 pm), 18 (0.936 pm), and 19 (0.940 pm).
P(i,2,3,4,5)
=
Reflectance in channel 17 (0.940 pm), 18 (0.936 pm), 19 (0.940 pm), 2 (0.865 pm), and 5 (1.240 pm).
IV.
Precipitable Water Derivation from Radiosonde Data
The estimation of precipitable water from radiosonde data is made in the range of air pressures at 1013, 1000, 925, 850, 700, 600, and 500 milibar (mb). The weather properties used in precipitable water calculation are air temperature, relative humidity, and air pressure according to Butler's equation (1998) they are connected as follows: 22 64e Po = 2.409 10' RH©V -
(5)
h
(6)
Po / (3 To)
where, h is total precipitable water (mm), Po is surface air pressure (mb), To is surface temperature (K), RH is relative humidity (%), and 9 is inverse of temperature (0 = 300/To).
where: W = height of column of precipitable water vapor (cm).
V. Material and Method This study made is for Java Island where is divided into 3 regions, i.e. West
REMOTE SENSING AND EARTH SCIENCES September 2007 Volume 4
37
Relative Humidity Estimation Based on MODIS Precipitable Water for Supporting Spatial Information over Java Island
Java (Bekasi, Jakarta, Bogor, Serang, Serang, Rangkasbitung), Central Java (Jepara, Kudus, Demak, Purwodadi, Semarang, Kendal, Temanggung, Salatiga, Sragen, Magelang, Surakarta, Karanganyar, DIY, Klaten, Sukoharjo), and East Java (Bangkalan, Gresik, Lamongan, Surabaya, Jombang, Sidoarjo, Mojokerjo, Kediri, Malang, Pasuruan). The study areas are shown in Figure 4. The main data in this study is MODIS data over Java Island. Daily MODIS data in August, September, October 2004 and January and February 2005 are used.
106
109
Another satellite data is DEM (Digital Elevation Mapping) by SRTM (Shuttle Radar Topography Mission) with spatial resolution 90 m over Java Island. Meanwhile, insitu observation data from radiosonde from Jakarta climatology station (6.117° S, 106.65° E) and Surabaya climatology station (7.367° S, 112.77° E), and also relative humidity from 52 climatology stations over Java Island are used for the validation. The flowchart of data processing and analyzing is shown in Figure 5.
110
112
113
Fig. 4. Three regions of study area (West Java, Central Java, and East Java)
38
REMOTE SENSING AND EARTH SCIENCES September 2007 Volume 4
Parwati Sofan, Totok Sugiharto and Hasnaeni
Fig. 5. Flowchart of data processing and analyzing
VI. Result and Discussion a. Verification of MODIS Precipitable Water by Radiosonde Precipitable Water The calculation of precipitable water is done based on the fact that the water vapor is dominant at 1.5 km above sea level or at atmospheric pressure between 1013 - 850 mb (American Geophysical Union, 2000; Butler, 1998). Therefore, the derivation of precipitable water by MODIS was obtained at that the same vertical levels.
the standard deviation between the MODIS precipitible water of the radiosonde precipitable water is 1.6 cm. Figure 6 shows the linear relationship between the estimated MODIS precipitable water (x) and the radiosonde precipitable water vapor (y) (y=0.9943 x). Although the coefficient of correlation between MODIS precipitable water and the radiosonde precipitable water was quite high (88%), but only 78% of variance of MODIS precipitable water can be represented by the linear model.
Using MODIS data in the period of August - October 2004, it was shown that
REMOTE SENSING AND EARTH SCIENCES September 2007 Volume 4
39
Relative Humidity Estimation Based on MODIS Precipitable Water for Supporting Spatial Information over Java Island
Fig. 6. Scatter plot of MODIS precipitable water (cm) and Radiosonde precipitable water in Jakarta and Surabaya at 1013 - 850 mb air pressure or 1.5 km above sea level (August - October, 2004) b.
The Effect of Climate Condition in Precipitable Water
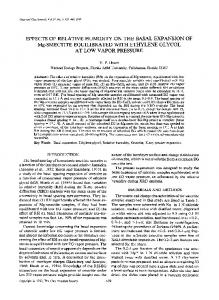
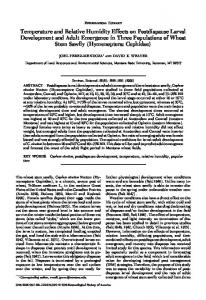
Based on topography in Java, we found that the precipitable water tends to decrease with the increase of altitude. There is also a significant relationship between precipitable water and altitude with the coefficient of correlation (r) 0.9. Meanwhile, analysis of MODIS precipitable water was also made with the different of the climate condition in West Java which is commonly wetter than that of East Java. The result shows that the precipitable water in West Java is higher than in East Java. Figure 7 shows that the precipitable water in West Java is higher than East Java in dry season (August October 2004) or in rainy season (January - February 2005). The estimated values of precipitable water during dry season in
40
West Java are about 2.2 - 11.9 cm, while in East Java are 2.3 - 9.6 cm. However during rainy season, the values of precipitable water in West Java are about 6.9 - 12.6 cm, while in East Java are 6.9 12.6 cm. In addition, based on the climatology data in 1994-2000, the average of air temperature in West Java is lower (24.7°C) than East Java (25.7°C). This conditions result in the climate condition in West Java wetter than of East Java. Spatial distribution of MODIS precipitable water in West Java area and East Java area can be shown in Figures 8 and 9. It is shown that in the same altitude (0 - 200 m above sea level), the precipitable water in West Java is about 8 - 14 cm (Fig. 8), while in East Java is 5 — 9 cm (Fig. 9).
REMOTE SENSING AND EARTH SCIENCES September 2007 Volume 4
Parwati Sofan, Totok Sugiharto and Hasnaeni
2200 — East Java (Ags-Oct)
2000
+ West Java (Ags-Oct)
1800
O East Java (Jan-Feb)
1600 1400 1200 1000 CD Z3
800 600 400 200 0
0 1 2 3 4 5 6 7 8 9 10 11 12 13 14 15 MODIS Precipitable Water (cm) Fig. 7. MODIS precipitable water in West Java and East Java during August - October 2004 and January - February 2005
Bates Kabupaten Kontur Ketinggian
Fig. 8. The Distribution of MODIS precipitable water (cm) in West Java on Oct. 4, 2004
Bates Kabupaten ' Kontur Ketinggian
Fig. 9 The Distribution of MODIS precipitable water (cm) in East Java on Oct. 4, 2004
REMOTE SENSING AND EARTH SCIENCES September 2007 Volume 4
41
Relative Humidity Estimation Based on MODIS Precipitable Water for Supporting Spatial Information over Java Island
c.
Relationship Between Precipitable Water and Relative Humidity
The regression analysis was made to know the correlation between precipitable water and relative humidity. There are 2 sources of relative humidity data that is used to verify the MODIS precipitable water. First is the radiosonde measurement and other is the surface climatology station measurement. Based on the relative humidity from radiosonde, it is shown that the coefficient of correlation with MODIS precipitable water is about 0.6, while the coefficient of determination is only 0.4. This result is not quite good to represent the relative humidity in a large area. This is because of the lack of relative humidity data from radiosonde, i.e. there are only 2 stations for radiosonde measurement in Java Island (Jakarta and Surabaya). Therefore, the second analysis was made used relative humidity from the surface climatology station. The number of climatology
stations used in this study are 52. We divided the analyses into 3 regions (West, Central and East Java). Because of the high correlation between precipitable water with altitude, we did the relative humidity analysis based on area topography in the range 0 2000 m above sea level with the interval 50 m. Table 2, 3, and 4 show the results of the regression analysis between relative humidity and precipitable water in West Java, Central Java, and East Java, respectively during August - October 2004. We found that the spatial distribution of relative humidity with altitude does not show a good pattern. The same value of relative humidity could be found in high or low land. The condition of landuse type which is dominant in a certain area could be one of the reasons which can effect the evaporation as the source of water vapor and has a contribution to the relative humidity in a certain area.
Table 2. The relationship between relative humidity (y axis in %) and precipitable water (x axis in cm) based on altitude in West Java during August October 2004 Altitude
R2
Equation
(m)
stdev (x)
average (x)
max
min
stdev
(x)
(y)
average (y)
max
(x)
(y)
min (y)
0-150
y=1.9457x +51.617
0.800
1.812
9.788
12.706
4.788
3.940
71
79
62
150-300
y = 1.5093x + 57.076
0.849
2.191
9.384
15.186
4.528
3.590
71
78
65
300-600
y = 1.8471x + 56.18
0.809
1.728
8.340
12.432
4.974
3.546
72
79
65
600-700
y = 2.5351 x + 53.803
0.814
1.484
7.231
9.814
5.227
4.171
72
80
65
700-850
y = 3.0998x + 51.563
0.804
1.271
6.499
9.024
4.703
4.395
72
82
65
850-900
y = 2.8214x + 54.816
0.812
1.219
5.682
8.299
4.439
3.815
71
78
65
900-1250
y = 3.1477X + 54.561
0.802
1.214
5.315
7.812
3.583
4.267
71
83
65
1100-1250
y = 2.5351x + 59.914
0.810
1.204
4.714
7158
2.811
3.390
72
78
67
1250-1400
y = 2.6816x + 60.637
0.805
1.159
4.093
6.848
2.313
3.464
72
78
65
1400-1700
y = 3.1009x +60.485
0.745
0.947
3.634
5.378
2.375
3.402
72
76
65
1700-1800
y = 4.409x + 57.336
0.817
0.653
2.889
4.372
2.264
3.528
71
79
66
1800-2000
y = 3.7142x +62.759
0.838
0.592
2.537
3.643
1.843
2.403
72
76
68
42
REMOTE SENSING AND EARTH SCIENCES September 2007 Volume 4
Parwati Sofan, Totok Sugiharto and Hasnaeni
Table 3. The relationship between relative humidity (y axis in %) and precipitable water (x axis in cm) based on altitude in Central Java during August October 2004 Altitude
Equation
R2
(m)
stdev (x)
average (x)
max
min (x)
stdev (y)
average^)
max
(x)
(y)
min (y)
0-50
y = 5.2172x + 16.781
0.791
0.811
9.338
10.245
7.339
4.761
66
73
58
50-100
y = 3.7677X + 39.143
0.811
1.271
8.241
10.001
6.218
5.316
70
78
61 61
100-350
y = 4.1537x +41.144
0.776
1.127
7.221
8.852
4.265
5.317
71
80
350-550
y = 3.9615x + 48.588
0.784
1.076
5.853
7.738
3.973
4.812
72
80
62
550-700
y = 4.6899x + 47 145
0.805
0.896
5.382
7.010
3.873
4.683
72
80
63
750-800
y = 4.8569x + 47.85
0.731
0.819
4.857
6.073
3.413
4.653
71
79
63
800-950
y = 10.032X + 30.098
0.768
0.394
4.179
4.723
3.410
4.505
72
79
64
950-1150
y = 11.839x + 29.791
0.751
0.316
3.532
4.019
2.760
4.316
72
78
64
1150-1250
y = 8.1952x +46.924
0.715
0.361
3.185
3.709
2.485
3.503
73
78
66
1250-1350
y = 7 1823x+ 50.551
0.712
0.429
3.011
3.655
2.016
3.655
72
78
66
1350-1550
y = 7.0095X + 53.877
0.715
0.396
2.708
3.486
1.762
3.278
73
79
67
1550-1650
y = 8.1636x + 52.219
0.811
0.356
2.477
3.108
1.725
3.230
72
78
67
1650-1750
y = 7.738x + 53.727
0.811
0.403
2.380
3.328
1.539
3.465
72
78
66
1750-1850
y = 5.9285x + 58.96
0.766
0.469
2.335
3.466
1.440
3.178
73
78
67
1850-2000
y = 5.2457x + 60.798
0.833
0.560
2.179
3.154
1.049
3.217
72
77
66
Table 4. The relationship between relative humidity (y axis in %) and precipitable water (x axis in cm) based on altitude in East Java during August - October 2004 Altitude
Equation
R2
(m)
stdev (x)
average (x)
max
min
stdev
(x)
(y)
average (y)
max
(x)
(y)
min (y)
0-100
y = 5.9796x+ 13.667
0.795
0.960
8.9775
10.788
7161
6.436
67
79
57
100-250
y = 4.9278x + 31.43
0.793
1.023
7.9698
9.843
5.907
5.662
71
79
58
250-300
y = 4.2585x + 40.237
0.850
0.992
7.0673
9.363
5.724
4.583
70
79
62
300-450
y = 5.8975x + 30.469
0.842
0.806
6.6149
8.333
5.139
5.179
69
79
59
450-550
y = 6.3308x + 30.359
0.814
0.771
6.0953
7.782
4.909
5.410
69
79
59
550-800
y = 6.423x + 33.324
0.801
0.743
5.4624
7.274
4.808
5.330
68
79
59
800-900
y = 6.3677x + 37 158
0.788
0.783
4.8491
6.860
3.830
5.615
68
79
59
900-1050
y = 6.8866x + 38.566
0.809
0.651
4.3544
6.161
3.435
4.981
69
79
59
1050-1150
y = 8.0035x + 37.083
0.833
0.585
3.9072
5.444
2.947
5.134
68
78
59
1150-1300
y = 7.7875x +40.15
0.787
0.504
3.4997
4.672
2.373
4.430
67
78
59
1300-1450
y = 10.931x + 33.827
0.791
0.400
3.1116
4.101
2.355
4.920
68
78
59
1450-1600
y=12.266x + 33.859
0.739
0.380
2.8156
3.699
2.061
5.423
68
79
58
1600-1700
y = 15.358x + 30.291
0.811
0.286
2.5222
2.966
2.015
4.874
69
78
61
1700-1900
y = 13.703x + 38.816
0.812
0.322
2.2665
2.892
1.720
4.897
70
80
62
1950-2000
y = 15.172x + 38.57
0.833
0.311
2.0041
2.518
1.450
5.162
69
80
61
/ REMOTE SENSING AND EARTH SCIENCES September 2007 Volume 4
43
Relative Humidity Estimation Based on MODIS Precipitable Water for Supporting Spatial Information over Java Island
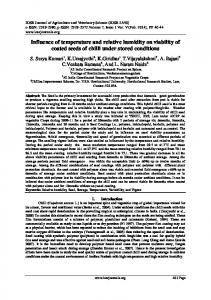
d. The Application of Relative Humidity Model in Agricultural Land Figure 10 shows the spatial information of the relative humidity estimation from MODIS precipitable water in East Java. Adding another information such us landuse/landcover from Landsat data for example, can give
Fig. 10.
Spatial information of relative humidity estimation in paddy area based on MODIS precipitable water
VII. Conclusion Precipitable water derived from MODIS's near infrared spectrum can be used for monitoring the condition of the relative humidity in Java Island. Precipitable water has a good relationship with altitude (r = -0.9) and tends to decrease along with the increase of
44
an information about distribution of relative humidity over the different types of landuse/landcover. Another application is for the agriculture land. We could do daily monitoring for relative humidity in a specific agriculture land, to be used for preventing crop from diseases.
altitude. According to the climate condition, we found that the precipitable water in West Java is higher than East Java. Meanwhile, MODIS precipitable water can be used to estimate relative humidity based on the topography of a certain region with the correlations coefficient between 0.84 - 0.92.
REMOTE SENSING AND EARTH SCIENCES September 2007 Volume 4
Parwati Sofan. Totok Sugiharto and Hasnaeni
References
the Terra MODIS Instrument. IEEE Trans. Gcosei. Remote Sens, Vol. 41, No.4: 895-900.
American Geophysical Union. 2002. Walcr vapor in the climate system. Florida Ave., N.W., Washington, DC 20009.
Handoko. 1995. Klimatologi Dasar. Pustaka Java. Jakarta.
Butler. B. 1998. Precipitable Water at KP 1993-1998. National Radio Astronomy Observatory.
Kaufman. Y.J. and B.C. Gao. 1992. Remote sensing of water vapor in the near IR from EOS/MODIS, IEEE Trans. Geosci. Remote Sens, Vol. 30, No.5: 871-884.
Gao, B.C. and YJ. Kaufman. 2003. Water vapor retrievals using moderate resolution imaging spectroradiometer (MODIS) near-infrared channels. J. Geophys Research, Vol. 108, No. D13, 4389: 1-10. Gao, B.C., P. Yang, G. Guo, S.K. Park. W.J. Wiscombe, and B. Chen. 2003. Measurements of water vapor and high clouds over the Tibetan Plateau with
Sobrino. J.A., J.E. Kharraz, and Z.L. Li. 2003. Surface temperature and water vapor retrieval from MODIS data. Int. J. Remote Sens, Vol. 24, No. 24: 5161-5182. www. bps.go.id www. modis-atmos.gsfc.nasa.gov
REMOTE SENSING AND EARTH SCIENCES September 2007 Volume 4
45