Journal of Retailing 81 (3, 2005) 215–230
Removing the contextual lens: A multinational, multi-setting comparison of service evaluation models Michael K. Brady a,∗ , Gary A. Knight a,1 , J. Joseph Cronin Jr. a,2 , G. Tomas b , M. Hult b,3 , Bruce D. Keillor c,4 b
a Florida State University, College of Business, Tallahassee, FL 32306-1110, USA Graduate School of Management, Michigan State University, N370 Business College Complex, E. Lansing, MI 48824, USA c The University of Akron, College of Business Administration, Akron, OH 44325-4804, USA
Abstract Four service evaluation models are identified from the literature that are commonly offered to depict the relationships amongst the primary service evaluation constructs of sacrifice, service quality, service value, satisfaction, and behavioral intentions. We comparatively test the models using samples of service consumers in Australia, Hong Kong, Morocco, the Netherlands, and the United States, as well as across varied temporal and service settings. The results of the comparative analyses reveal that one conceptualization, the “comprehensive” model, best captures the identified relationships. This model is the best fitting across all countries and settings, which indicates it has the greatest external validity. These findings are discussed relative to the limitations associated with the use of less generalizable models. © 2005 New York University. Published by Elsevier Inc. All rights reserved. Keywords: Contextual lens; Service evaluation models; Comprehensive model
Introduction Research related to marketing services has gained considerable momentum over the past 25 years (e.g., Fisk, Brown, & Bitner 1993; Shostack 1977). The result of this discourse is a growing knowledge base relative to how service customers conceptualize, perceive, and evaluate service delivery, as well as how these factors influence purchasing behavior. Researchers and practitioners now have better information concerning such things as how service quality is evaluated, how customers derive value from a service offering, what drives customer satisfaction, and who will become loyal patrons of a service provider. Indeed, considering the migra∗
Corresponding author. Tel.: +1 850 644 7853; fax: +1 850 644 4098. E-mail addresses:
[email protected] (M.K. Brady),
[email protected] (G.A. Knight),
[email protected] (J.J. Cronin Jr.),
[email protected] (M. Hult),
[email protected] (B.D. Keillor). 1 Tel.: +1 850 644 1140; fax: +1 850 644 4098. 2 Tel.: +1 850 644 7858; fax: +1 850 644 4098. 3 Tel.: +1 517 353 6381; fax: +1 517 432 1112. 4 Tel.: +1 330 972 8839; fax: +1 330 972 5798.
tion of traditional physical goods producers such as GE, Microsoft, Xerox, and IBM towards value-added service provision, even physical goods producers have become assiduous services marketers. A critical focus of service research to date is the identification and study of those factors that “drive” consumers’ service purchases. Practitioners and researchers are particularly interested in uncovering the factors instrumental to understanding service evaluations. The list of such factors is growing, but five constructs are particularly prevalent: sacrifice, service quality, service value, customer satisfaction, and behavioral intentions1 (e.g., Anderson, Fornell, & Lehmann 1994; Cronin & Taylor 1992; Parasuraman, Zeithaml, & Berry 1988; Zeithaml 1988; Zeithaml, Berry, & Parasuraman 1996). These five constructs have been studied individually, but are more often depicted in subsets or mod1 Behavioral intentions is a construct that captures multiple outcome dimensions (cf. Zeithaml et al., 1996) and is employed here to account for the range of outcome measures (e.g., loyalty, word-of-mouth) that appear in extant service evaluation studies (e.g., Bolton & Drew 1991; Fornell et al. 1996; Heskett et al. 1994; Ostrom & Iacobucci 1995).
0022-4359/$ – see front matter © 2005 New York University. Published by Elsevier Inc. All rights reserved. doi:10.1016/j.jretai.2005.07.005
216
M.K. Brady et al. / Journal of Retailing 81 (3, 2005) 215–230
els of service evaluation processes (e.g., Fornell, Johnson, Anderson, Cha, & Bryant 1996; Heskett, Jones, Loveman, Sasser, & Schlesinger 1994). There are numerous examples of service evaluation models that include these five core constructs (e.g., Athanassopoulos 2000; Bolton & Drew 1991; Chenet, Tynan, & Money 1999; Cronin, Brady, & Hult 2000; Fornell et al. 1996; Ostrom & Iacobucci 1995). While there is some agreement about how these constructs relate to each other, there is very little agreement about how service quality, sacrifice, value, and satisfaction collectively relate to behavioral intentions and other outcome measures. Moreover, there is little effort made to resolve the discrepancies in the relationships between these critical “drivers” of service evaluations. Thus, no one of the models suggested to date can be viewed as more generalizable than the others. This is unfortunate because attempts to develop more complex models of the service evaluation process are being undertaken without this knowledge (e.g., Johnson, Anderson, & Fornell 1995; Johnson, Gustafsson, Andreassen, Lervik, & Cha 2001; Oliver 1997). It was recently suggested that services research is now ready to embark upon a new phase that reflects the maturity or “commoditization” of many service industries (Pine & Gilmore 1998). There is a similar push to advance service evaluation models (Johnson et al. 2001). Much of the new research in conceptualizing service evaluations is directed toward resolving specification errors. There is evidence that constructs such as equity, disconfirmation, and affective commitment influence service evaluations (Fornell et al. 1996; Johnson et al. 2001; Oliver 1997). However, in the absence of widespread agreement as to the nature of the relationships among the constructs investigated here, much of this research may be premature. In this paper, our aim is to elucidate a standard conceptual service evaluation model using a thorough empirical analysis of several currently recognized models. Because this involves uncovering the most robust of a collection of competing models, all of which have support in the literature, we will test and compare these models in two major studies, with a view to maximizing external validity. The studies will assess all the models in terms of their appropriateness and fit across a range of demanding conditions that reflect extremes of national business environment, industry type, and temporal setting. We first draw on the literature to specify four plausible and competing models of the service evaluation process. We then comparatively analyze the models to identify the most externally valid conceptual structure of the five constructs using consumer samples from five diverse countries (Australia, China/Hong Kong, Morocco, the Netherlands, and the United States). To extend our assessment of external validity, we also assess the models within a range of service settings using a second data sample from the United States. Lastly, resultant findings are discussed with regard to their scholarly and managerial implications.
Conceptual background A number of both national and international customer satisfaction barometers or indices have been introduced in the last decade. For the most part, these satisfaction indices are embedded within a system of cause and effect relationships or satisfaction model. Yet there has been little in the way of model development. Of critical importance to the validity and reliability of such indices is that the models and methods used to measure customer satisfaction and related constructs continue to learn, adapt, and improve over time. Johnson et al. (2001), p. 217. The above quotation highlights two critical points. First, as addressed in the present paper, there exists a critical need for a clearer understanding of service evaluation models. Second, the quotation reveals how models of the service encounter can be oriented around specific constructs. For example, while other scholars have emphasized the direct effects of service quality and value on behavioral intentions, research by Johnson et al. (2001) portrays satisfaction alone as playing this role. While this latter conceptualization might accurately reflect some service evaluations, it may be too parsimonious and lack external validity in other contexts. In general, the literature supports the view that variables in addition to satisfaction play key direct roles in shaping consumers’ service evaluations. In this paper, we seek to extend understanding of how customers evaluate service encounters by comparatively analyzing a collection of theoretically and empirically plausible models that portray various configurations of antecedents to behavioral intentions. The models The importance of the five investigated constructs is evident in the size of the research streams devoted to studying them. Some of this research is focused on only a particular construct (e.g., Parasuraman et al. 1988; Yi 1990), but analyses that include several of these constructs are far more common (e.g., Bitner & Hubbert 1994; Bolton & Lemon 1999; Heskett et al. 1994; Ostrom & Iacobucci 1995). In the latter case, the constructs are arranged in a conceptual model wherein theory and empirical analysis drive the specified relationships. A review of these models suggests that there is similarity in how some of the relationships are specified, yet there is also considerable dissimilarity with respect to other relationships. We begin with a discussion of the theory driving the consistent relationships and then turn to a discussion of the disparity. The relationships among the five investigated constructs that are consistently modeled in the literature have to do with the antecedents of value. Theory and research on value integration suggest that service value is determined by the difference between gains and losses or, in the case of services, the difference between service quality and sacrifice (Sirohi, McLaughlin, & Wittink 1998; Sweeney, Soutar, & Johnson 1999; Zeithaml 1988). Service evaluation models
M.K. Brady et al. / Journal of Retailing 81 (3, 2005) 215–230
that include service value are therefore consistent in modeling service value in this way. Sacrifice is specified as antecedent to value, which accounts for the “loss” side of the value integration process. Similarly, service quality is also specified as antecedent to value, but as the “gain” side of value integration. Taken together, there are consistent and direct relationships between sacrifice, service quality, and value. There is less agreement, however, on the intervening mechanisms that lead to behavioral intentions, with particular disparity regarding the antecedent relationship of service quality and satisfaction. Some service evaluations models (e.g., Bitner 1990; Bolton & Drew 1991) specify satisfaction as antecedent to service quality based on the premise that service quality is a general evaluation similar to an attitude, and therefore is superordinate to satisfaction. However, other service evaluation models (e.g., Anderson & Fornell 1994; Anderson et al. 1994; Anderson & Sullivan 1993; Gotlieb, Grewal, & Brown 1994) follow the appraisal-response-coping sequence (Lazarus 1991) or the cognitive-emotive causal order (Oliver 1997), which position satisfaction as superordinate to service quality. Thus, specification of the relationship between service quality and satisfaction has been debated and therefore both positions will be investigated here. Additional dissimilarity in service evaluation models emerges when outcome measures (e.g., behavioral intentions) are added to the models. Theory and empirical evidence support an antecedent link to behavioral intentions from all three of service quality, service value, and satisfaction (e.g., Chang & Wildt 1994; Fornell et al. 1996; Zeithaml et al. 1996). However, it is rarely the case that all three direct links are specified. It is much more common that one construct is presented as the locus of service evaluation models. Moreover, the construct selected as the central mediator or “lens” tends to be congruent with the context of the research. For example, if the focus of the research is satisfaction, links to behavioral intentions tend to be mediated by satisfaction (e.g., Andreassen 1998; Chenet et al. 1999; Fornell et al. 1996; Patterson & Spreng 1997). Similar mediating conceptualizations can be found in the value and service quality literatures (e.g., Athanassopoulos 2000; Chang & Wildt 1994; Sirohi et al. 1998; Sweeney et al. 1999; Wakefield & Barnes 1996). This has resulted in several competing conceptualizations of service evaluations (see Fig. 1) that differ primarily in the respective constructs positioned as the key drivers of behavioral intentions. It has also resulted in ambiguity concerning the appropriate conceptual structure of service evaluation models that include the five constructs. The specification of the four models draws from contemporary attitude theory, which is the theoretical basis for each model. One of the goals of attitude theory is to determine how attitudes drive intentions. Several theories exist, but the theory of reasoned action (Ajzen & Fishbein 1980) is perhaps the most prominent contemporary attitude theory. The theory of reasoned action suggests that intentions are the direct outcome of attitude (and subjective norms) such that there
217
are no intervening mechanisms between the attitude and the intention. More recent work in attitude theory (e.g., Bagozzi 1992), however, challenges this perspective and contends that attitude theories “trade specificity for parsimony” (Bagozzi 1992, p. 201), meaning that there may be other potential links to intentions that are not included in the theory of reasoned action. Bagozzi (1992) recommends refining attitude theory to consider intervening mechanisms that may better explain intentions. A similar course is followed in the service literature with respect to the specification of service evaluation models. Service evaluation models tend to be parsimonious in terms of the relationships leading to behavioral intentions, and this view has been challenged (Cronin et al. 2000). Most service evaluation models specify a single variable that leads to behavioral intentions and that also acts as an intervening variable for the effects of the other constructs in the model. An example of such a model is the “satisfaction model” (e.g., Fornell et al. 1996) depicted in Fig. 1. The satisfaction model specifies satisfaction as a central mediating variable such that the effects of service quality, sacrifice, and value on behavioral intentions are mediated by satisfaction. The rationale for such a model is, since satisfaction is primarily an affective variable whereas quality and value are cognitive evaluations (Oliver 1997), a direct link to intentions is justified by theoretical models that specify a cognition-affect causal ordering (e.g., Bagozzi 1992; Lazarus 1991). That is, satisfaction is positioned as an affective-oriented mediator that follows from quality and value evaluations. There is little argument that satisfaction influences behavioral intentions. The primary point of contention in service evaluation models is whether satisfaction directly affects behavioral intentions and whether it is the only direct effect, as is specified in the satisfaction model. Indeed, there are competing service evaluation models that specify value as the central construct so that all paths to behavioral intentions are mediated by value. These value-centric models appear in the value literature (e.g., Chang & Wildt 1994; Grewal, Monroe, & Krishnan 1998) and contend that value is the lone direct determinant of behavioral intentions. There are also models in the service quality literature that position service quality in the central mediating role (e.g., Zeithaml et al. 1996). The direct effects of value and service quality in the latter two models are theoretically justified with attitude theory (e.g., Fishbein & Ajzen 1975), since value and service quality are similar to an attitude (Parasuraman, Zeithaml, & Berry 1985) and attitude theory suggests a direct link between attitude and intentions. The result of this discourse is that there are several theoretically justified service evaluation models that are encountered in the literature and there is no agreement on which is the most appropriate model. We identify four competing service evaluation models that are commonly used to depict the antecedents to behavioral intentions (see Fig. 1). The models are named according to their specifications and according to the literatures in which they are encountered. The first
218
M.K. Brady et al. / Journal of Retailing 81 (3, 2005) 215–230
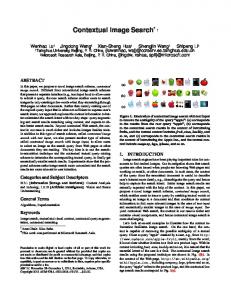
Fig. 1. Four service evaluation models. Descriptions—SAC: sacrifice; SQ: service quality; SAT: satisfaction; VAL: value; and BI: behavioral intentions.
model, the “value” model, positions value as the central mediating construct. It is conceptually similar to service evaluation models that appear in the value literature (e.g., Chang & Wildt 1994; Gale 1994; Parasuraman & Grewal 2000; Sirohi et al. 1998; Sweeney et al. 1999; Wakefield & Barnes 1996). The second “service quality” model positions service quality as a central driver of behavioral intentions. It is similar to the service evaluation models identified in the service quality literature (e.g., Athanassopoulos 2000; Boulding, Kalra, Staelin, & Zeithaml 1993; Lee & Cunningham 2001; Zeithaml et al. 1996). The third conceptualization is the “satisfaction” model and is similar to models that position satisfaction as the key determinant of behavioral intentions (e.g., Anderson & Fornell 1994; Andreassen 1998; Clow & Beisel 1995; Fornell et al. 1996; Hallowell 1996; Heskett et al. 1994; Mohr & Bitner 1995). The fourth “comprehensive” model adopts a different stance that is in line with Bagozzi’s (1992) comments about specificity in attitude models. The comprehensive model specifies that service quality, service value, and satisfaction are all directly related to behavioral intentions and is therefore similar to service evaluation models that specify multiple direct links to behavioral intentions (e.g., Anderson & Sullivan 1993; Cronin et al. 2000). It is comprehensive in the sense that all three of service quality, value, and satisfaction are suggested to influence behavioral intentions directly and jointly.
A multinational setting The first set of analyses presented here is conducted within a multinational setting using samples from five diverse countries. The recent growth in the importance of services in international markets highlights the need for a cross-national investigation of the variables and the relationships that are the focus of our study (e.g., Hult 1999). This growth is due largely to the globalization of markets, declining trade barriers, and the emergence of modern information technologies that facilitate cost-effective international services operations (Fisk 1999; Knight 1999). Despite this trend and the growing role of the international-services trade, research in this area is sparse. Of the few studies that have examined international services issues, most are related to “traditional” international business topics such as mode of entry (e.g., Erramilli 1990, 1991), trade barriers (e.g., Dahringer 1991), cultural issues (e.g., Stauss & Mang 1999), and the role of services in different world regions (e.g., Kassem 1989). However, no study has examined relationships among key elements of service evaluations and their linkage to behavioral intentions in a broad range of national settings. This is an important gap because findings from research conducted in a range of national settings tend to have higher reliability and external validity than findings from single-country studies.
M.K. Brady et al. / Journal of Retailing 81 (3, 2005) 215–230
The four models are comparatively analyzed in samples from Australia, Hong Kong, Morocco, the Netherlands, and the United States. With the exception of Morocco, all of these represent developed countries. Although consumers in developed countries may view services somewhat differently from those in developing countries, it is not our intention to predict the effect of economic conditions or other nation-level factors on the linkages and models investigated here. The purpose of testing the models across five country settings is to assess external validity of the models investigated and to assess the costs and benefits of specifying service evaluation models through the “contextual lens” of a particular study. The service setting One of the initial contributions of service research was to distinguish service products from physical goods (e.g., Zeithaml, Parasuraman, & Berry 1985). Four distinguishing characteristics were identified that refer to elements such as the intangibility, inseparability, and variability of service products. Classification schemes across service industries also have been developed that recognize the relative presence of these characteristics within service industries (e.g., Lovelock 1983). That is, while services are generally intangible, some service products are more intangible than others. Similarly, most services require interaction between the service provider and customers, but this is more prevalent in professional services than in convenience services such as fast food restaurants. It is possible that the processes that govern service evaluations are different depending on the nature of the service investigated. Thus, the models are analyzed using data from a range of service industries. Fast food and retail grocery stores represent services with prevalent tangible products involved in the exchange, which require little interaction between buyer and seller, and that have relatively little variability. Airlines and physicians represent services that are less tangible, with more interaction required, and that have more variability in the service delivered. The temporal setting A third contingency that may influence the conceptual structure of the four models is the temporal setting of a service encounter. It is believed that alternative processes may apply depending on whether a service exchange is viewed at the global level or in reference to a specific service encounter (Oliver 1997). An implication is that the key drivers of behavioral intentions may change depending on whether a service provider is assessed across all experiences or just the last or present experience. For example, it is suggested that the relationship between service quality, satisfaction, and behavioral intentions is contingent on temporal setting (Oliver 1997). In an encounter-specific setting, prior research demonstrates that satisfaction mediates the relationship between service quality and behavioral intentions (i.e., sq → sat → bi; Gotlieb et al. 1994). Theory suggests that the opposite order
219
(i.e., sat → sq → bi) may apply in global settings, although this has not been tested (Oliver 1997). A temporal assessment that includes other key service evaluation constructs (i.e., sacrifice and service value) has also not been reported. The four models are therefore comparatively analyzed in both encounter-specific and global temporal settings.
Methods Two studies were used to test external validity of the four models within the diverse settings described above. The first study was aimed at testing the models across a diverse sample of countries and the second study varied the service and temporal settings in samples obtained from U.S. service customers. Study 1 For the multinational samples, the four models were assessed in a global temporal setting (i.e., respondents were directed to consider all of their experiences with the restaurant or store) using samples from fast food restaurants and retail grocery stores in each of five countries: Australia, Hong Kong (a territory of China), Morocco, the Netherlands, and the United States. These particular countries were chosen because they provide a considerable degree of variety in terms of national conditions related to cultural, economic, and political circumstances (e.g., World Bank 2000). According to Hofstede’s (1980) classification of countries based on cultural dimensions (power distance, uncertainty avoidance, individualism, and masculinity), large-scale differences exist among these dimensions across the countries. In addition, substantial variations in competitive conditions, economic systems, and political/legal environments are prevalent among these countries and they represent Asia, Europe, and North America, which are the three most significant world regions in terms of their roles in international trade. The fast food and retail grocery stores industries were selected as the venues for the study because these services are familiar to, and used for the same purposes by, consumers in the five countries (cf. Douglas & Craig 1983; Kumar 2000). Trained marketing researchers were used to develop the surveys in all the countries and to collect the data. Professional marketing research firms were used to conduct the studies in Morocco, and professional colleagues were employed for this purpose in Australia, Hong Kong, the Netherlands, and the United States. Initially, an Englishlanguage questionnaire was created and pretested among a sample of 100 graduate students native to the countries sampled. Following minor refinements, the foreign-language versions of the questionnaires were then developed using appropriate methods (Douglas & Craig 1983; Kumar 2000). For example, in creating the Chinese version, the instrument was first translated by a native Chinese professional translator and reviewed for linguistic and functional equivalence. The
M.K. Brady et al. / Journal of Retailing 81 (3, 2005) 215–230
220
Measurement
resulting questionnaire was then back translated into English by a bilingual whose native language is English. Next, the Chinese version was refined so that it was comprehensible to the native, while being equivalent in both languages. The other foreign-language questionnaires were created in a similar fashion. Throughout, great care was taken to ensure that the English and foreign-language versions were functionally and semantically equivalent (Douglas & Craig 1983; Kumar 2000).
A nine-point Likert-type response format ranging from “strongly disagree” to “strongly agree” was used for all indicators in an effort to maximize respondent specificity, as opposed to employing the more commonly used five or sevenpoint response format (cf. Fornell 1992; Kumar 2000). The measures used to assess the five constructs are presented in Appendix A. The service quality construct (“SQ” in Fig. 1) has been the subject of much discussion and debate (e.g., Brady & Cronin 2001; Cronin & Taylor 1992; Parasuraman, Zeithaml, & Berry 1994). However, in light of the need to predict behavioral intentions, the predominant view supports the use of performance perceptions when measuring service quality (Brady, Cronin, & Brand 2002; Cronin & Taylor 1992; Parasuraman et al. 1994). Because of the need to ensure construct and measurement equivalence across the multinational settings, it was especially important to use a broad range of scale items that are applicable across the five countries, while keeping the items to a manageable number. As such, we used a 10-item service quality scale based on Parasuraman et al. (1985) 10 original dimensions of service quality (items 1–10 in Appendix A). Similar scales are used by Gotlieb et al. (1994), Hartline and Ferrell (1996), and Voss, Parasuraman, and Grewal (1998). The perceived service value construct (“VAL”) was devised in light of Zeithaml’s (1988) “get versus give” and Grewal et al. (1998) “net gain” definitions. We used three appropriate indicators to measure value across national cultures (items 11–13). The items are similar to those used by Sweeney et al. (1999) and Sirohi et al. (1998). Consumer satisfaction (“SAT”) has received considerable attention in the literature (cf. Giese & Cote 2000; Yi 1990) in light of its strong effect on behavioral intentions (e.g., Anderson & Fornell 1994; Anderson & Sullivan 1993; Fornell 1992). In order to capture both the evaluative and emotion-based qualities of satisfaction (Oliver 1997), we
Study 2 To assess the models in varied service settings, the survey used in Study 1 was reworded to apply to airlines and physicians services, and was administered to a sample of service consumers in the United States. The global temporal setting was maintained and the wording was adjusted to reflect the new industries. For example, a satisfaction question in the airline survey was “I am happy with the service I receive at this airline” (see Appendix A). To investigate conceptual distinctions associated with temporal setting, the global surveys used in the fast food and grocery store samples in Study 1 were reworded to reflect an encounter-specific temporal setting. Specifically, items were reworded to the past tense and respondents were specifically directed to only consider their last encounter. The surveys were then distributed to a sample of U.S. fast food and retail grocery store consumers. The sample sizes and demographic characteristics for both studies are presented in Table 1. All respondents were self-selected using the mall intercept method (Bush & Hair 1985), but were disqualified if they had not had a grocery or fast-food service encounter during the previous month (Study 1) or an airlines or physicians service encounter within the previous three months (Study 2). This ensured that respondents’ memories of the service encounters would be recallable and reliable. Additionally, each respondent participated in a survey on only one of the industries.
Table 1 Samples demographicsa Sample
Age
(n)
50
Education
21–30
31–40
Male
Female
Elem.
HS
College
Overall Study 1
1138
5.8
60.5
19.6
9.1
5.0
50.4
49.6
7.3
24.3
68.4
Australia Hong Kong Morocco The Netherlands USA
234 198 242 207 257
0 3.6 17.6 4.8 2.8
59.0 96.4 23.0 53.1 77.7
38.5 0 17.6 31.4 10.4
2.6 0 30.1 6.8 4.8
0 0 11.8 3.8 4.4
51.7 36.5 48.5 59.8 59.0
48.3 63.5 51.5 40.2 41.0
0 2.5 22.0 4.8 0
6.0 13.2 20.8 39.6 42.3
94.0 84.3 57.2 55.6 57.7
Overall Study 2
329
18.1
22.5
21.4
32.6
5.4
47.1
52.9
24.5
53.2
22.3
n: Sample size; 50: percentage of respondents age 51 and older; male: percentage of males in the sample; female: percentage of females in the sample; Elem.: percentage of respondents having completed elementary school; HS: percentage of respondents having completed high school; college: percentage of respondents having completed college. a Descriptions.
M.K. Brady et al. / Journal of Retailing 81 (3, 2005) 215–230
221
good service are suggested to have customers who are loyal, will recommend the service, and say positive things about the provider. In assessing behavioral intentions, we used measures related to these factors (items 20–23). Following data collection in both studies, all scales were subjected to a purification process involving a series of dimensionality, reliability, and validity assessments (Anderson & Gerbing 1988). The psychometric properties of the five constructs were evaluated via confirmatory factor analysis (CFA) using LISREL. All the items were included in the analysis and the observed variables were restricted to load on their respective latent factors. Results of the refined scales are presented in Tables 2 and 3. The model fits were evaluated using the comparative fit index (CFI) and the root mean square error of approximation (RMSEA). The chi-square statistic with corresponding degrees of freedom was also included in order to compare the various models (Anderson & Gerbing
employed two kinds of satisfaction indicators. The “evaluative” satisfaction indicator (item 14 in Appendix A) is based on Oliver’s (1997) satisfaction measures, and the emotionbased measures (items 15–16) are derived from the work of Westbrook and Oliver (1991). Sacrifice (“SAC”) is defined as that which is given up or sacrificed to acquire a service. This is consistent with the definitions of Heskett, Sasser, and Hart (1990) and Zeithaml (1988), as well as the multidimensional conceptualizations offered in the literature (e.g., Dodds, Monroe, & Grewal 1991; Zeithaml 1988). The construct was measured using items that reflect consumers’ perceptions of the monetary and non-monetary costs of obtaining and using a service (items 17–19). Finally, the measure for behavioral intentions (“BI”) is based on the work of Zeithaml, Berry, and Parasuraman (1996). Their study identifies several factors as outcomes of a positive service exchange. Service providers that deliver Table 2 Intercorrelations of study variables in Study 1 and Study 2 Items
SQ1
SQ2
SQ3
SQ4
SAT1
SAT2
SAT3
VALUE1
VALUE2
VALUE3
SAC1
SAC2
BI1
BI2
BI3
(n = 1138)a
Study 1 SQ1 SQ2 SQ3 SQ4 SAT1 SAT2 SAT3 VALUE1 VALUE2 VALUE3 SAC1 SAC2 BI1 BI2 BI3
1.00 74 66 77 66 67 .63 .48 .43 .46 .38 .32 .39 .55 .53
1.00 .72 .73 .70 .69 .61 .47 .38 .41 .31 .29 .39 .55 .52
1.00 .70 .68 .63 .55 .42 .35 .38 .31 .30 .36 .56 .52
1.00 .66 .66 .58 .48 .40 .44 .36 .37 .41 .57 .56
1.00 .86 .73 .51 .48 .48 .41 .39 .45 .67 .63
1.00 .84 .56 .52 .56 .42 .40 .43 .69 .65
1.00 .58 .52 .54 .36 .31 .42 .64 .62
1.00 .75 .76 .36 .31 .51 .60 .59
1.00 .81 .37 .35 .48 .57 .57
1.00 .45 .37 .49 .59 .58
1.00 .62 .31 .40 .39
1.00 .29 .44 .42
1.00 .71 .71
1.00 .86
1.00
Mean SD
5.37 1.92
5.22 1.85
5.83 1.91
5.51 1.86
5.96 1.78
5.63 1.95
4.94 2.11
5.48 1.88
5.47 1.86
5.40 1.81
5.83 1.91
6.06 1.75
5.40 2.22
5.72 1.85
5.62 2.01
Study 2 (n = 339)a SQ1 1.00 SQ2 .77 SQ3 .73 SQ4 .80 SAT1 .74 SAT2 .75 SAT3 .76 VALUE1 .57 VALUE2 .45 VALUE3 .53 SAC1 .42 SAC2 .43 BI1 .56 BI2 .69 BI3 .62
1.00 .83 .69 .72 .72 .73 .49 .42 .48 .36 .39 .56 .69 .62
1.00 .73 .72 .73 .72 .50 .41 .46 .35 .41 .50 .65 .59
1.00 .69 .69 .65 .51 .46 .42 .39 .41 .50 .64 .58
1.00 .96 .87 .66 .54 .61 .46 .49 .66 .82 .78
1.00 .90 .66 .53 .61 .47 .50 .66 .83 .77
1.00 .63 .52 .60 .44 .45 .65 .78 .71
1.00 .81 .82 .45 .38 .55 .66 .63
1.00 .90 .45 .37 .49 .56 .53
1.00 .45 .41 .55 .61 .57
1.00 .77 .40 .48 .49
1.00 .41 .52 .49
1.00 .83 .76
1.00 .88
1.00
6.91 2.40
7.60 2.29
7.09 2.30
7.35 2.38
7.18 2.44
6.68 2.65
6.92 2.18
6.74 2.18
6.75 2.25
6.49 2.34
6.77 2.25
6.80 2.62
7.16 2.47
7.18 2.57
Mean SD
6.88 2.41
a All intercorrelations are significant at the p