The Astrophysical Journal, 804:42 (6pp), 2015 May 1
doi:10.1088/0004-637X/804/1/42
© 2015. The American Astronomical Society. All rights reserved.
REVISITING THE ISN FLOW PARAMETERS, USING A VARIABLE IBEX POINTING STRATEGY T. W. Leonard1, E. Möbius1, M. Bzowski2, S. A. Fuselier3,4, D. Heirtzler1, M. A. Kubiak2, H. Kucharek1, M. A. Lee1, D. J. McComas3,4, N. A. Schwadron1, and P. Wurz5
1
University of New Hampshire, Space Science Center & Department of Physics, Durham, NH 03824, USA;
[email protected],
[email protected],
[email protected],
[email protected],
[email protected],
[email protected] 2 Space Research Centre of the Polish Academy of Sciences, Warsaw, Poland;
[email protected],
[email protected] 3 Southwest Research Institute, San Antonio, TX 78228, USA;
[email protected],
[email protected] 4 University of Texas at San Antonio, San Antonio, TX 78249, USA;
[email protected] 5 Physikalisches Institut, Universität Bern, 3012 Bern, Switzerland;
[email protected] Received 2014 November 12; accepted 2015 February 15; published 2015 April 29
ABSTRACT The Interstellar Boundary Explorer (IBEX) has observed the interstellar neutral (ISN) gas flow over the past 6 yr during winter/spring when the Earth’s motion opposes the ISN flow. Since IBEX observes the interstellar atom trajectories near their perihelion, we can use an analytical model based upon orbital mechanics to determine the interstellar parameters. Interstellar flow latitude, velocity, and temperature are coupled to the flow longitude and are restricted by the IBEX observations to a narrow tube in this parameter space. In our original analysis we found that pointing the spacecraft spin axis slightly out of the ecliptic plane significantly influences the ISN flow vector determination. Introducing the spacecraft spin axis tilt into the analytical model has shown that IBEX observations with various spin axis tilt orientations can substantially reduce the range of acceptable solutions to the ISN flow parameters as a function of flow longitude. The IBEX operations team pointed the IBEX spin axis almost exactly within the ecliptic plane during the 2012–2014 seasons, and about 5° below the ecliptic for half of the 2014 season. In its current implementation the analytical model describes the ISN flow most precisely for the spin axis orientation exactly in the ecliptic. This analysis refines the derived ISN flow parameters with a possible reconciliation between velocity vectors found with IBEX and Ulysses, resulting in a flow longitude λ∞ = 74◦. 5 ± 1◦. 7 and latitude β∞ = −5◦. 2 ± 0◦. 3, but at a substantially higher ISN temperature than previously reported. Key words: ISM: atoms – ISM: kinematics and dynamics – methods: data analysis – Sun: heliosphere – solar neighborhood 1. INTRODUCTION
distribution by detecting the sputtered charged particles from a lithium fluoride-coated surface, and thus provided the most detailed and only direct access to the velocity distribution of the interstellar neutrals prior to IBEX. A combination of all three observation methods was compiled in Möbius et al. (2004) and resulted in a consistent set of ISN He parameters for all data published prior to that date. Surprisingly, the analysis of the early IBEX observations of the ISN He flow in 2009 and 2010 with two separate analysis techniques indicated a somewhat different ISN He parameter set than the previous neutral gas observations with Ulysses GAS (Witte 2004). The two separate analysis techniques included an analytical model (Lee et al. 2012) of the ISN flow used in Möbius et al. (2012) and a test particle simulation code in Bzowski et al. (2012). The IBEX viewing geometry causes a coupling between the resulting flow direction, relative speed, and temperature of the ISN He such that flow latitude, speed, and temperature can be determined as functions of the flow longitude. This dependency causes a coupling of these values along a narrow tube in the four-dimensional (4D) ISN He flow parameter space. Both analysis techniques identified very similar 4D ISN He parameter tubes, and the small discrepancy between them was resolved by McComas et al. (2012), who provide the best combined results. This resulting parameter tube included the best fit Ulysses results, either with a similar temperature at a different ISN flow vector, or a similar flow vector with a much higher temperature. Recently, the temporal evolution of the interstellar flow over the last 40 yr was addressed by Frisch et al. (2013) and
Our Sun is immersed in a local galactic environment that is composed of a warm, dilute, and partially ionized gas, e.g., Frisch et al. (2009). Due to the Sun’s motion relative to this environment, the interstellar neutral (ISN) gas flows through the heliosphere provide the opportunity to perform in situ observations of the ISN gas from within it. The interaction of the surrounding interstellar medium with the heliosphere and the characteristics of the ISN flow into the inner solar system have been described in numerous modeling studies, e.g., (Fahr et al. 2000; Zank and Müller 2003; Alexashov & Izmodenov 2005; Müller et al. 2008; Zank et al. 2009). The ISN He flow has been studied using multiple observation techniques in the inner heliosphere, starting with backscattering of solar ultraviolet (UV) radiation (e.g., Weller & Meier 1974; Lallement et al. 2004; Vallerga et al. 2004), followed by pickup ion analysis (Möbius et al. 1985; Gloeckler et al. 2004), and finally direct neutral gas imaging with Ulysses GAS (Witte et al. 1996; Witte 2004) and Interstellar Boundary Explorer (IBEX) (Möbius et al. 2009). The interstellar He flow velocity can be indirectly observed through Doppler dimming of the resonantly scattered solar UV radiation (Vallerga et al. 2004). In addition, the gravitational focusing cone of interstellar neutral He, which reflects the flow pattern of the gas through the inner heliosphere, can be analyzed through the increased density of He pickup ions (Möebius et al. 1995; Gloeckler et al. 2004). The Ulysses GAS instrument provided the first in situ observations of the ISN He atom flow 1
The Astrophysical Journal, 804:42 (6pp), 2015 May 1
Leonard et al.
Lallement & Bertaux (2014). The study by Frisch et al. (2013) included results from IBEX observations (Bzowski et al. 2012; Möbius et al. 2012), and thus the debate on potential interstellar flow time dependence will benefit from an improved determination of the ISN flow parameters. Several investigations into the difference between the Ulysses GAS and IBEX results have emerged, involving the reanalysis of past and previously unanalyzed Ulysses GAS observations (Bzowski et al. 2014; Katushkina et al. 2014; Wood et al. 2015). In particular, studies (Bzowski et al. 2014; Wood et al. 2015) based on data from the entire duration of the Ulysses mission, including the last, previously not analyzed observation season, found an ISN flow vector close to the previous results by Witte (2004) which remained stable over more than 12 yr, but the ISN He temperature was found to be higher than in the previous Ulysses analysis. A review of the IBEX observations and the resulting coupling of the ISN parameters along the narrow parameter tube is discussed in Möbius et al. (2015), reemphasizing that the IBEX observations lead to a substantially higher temperature than the Ulysses temperature reported by Witte (2004), when compared for any selected ISN flow vector. Finally, McComas et al. (2015) combine the results of the current study with the various reanalyses of GAS data and new analyses using the Warsaw Test Particle Model (WTPM) for the 2013 and 2014 data to propose the current best combined parameters of the ISN He flow, which are included in Table 2. The IBEX data set now contains 6 yr of ISN flow observations. In these, we have implemented a variety of spacecraft spin axis tilt orientations in order to substantially reduce the range of acceptable solutions to the ISN He flow parameters determined in the IBEX mission. Möbius et al. (2015) describe how varying the IBEX spacecraft spin axis pointing is used in 2014 and subsequent years to optimize the determination of the ISN flow vector. In this paper, we study the influence of the spin axis orientations on the ISN flow vector determination and find that in the current implementation of the analytical model, the ISN flow is most accurately described with the spin axis orientated within the ecliptic plane. As a consequence, we present ISN He flow parameters determined from a selection of IBEX observations for which the IBEX spin axis is constrained to within ±0◦. 07 or alternatively ±0◦. 2 of the ecliptic plane, incorporating about 35% of the available IBEX observations.
10–2000 eV in eight logarithmically spaced energy steps over a 7° FWHM field of view (FOV). After entering the instrument, the ENAs reflect off a diamond-like carbon conversion surface where a small fraction is converted to negative ions along with the production of sputtered ions. He neutral atoms do not produce stable negative ions and instead are detected through sputtered negative ions (H, C, and O) from the conversion surface (Möbius et al. 2009, 2012). An electrostatic analyzer filters the negative ions by energy/charge for different energy steps, and the resulting negative ions are accelerated into a triple coincidence time-of-flight (TOF) spectrometer. For each registered ion the energy step, TOF, and observation time information are stored with the condition that triple coincidence events are given the highest priority for storage. Within each energy step, the events identified as H and O are stored in angular histograms such that absolute rates can be calculated when the individual event storage limitations are exceeded by high rate sources, such as the ISN flow. The IBEXLo boresight is co-aligned with a star sensor to verify the pointing determined by the IBEX Star Tracker. The lookdirection of the IBEX-Lo collimator boresight relative to star positions has been demonstrated with star sensor observations to be better than 0◦. 1 by Hłond et al. (2012). 3. ISN FLOW ANALYSIS METHODS Complementary methods to simulate the ISN He flow have been developed for comparison with the IBEX-Lo observations, including an analytical model described in Lee et al. (2012) and a test particle simulation code in Bzowski et al. (2012). The analytical model uses analytical solutions of the interstellar atom trajectories to simulate the ISN flow observations at Earth orbit, concentrating on the first (flow vector) and second (temperature) moment of the distribution. It takes advantage of simplifications possible for observations of ISN atoms close to perihelion in their hyperbolic trajectories. In this study we focus on determining the ISN flow vector. As described in Möbius et al. (2012), we obtain the ecliptic longitude of the ISN flow maximum where the ISN bulk flow at 1 AU is most nearly aligned with Earth’s orbital motion in the first step of the analysis, which determines a unique relation between the ISN bulk flow speed (V∞) and flow longitude (λ∞) at infinity. Then we calculate the ISN flow distribution peak ecliptic latitude as a function of observer ecliptic longitude. We compare these results with the IBEX-Lo observations with a chi-squared minimization analysis, adjusting the ISN flow longitude (λ∞) and latitude (β∞). In this comparison, the variation of the ISN flow peak latitude as a function of ecliptic longitude is the observable that is most sensitive to the flow direction in the analytical model. In addition, the peak location is only minimally sensitive to the width or any wings of the distribution. The analytical model is based on Liouville’s Theorem with the assumption that the ISN He distribution is a drifting Maxwellian in the local interstellar medium. The implementation of this model for the flow distribution peak latitude as a function of longitude involves very few approximations. The latitude of maximum flow intensity in the solar reference frame during the winter/spring (when the collision between the ISN flow and IBEX is “head-on”) is represented by Ψ0, where
2. IBEX MISSION AND INSTRUMENTATION The IBEX mission (McComas et al. 2009b) was designed to observe heliospheric and interstellar energetic neutral atoms (ENAs) from a highly elliptical orbit around the Earth with minimal interference from a magnetosphere-related background. IBEX uses a spinning spacecraft and performs regular pointing maneuvers to align the spin axis with the Earth–Sun line at the beginning of each orbit or, after 2011 June, orbit arc (McComas et al. 2011). The IBEX payload consists of two cameras to observe ENAs, IBEX-Lo (Fuselier et al. 2009b) and IBEX-Hi (Funsten et al. 2009), both pointing perpendicular to the spin axis. The viewing geometry provides IBEX-Lo observations near the perihelion of the interstellar trajectories and allows for an analytical approach to modeling the interstellar gas flow described in Lee et al. (2012). IBEX-Lo observes the low-energy ENA spectrum in the range
Y0 = -b¯
2
(1)
The Astrophysical Journal, 804:42 (6pp), 2015 May 1
Leonard et al.
and tan b¯ = tan b¥ sin ( l ¥ + 180 - l ) ,
analytical model and perform a chi-squared minimization to the observations by adjusting the absolute analytical model curve, Y ¢0 + d Y ¢0 , thus obtaining the perihelion peak location. An adjustment to the analytical model curve of each orbit, which is represented by adding another small constant to Y ¢0 + d Y ¢0 , is required since we are starting from non-ideal initial conditions. However, once the initial conditions are optimized, the adjustment is re-evaluated. We found only small adjustments of the peak location from the initial model location in this fitting. The correction for the spacecraft velocity relative to the Earth is described in Möbius et al. (2012). Similar to Möbius et al. (2012), each orbit fit now provides an ISN flow distribution peak location at the perihelion of the interstellar atom trajectories, i.e., when εE = 0°. Using Equation (4) for dY ¢0 we normalized the perihelion peak locations to an average εZ of each data set and performed a chi-squared minimization, varying the λ∞ and β∞ input parameters in the analytical model. In an attempt to optimize the sensitivity of the IBEX observations and analysis to the ISN parameters, the IBEX operations team pointed the spin axis to an average of εZ = 0◦. 0, in the ecliptic plane during the 2012 and 2013 seasons, and the εZ target was set to −5◦. 0 for the 2014 ISN flow observation season. Special pointing maneuvers can only be performed when the Star Tracker is predicted to operate under optimal conditions. As a result 50% of the 2014 season contains special pointing orbits with an achieved average spin axis pointing of εZ = −4◦. 9, while the remaining orbits maintained an average of εZ = 0◦. 0. Consequently, in 2014 IBEX accumulated interspersed ISN observations with two different εZ values. The result of the multiple years of IBEX spin axis pointing operations is a data set containing three observation groups organized by εZ with the following averages: εZ = 0◦. 7 in 2009–2010, εZ = 0◦. 0 in 2012–2014, and εZ = −4◦. 9 in 2014. This diverse data set allows further testing and development of the analytical model while producing a more comprehensive analysis of the ISN flow parameters. In addition to the ISN flow and ENAs (Möbius et al. 2009) from the heliospheric boundary (Fuselier et al. 2009a; McComas et al. 2009a), the IBEX-Lo instrument observed many ENA sources outside the main scope of the mission including, but not limited to, ENAs produced within the Earth’s magnetosphere (Fuselier et al. 2010; Petrinec et al. 2011), and ENAs originating from the Moon (Rodríguez et al. 2012; Funsten et al. 2013). These observations indicate that such sources represent potential foreground signals for any heliospheric ENA study and the ISN flow analysis. Therefore, a careful study of the ISN flow angular distribution must exclude any known sources of potential interference from the observation times. Using the count rates outside of the angular range of the ISN flow distribution, the high count rate magnetospheric ENA times can be identified and excluded from the ISN flow observation times. Observation time periods when the Moon is in the IBEX FOV in the ISN flow direction are excluded from the ISN flow observation times based on the Star Sensor Moon observation timing commands and ephemeris data. IBEX-Lo is also subject to electron background counts that can be readily identified and eliminated based on their short TOF values, as discussed in Möbius et al. (2015). While this background typically only varies slowly and does not impact the ISN flow analysis, occasional time periods with excessive electron background count rates tend to impact the data throughput
(2)
with λ as the observer ecliptic longitude. For particles at perihelion, the Galilean transformation to the frame of reference of Earth’s orbital motion yields the latitude of maximum intensity (Y ¢0 ) as sin Y ¢0 = v0 sin Y0
(v
2 0
+ 2v0 cos Y0 + 1
12
)
,
(3)
where v0 is the atom speed in the frame of the Sun where peak intensity is achieved (see Equation (41) in Lee et al. (2012)) normalized to the average orbital speed of the Earth. Still, during each orbit the observed peak latitude changes with the spacecraft position and spin axis pointing as the IBEX-Lo FOV deviates from pointing directly at the ISN He perihelion trajectories. The main challenge for this study was the extension of the analytical model to comparisons including observations not exactly at perihelion. Section 6 of Lee et al. (2012) discusses how deviations from the perihelion of the ISN He trajectories during an orbit due to spacecraft spin axis tilt can be incorporated in the analytical model. Following Lee et al. (2012), we use εZ as the spin axis tilt angle out of the ecliptic plane and εE as the tilt away from the Earth–Sun line, exact Sun pointing, within the ecliptic plane. Keeping the spin axis orientation fixed after the regular pointing maneuvers causes the IBEX-Lo viewing direction to drift across the perihelion of the ISN He trajectories. Based on the known spacecraft orientation we can calculate a change in Y ¢0 as a function of λ d Y ¢0 =
vo2
(
vo2
-2
12
)
1 sin( ( vo + 1) l)
ì æ -1 ö ï ÷÷ ´ ( eZ cos Y ¢0 + eE sin Y ¢0) ï í ççç 2 ÷÷ ï ÷ø ç 1 v ï îè o ´ sin ( l - l ¥ - 180) 1 2ù ü é ï 2 ï ê vo vo - 2 ú ï ê ú cos 180 + l l ( ) ý ¥ 2 ê ú ï vo - 1 ú ï êë ï û ï þ
(
)
(4)
and notice that the εE term is small because both εE and Y ¢0 are small. The change in Y ¢0 is a fairly flat function over each orbit. To determine the peak latitude at the perihelion of the interstellar trajectories the observations within an orbit are divided into five equal accumulation times, restricted to good ISN flow observation times (described below). For each accumulation time we use a Maximum Likelihood Method to fit the angular distribution with a Gaussian function convoluted by the IBEX-Lo collimator function. Möbius et al. (2012) used a least-squares fit of the observations to determine the perihelion peak latitude for each orbit, i.e., when εE = 0°. As a substantial improvement, this study determines the perihelion peak location by using the dependence of the peak latitude on the observer longitude obtained from the analytical model with a second order perturbation expansion for the small spin-axis orientation away from exact Sun-pointing, as shown in Equation (4). For each orbit, we use the previously determined ISN flow parameter set in Möbius et al. (2012) as input to the 3
The Astrophysical Journal, 804:42 (6pp), 2015 May 1
Leonard et al. Table 1 Fit Results of the Three Observation Groups εZ(°) 0.7 0.0 −4.9
0.4 0.9 1.6
c˜ 2
λ∞(°)
β∞(°)
80.2 ± 1.8 74.9 ± 1.9 71.3 ± 2.1
−4.9 ± 0.3 −5.2 ± 0.3 −6.0 ± 0.5
substantially for the εZ = −4◦. 9 group, which demonstrates the benefit of adjusting εZ in past and future observations. The corresponding ISN flow vector fit results in Table 1 show that the λ∞ and β∞ fit parameters are different for each εZ group. As a consequence, this comparison of ISN flow observations with multiple spin axis orientations exposes a dependence on the spin axis tilt out of the ecliptic plane when using the current implementation of the analytical model for fitting the ISN flow longitude and latitude. As εZ is decreased from 0◦. 7 to −4◦. 9 the apparent λ∞ decreases from 78◦. 7 to 71◦. 7 and β∞ from −5◦. 0 to −6◦. 0. The reduced chi-squared value for the εZ = −4◦. 9 data set, which is substantially larger than the expected value close to or below unity, also demonstrates that the current implementation of the analytical model is not adequate for such a large spin axis tilt. Furthermore, since the 2014 observations include orbits with εZ = 0◦. 0 and εZ = −4◦. 9, we can safely rule out the possibility of such a large change in λ∞ and β∞ when comparing the εZ = 0◦. 0 and εZ = −4◦. 9 groups, and that these results must be an artifact of the current analysis method.
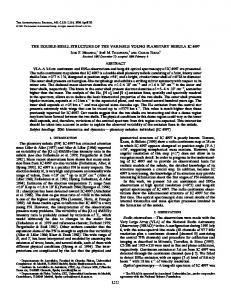
Figure 1. Comparison of three observation groups (2009–2010, 2012–2014, and 2014) with spin axis tilt (εZ) averages of 0◦. 7, 0◦. 0, and −4◦. 9, respectively. The data points show the ISN He flow distribution peak ecliptic latitude at the perihelion of the atomsʼ hyperbolic trajectories for each orbit and the lines are the analytical model fits.
and thus are eliminated based on TOF angular histogram data. The electron background count rates are monitored by observing the TOF histogram data outside the angular range of the ISN flow distribution to avoid the ISN flow signal. We have included a distributed background as one of the free parameters in the Maximum Likelihood fitting of the ISN distribution and found that on average the ISN distribution peak is over 450 times greater than the background, with a minimum of 125 times greater than the background. In addition, all ISN flow observation times are verified to have the most precise spacecraft pointing information. This data selection routine follows the same criteria as described in Möbius et al. (2012). In addition, we apply a restriction to the observer longitude such that there is negligible influence on the He ISN flow from the Warm Breeze (Kubiak et al. 2014) (orbits ⩾ 115° ecliptic longitude) and the H ISN flow (Saul et al. 2012; orbits ⩽ 160°).
5. TEST OF THE εZ DEPENDENCE WITH THE WTPM A set of simulated observations was created as described in Bzowski et al. (2012) to test the spin axis tilt dependency of the resulting ISN flow fit parameters for the current analytical model implementation. We treat the simulated ISN flow data for the key orbits in 2009 in the same manner as the IBEX-Lo observations and perform a chi-squared fit of the analytical model by varying the ISN flow longitude and latitude. Observations with a spacecraft spin axis tilt of εZ = 0◦. 7, 0◦. 0, and −4◦. 9 were simulated using the WTPM to best reflect the conditions of the actual IBEX-Lo observations. In this model, the tilt angle of the spin axis enters naturally into the numerical scheme and the case of εZ = 0 is not preferred or special in any way. Again, a trend among the fit parameters, ISN flow longitude (λ∞) and latitude (β∞), and spacecraft εZ emerges when using the simulated data. In Figure 2 the λ∞, top panel, and β∞, bottom panel, parameters are displayed for the three εZ values, with the IBEX observations as blue circles and the simulations as red squares. A similar trend between the resulting ISN parameters and εZ is seen for both the IBEX observations and the simulations. As εZ decreases, from pointing above the ecliptic plane to below the ecliptic, λ∞ decreases to smaller longitudes and β∞ decreases to further negative values. While the reduced chi-squared values from fitting the simulations are generally large, likely due to systematic differences between the two models, the minimum reduced chi-squared is found for the case without spin axis tilt, εZ = 0◦. 0, which demonstrates that the best fit is found when εZ = 0◦. 0. More importantly, the only case for which the fit parameters duplicate the simulation input parameters is the case with εZ = 0◦. 0. This finding agrees with the fact that for spin axis pointing within the ecliptic, εZ = 0◦. 0, the analytical expression of the ISN flow involves very few approximations and requires no expansion for the spin axis tilt
4. ANALYSIS OF THE IBEX-LO OBSERVATIONS As described in the previous section, we determine the peak location of the ISN He latitude distribution at the perihelion of the ISN He trajectories as a function of observer position. The orbits are organized by εZ into three groups with the following εZ averages: 0◦. 7 in 2009–2010, 0◦. 0 in 2012–2014, and −4◦. 9 in 2014, such that all orbits are within ±0◦. 2 of each group average. Using the expansion of the analytical model, all orbits within each group are normalized as if all observations were taken at the average εZ. This normalization results in small corrections due to the variation of εZ within each group. The perihelion peak locations are collected within each of the three groups of orbits for a chi-squared minimization relative to the analytical model by adjusting the ISN flow longitude (λ∞) and latitude (β∞) parameters in the model. The λ∞ and β∞ parameters are found for each of the three groups to examine how εZ influences the analytical model fit. Figure 1 shows the analytical model fit to each of the three groups of orbits organized by εZ, with the peak of the ISN flow in latitude as a function of observer location in longitude. The influence of εZ on these curves is noticeable in the difference between the εZ = 0◦. 7 and εZ = 0◦. 0 groups, but most 4
The Astrophysical Journal, 804:42 (6pp), 2015 May 1
Leonard et al.
Figure 3. Analytical model fits of IBEX-Lo observations restricted to spin axis tilt of εZ < ±0◦. 07 and εZ < ±0◦. 2. The data points show the ISN He flow distribution peak ecliptic latitude at the perihelion of the atoms hyperbolic trajectories for each orbit and the lines are the analytical model fits.
Figure 2. Results of using the current implementation of the analytical model to fit the WTPM simulations and the observation groups organized by spacecraft spin tilt (εZ). The top panel shows the resulting ISN flow longitude (λ∞) as a function of εZ while the bottom panel shows the flow latitude (β∞) with the fit results from Table 1 displayed as the blue circles and the results from fitting the WTPM simulations as the red squares. The dashed lines indicate the WTPM simulation input parameters.
out of the ecliptic plane (Lee et al. 2012). The comparison with the simulations confirms an εZ dependence for fitting the analytical model to the IBEX data. Therefore, the observations considered for the final optimization of the ISN flow parameters with the current implementation of the analytical model in this study are restricted to minimum εZ magnitude.
Figure 4. Reduced chi-squared surface of the ISN flow longitude (λ∞) and latitude (β∞) fit parameters in the analytical model fit to the εZ < ±0◦. 07 data set. The long minimum in λ∞ lies along the same narrow tube in 4D parameter space presented in McComas et al. (2012), red dashed line.
λ∞ = 75◦. 1 ± 1◦. 8 and β∞ = −5◦. 2 ± 0◦. 3. Figure 3 displays these two selections of observation data along with the resulting fits. The two data selections have indistinguishable fit results within their uncertainties, verifying that the result is robust and providing insight on how the fit parameters may be sensitive to the data selection. Figure 4 shows the reduced chisquared landscape for the fit to the εZ < ±0◦. 07 data set as a function of λ∞ and β∞ with the central curve of the parameter tube presented in McComas et al. (2012). The center of this parameter tube passes the chi-squared minimum within 0◦. 03 in β∞. We created a final set of ISN parameters, λ∞ = 74◦. 5 ± 1◦. 7 and β∞ = −5◦. 2 ± 0◦. 3, through a weighted average of the fit parameters and by combining the uncertainties of these two data selections, thus utilizing about 35% of the IBEX observations over the past 6 yr.
6. ISN FLOW PARAMETERS AFTER RESTRICTING IBEX OBSERVATIONS FOR SPIN AXIS TILT CLOSE TO 0° With 6 yr of IBEX-Lo observations it is possible to create a meaningful data set with multiple observation positions while restricting the spin axis tilt to the ecliptic plane. When the IBEX spin axis is in the ecliptic plane, εZ = 0◦. 0, the need to describe the spin tilt with an approximation vanishes from the current implementation of the analytical model provided that we use the observations at the time of Sun pointing of the spin axis in ecliptic longitude. We have created a data set by restricting εZ to the ecliptic plane, εZ < ±0◦. 07, and have performed multiple iterations of a chi-squared minimization with the analytical model. The input parameters in the fitting routine were adjusted after each iteration until the ISN fit parameters converged. This resulted in an ISN flow longitude λ∞= 74◦. 1 ± 1◦. 5 and latitude β∞ = −5◦. 2 ± 0◦. 2, with 1 sigma uncertainty. To test the robustness of this fit result the iterated fitting routine was repeated on a wider selection of data, εZ < ±0◦. 2, resulting in
7. DISCUSSION AND CONCLUSIONS Using the current implementation of the analytical model in the analysis of ISN flow observations with multiple spin axis 5
The Astrophysical Journal, 804:42 (6pp), 2015 May 1
Leonard et al. Table 2 Compilation of ISN Flow Vector Results
Publication Witte (2004) Möbius et al. (2012) Bzowski et al. (2012) McComas et al. (2012) Bzowski et al. (2014) Wood et al. (2015) Leonard et al. (2015) (this work) McComas et al. (2015)
vHe (km s −1)
λ∞(°)
β∞(°)
Spacecraft
26.3 ± 0.4 23.5 + 3.0(−2.0) 22.8 23.2 + 2.5(−1.9) 26.0 + 1.0(−1.5) 26.08 ± 0.21 27.0 + 1.4(−1.3) 26
75.4* ± 0.5 79.0 + 3.0(−3.5) 79.2 79.0 + 3.0(−3.5) 75.3 + 1.2(−1.1) 75.54 ± 0.19 74.5 ± 1.7 75
−5.2 ± 0.2 −4.9 ± 0.2 −5.1 −5.0 + 0.2(−0.1) −6.0 ± 1.0 −5.44 ± 0.24 −5.2 ± 0.3 −5
Ulysses IBEX IBEX IBEX Ulysses Ulysses IBEX IBEX
Note. *J2000 coordinates.
orientations out of the ecliptic plane (εZ), as shown in Equation (4), exposes a dependence of the resulting parameters on this spin axis tilt. A reduced chi-squared minimization of the analytical model with the εZ = −4◦. 9 observation group indicates that the current implementation of the analytical model is not adequate for a significant spin axis tilt out of the ecliptic plane. Furthermore, the alternating spin axis pointing of neighboring orbits in the 2014 season, 50% of the orbits at εZ = 0◦. 0 and 50% at εZ = −4◦. 9, eliminates the possibility of such a large change in the ISN flow longitude (λ∞) and latitude (β∞) when comparing the εZ = 0◦. 0 and εZ = −4◦. 9 groups. A comparison of the analytical model with the WTPM simulations for various spin axis orientations shows the best agreement in the case without spin axis tilt. The εZ = 0◦. 0 fit results in the minimum reduced chi-squared value and matches the initial conditions of the simulation. This result is understandable because the analytical model involves very few approximations and requires no expansion when observing the ISN flow at the perihelion of the atom trajectories. Meanwhile, we have identified the main reason for the dependence of the ISN flow parameters on εZ as the fact that in the expansion shown in Equation (4), the IBEX-Lo FOV has been treated as a delta function centered on the sensor boresight. A term that describes the integration over the actual collimator function enters the expansion in εZ, which is now being implemented into an updated version of the model for an ongoing analysis of all ISN flow observations. In this analysis we have taken advantage of the fact that about 35% of the IBEX ISN flow observations between 2009 and 2014 have been taken close to εZ = 0◦. 0, to obtain an analytical model fit to this selected data set. It results in a new parameter set on the previously determined narrow tube in the 4D parameter space, which couples the ISN He flow vector, relative speed, and temperature, and slides the location of the most probable ISN He flow parameters to λ∞ = 74◦. 5 ± 1◦. 7 and β∞ = −5◦. 2 ± 0◦. 3. The new ISN flow vector result is compiled along with the previous results from direct neutral atom observations and the combined result from McComas et al. (2015) in Table 2. The previous ISN flow vector determination from IBEX observations included a range of possible parameter sets, restricted to the narrow tube in 4D parameter space, with the Ulysses results at the edge of the parameter range. The new parameter set becomes more similar to the past results from the Ulysses observations, but with the added consequence of a much higher temperature (Möbius et al. 2015); this has a number of important consequences for the heliosphere’s interstellar interaction as discussed by McComas et al. (2015). Also, the new uncertainty range in
λ∞ has been reduced by a factor of two when compared with the 2012 IBEX results. We expect that the uncertainty ranges determined in this study can be further reduced with the inclusion of all IBEX data with varying εZ. This work was carried out under the IBEX mission, which is part of NASA’s Explorer Program. Support was also provided by the Polish National Science Center grant 2012-06-M-ST9-00455.
REFERENCES Alexashov, D., & Izmodenov, V. 2005, A&A, 439, 1171 Bzowski, M., Kubiak, M. A., Hłond, M., et al. 2014, A&A, 569, A8 Bzowski, M., Kubiak, M. A., Möbius, E., et al. 2012, ApJS, 198, 12 Fahr, H. J., Kausch, T., & Scherer, H. 2000, A&A, 357, 268 Frisch, P. C., Bzowski, M., Grün, E., et al. 2009, SSRv, 146, 235 Frisch, P. C., Bzowski, M., Livadiotis, G., et al. 2013, Sci, 341, 1080 Funsten, H. O., Allegrini, F., Bochsler, P., et al. 2009, SSRv, 146, 75 Funsten, H. O., Allegrini, F., Bochsler, P. A., et al. 2013, JGRE, 118, 292 Fuselier, S. A., Allegrini, F., Funsten, H. O., et al. 2009, Sci, 326, 962 Fuselier, S. A., Bochsler, P., Chornay, D., et al. 2009, SSRv, 146, 117 Fuselier, S. A., Funsten, H. O., Heirtzler, D., et al. 2010, GeoRL, 37, L13101 Gloeckler, G., Möbius, E., Geiss, J., et al. 2004, A&A, 426, 845 Hłond, M., Bzowski, M., Möbius, E., et al. 2012, ApJS, 198, 9 Katushkina, O. A., Izmodenov, V. V., Wood, B. E., & McMullin, D. R. 2014, ApJ, 789, 80 Kubiak, M. A., Bzowski, M., Sokół, J. M., et al. 2014, ApJS, 213, 29 Lallement, R., & Bertaux, J. L. 2014, A&A, 565, A41 Lallement, R., Raymond, J. C., Vallerga, J., et al. 2004, A&A, 426, 875 Lee, M. A., Kucharek, H., Möbius, E., et al. 2012, ApJS, 198, 10 McComas, D. J., Alexashov, D., Bzowski, M., et al. 2012, Sci, 336, 1291 McComas, D. J., Allegrini, F., Bochsler, P., et al. 2009, Sci, 326, 959 McComas, D. J., Allegrini, F., Bochsler, P., et al. 2009, SSRv, 146, 11 McComas, D. J., Bzowski, M., Frisch, P., et al. 2015, ApJ, in press McComas, D. J., Carrico, J. P., Hautamaki, B., et al. 2011, SpWea, 9, S11002 Möbius, E., Bochsler, P., Bzowski, M., et al. 2009, Sci, 326, 969 Möbius, E., Bochsler, P., Bzowski, M., et al. 2012, ApJS, 198, 11 Möbius, E., Bzowski, M., Chalov, S., et al. 2004, A&A, 426, 897 Möbius, E., Bzowski, M., Fuselier, S. A., et al. 2015, JPhCS, 577, 012019 Möbius, E., Hovestadt, D., Klecker, B., Scholer, M., & Gloeckler, G. 1985, Natur, 318, 426 Möebius, E., Rucinski, D., Hovestadt, D., & Klecker, B. 1995, A&A, 304, 505 Müller, H.-R., Florinski, V., Heerikhuisen, J., et al. 2008, A&A, 491, 43 Petrinec, S. M., Dayeh, M. A., Funsten, H. O., et al. 2011, JGRA, 116, A07203 Rodríguez, M. D. F., Saul, L., Wurz, P., et al. 2012, P&SS, 60, 297 Saul, L., Wurz, P., Rodríguez, D., et al. 2012, ApJS, 198, 14 Vallerga, J., Lallement, R., Lemoine, M., Dalaudier, F., & McMullin, D. 2004, A&A, 426, 855 Weller, C. S., & Meier, R. R. 1974, ApJ, 193, 471 Witte, M. 2004, A&A, 426, 835 Witte, M., Banaszkiewicz, M., & Rosenbauer, H. 1996, SSRv, 78, 289 Wood, B., Mueller, H.-R., & Witte, M. 2015, ApJ, in press (arXiv:1501.02725) Zank, G. P., & Müller, H.-R. 2003, JGR, 108, 1240 Zank, G. P., Pogorelov, N. V., Heerikhuisen, J., et al. 2009, SSRv, 146, 295
6