Int. J. Energy Technology and Policy, Vol. 2, Nos. 1/2, 2004
153
Riding down the experience curve for energy-efficient building envelopes: the Swiss case for 1970–2020 Martin Jakob and Reinhard Madlener CEPE – Centre for Energy Policy and Economics, Swiss Federal Institute of Technology, ETH Zentrum WEC C, CH-8092 Zurich, Switzerland E-mail:
[email protected] E-mail:
[email protected] Abstract: Energy efficiency potentials of building envelopes are significant and still largely untapped. Increasing concerns of policy-makers about non-sustainable energy use and climate change spur a growing research interest in this area. This paper fills part of the existing knowledge gap by focusing on experience curve aspects of energy efficiency measures that concern state-of-the-art insulation methods, materials, and windows. The analysis addresses some of the difficulties and peculiarities of applying the experience curve concept to energy efficiency technologies. We also report on some of the more general technological trends and dynamics of market diffusion of innovative energy conservation technologies for the building envelope. The results derived from historical data analysis point to significant techno-economic progress made over the last 30 years, and demonstrate the basic applicability, merits and limitations of the experience curve concept for energy policy design and impact analyses concerning building envelopes. We conclude from our analysis that, apart from the energy conservation potentials offered, building standards and labels can be important drivers for techno-economic progress, and that experience curves can provide some useful guidance for targeted and effective policy measures. Keywords: experience curve; building envelope; energy efficiency; policy design; energy paradox; technological diffusion. Reference to this paper should be made as follows: Jakob, M. and Madlener, R. (2004) ‘Riding down the experience curve for energy-efficient building envelopes: the Swiss case for 1970–2020’, Int. J. Energy Technology and Policy, Vol. 2, Nos. 1/2, pp.153–178. Biographical notes: Martin Jakob is a Researcher at CEPE working on potentials, co-benefits, techno-economic progress and marginal costs of energy efficiency measures. Further research fields are analysis and modelling of energy policy scenarios, including techno-economic potentials of renewable energies. Earlier, he was a Researcher at the Paul Scherrer Institute (PSI) in Villigen, Switzerland. Dr Reinhard Madlener is a Senior Energy Economist at CEPE. Before joining CEPE, he was Managing Director of the Institute for Advanced Studies and Scientific Research Carinthia in Klagenfurt, Austria. His main research interests lie in applied energy economics, the diffusion of innovative energy technologies, renewable and energy efficiency policy design and evaluation, decentralised energy supply, and socio-economic aspects of energy use.
Copyright © 2004 Inderscience Enterprises Ltd.
154
M. Jakob and R. Madlener
An earlier version of the paper was presented at the International Workshop ‘Experience Curves: A Tool for Energy Policy Analysis and Design’, IEA, Paris, 22–24 January 2003, and in revised form published in March 2003 as CEPE Working Paper No. 22 [1].
1
Introduction
Building envelopes bear significant and to a large extent still untapped energy efficiency potentials, which strongly depend on the prevailing climatic, socio- and techno-economic, institutional, and regulatory framework conditions. Given increasing political efforts to curb unsustainable energy demand levels, e.g. in order to reduce fossil fuel import dependence, local pollutant emission, and global greenhouse gas emission, these potentials become the focus of heightened interest both from researchers and policy-makers alike. While the scientific literature provides numerous papers from various disciplines that have focused on different aspects of energy-efficient buildings and related policy measures (see [1] for a brief overview), much less evidence can be found on the diffusion of energy efficiency technologies related to the building envelope in general, and experience curves in particular. The residential and service sectors alone account for more than 40% of the final energy consumption in the European Union [2] and in Switzerland [3]. The exploitation of the existing energy efficiency potentials hidden in building envelopes to a large extent comes at either no, or relatively low, additional direct costs (calculated as annualised or present value total costs of the investment minus energy cost savings). For instance, for Switzerland it has been estimated that based on standard net present value investment evaluation criteria, for existing buildings built prior to 1980 about 30% to 50% of the energy consumption could be conserved with measures considered as cost-efficient (reduction from 450 MJ/m2a to 250–300 MJ/m2a), and an approximate additional 20– 30% would come at low cost. For new buildings, an estimated 20–30% of the measures can be realised at low cost [3,4]. However, many barriers still exist that prevent a more rapid diffusion of energy efficiency technologies and thus the reaping of further experience curve gains, and even seemingly ‘no-regret’ (or ‘minimal regret’) options, i.e. options that are basically cost-efficient if judged by standard economic investment evaluation criteria, yet remain under-utilised (so-called ‘efficiency gap’ or ‘energy paradox’; e.g. [5]). A sound understanding of the prevailing barriers and drivers can, on the one hand, help to better understand the market and learning system involved and, on the other hand, help to predict future achievable progress ratios more accurately. Important barriers are: (a) energy efficiency investments in the building envelope typically have an ‘add-on’ character (i.e. they are inessential for the basic functioning and utilisation of the object); (b) the building stock turnover is relatively slow and by far not every building envelope refurbishment is done for achieving energy efficiency improvements (in Switzerland, for example, over the last 15 years, 45–60% of the façades from buildings erected prior to 1975 were renewed, but most renewals comprised façade painting only). Other barriers include budget constraints, landlord-tenant dilemmas, and appearance protection of outstanding buildings. Important driving forces, in contrast, include construction deficiencies (e.g. problems with mould in older buildings), comfort considerations, active
Riding down the experience curve for energy-efficient building envelopes 155 building stock management, and certain economic considerations (e.g. prevention from accelerated depreciation). Experience curves, i.e. curves that depict experience-driven cost reductions over cumulative production levels, provide a useful and in public policy still widely under-utilised analytical tool for assessing the historical and expected future performance of technologies in markets, and can help to shape energy, environmental, climate change, and other policies [6]. The assessment of experience curves of building-envelope-related energy efficiency measures and potentials is complicated by the fact that typically one has to deal with a compound system (impact and interplay of materials and building components used), varying investment decision practices, and severe data limitations. Furthermore, the transferability of experiences from one country to others is rather limited due to differences in climate, tradition, construction costs, building codes, insulation standards, etc. In this paper, we analyse technological progress and marginal cost developments for energy efficiency measures related to the building envelope, drawing heavily from a recent and extensive techno-economic study for Switzerland [3]. In particular, we study learning effects concerning innovative products (e.g. insulation materials, construction elements) and processes (e.g. concerning production, planning, logistics, and mounting) relevant for a more energy-efficient building envelope, including windows. The results from our analysis are then put into a somewhat broader perspective, in order to improve our understanding of experience curves related to a more energy-efficient insulation of the building envelope, and how this can be used in policy design and impact analyses. Many of the insights gained from the Swiss experience and prospects can be taken up and adapted to other countries, provided that the differences in the framework conditions are appropriately taken into account. The paper is organised as follows: Section 2 introduces the basic concepts employed and deals with the peculiarities of experience curves in the context of energy efficiency technologies applied to the various components of the building envelope (walls, windows, etc.). Section 3 provides an overview of the techno-economic and institutional progress that has been made in this field in Switzerland and elsewhere over the last three decades. Section 4 addresses the impacts of different diffusion dynamics (investment paths), while Section 5 delivers some policy recommendations and concludes.
2
Applying the experience curve concept to energy efficiency measures for the building envelope
2.1 Cost reduction potentials through economies of scale and scope and learning effects In this section, we address issues of economies of scale and scope, and of learning and mass production. Economies of scale and economies of mass production refer to unit cost reductions that can be reaped from production level increases at which higher operational efficiencies can be achieved and the fixed costs better spread among the products produced. While the former is more related to the plant level (firm size), the latter focuses on the production technique. Economies of scope, in contrast, refer to cost reductions that can be reaped from synergies between production of different products within the same
156
M. Jakob and R. Madlener
company, e.g. because of joint use of production facilities and inputs, joint marketing activities, joint administration, or because one product yields another as a by-product. Learning curve effects refer to the phenomenon that unit production costs typically decrease over time. Sometimes, the term learning curve is used synonymously with experience curve (or progress curve, or learning-by-doing curve), and sometimes learning curve effects are considered to be restricted to learning effects of the workforce, in contrast to experience curve effects that comprise learning effects of the whole firm (i.e. including technical and/or managerial improvements of product design and/or production process), or the whole sector. Table 1 provides an overview on the relative importance of different categories of techno-economic progress of energy efficiency and end-use technologies used for buildings (based on expert judgement). Table 1
Assessment of the actual and future (until approx. 2020) cost reduction impacts of selected investments in heat insulation and energy conversion technologies (+++ major, ++ medium, + minor) Learning effects*
Economies of mass production
Economies of plant scale
+
+
+
+
+ (double) ++ (triple)
+
Innovative (e.g. vacuum- or foil-based) window glazing
++
+
+
Design and on-site application of insulation materials, components, and auxiliaries
+++
++
+
Pre-fabrication of construction elements (e.g. walls and roofs for wooden buildings)
++
++
+
Window frames (compound materials)
+++
++
+
Technology categories and selected examples Building envelope/heat insulation ‘Traditional’ insulation materials (mineral fibres, polystyrene/polyurethane foams) ‘Traditional’ (double/triple) window glazing**
Passive energy houses
+++
++
+
Vacuum insulation elements
+++
+++
+
++
+
+
Energy conversion Boilers, burners Air renewal systems with heat recovery
++
++
+
Heat pumps
++
+++
+
*Assuming targeted searches for efficiency improvement potentials. **Improvements concern mainly the optimisation of the ratio between solar energy gain and thermal conductivity/heat loss; further heat loss reductions of the glass can only be achieved with innovative window glazing. Source: Based on expert judgement; adopted from [1].
Energy efficiency investments concerning the building shell often consist of a combination of industrially fabricated products on the one hand, and the installation/application/mounting of these products on the construction site on the other hand. Depending on the relative cost share and the stage of the innovation process, different experience curve effects prevail. Whereas for the first cost component
Riding down the experience curve for energy-efficient building envelopes 157 mentioned, economies of mass production and economies of manufacturing plant scale are typically more important, for the second cost component, learning effects (e.g. leading to a change of production method) as such tend to dominate. However, the learning component can be important also for the fabrication of products, especially if they are at an early stage of innovation (e.g. enhanced insulation thickness, window frames made of wood-based compound materials, vacuum-based insulation panels, foil-inserted glazing, and the like).
2.2 Conceptual issues regarding the use of experience curves for the building envelope Usually, in an energy context, experience curves describe the relation between specific costs of energy generated (or converted) and the cumulative output of the generating or converting technologies studied, measured in capacity units such as kW, or number of units produced such as kWh, and the like. In contrast, energy efficiency technologies and measures do not provide energy, but rather help to conserve it (i.e. to reduce energy demand), which calls for the definition of a reference (or baseline) for the measurement of the amount of energy conserved, or energy efficiency gained, respectively. The cumulative area of façades, for instance, on which state-of-the-art heat insulation has been applied, could be a measure for the (cumulative) output of energy efficiency investments. However, such a measure would not take into account the increasing energy efficiency of façade insulation over time (technical progress). As a matter of fact, the costs and energy efficiency of a particular insulation measure for the building envelope including windows depend mainly on the U-value, which in turn depends on the thickness of the material used [7]. Consequently, some energy efficiency measure has to be included into the characterisation of the specific cost and/or the cumulative output of a particular technology as well. Table 2 provides an overview of and differences between typical (cumulative) output and specific cost categories for energy conversion (here: electricity generation) technologies on the one hand, and energy efficiency measures/technologies relevant to the building envelope on the other hand. Table 2
Comparison between (cumulative) output and specific cost categories, and between electricity generation technologies vs. building envelope insulation measures/technologies Electricity generation technologies
Building envelope insulation measures/technologies (incl. windows)
Output
Electrical energy or capacity; el., homogenous good, independent of technical characteristics and of stage of development of the plant
m2 of applied insulation or windows, energy performance depending on technical characteristics and on stage of development
Cumulative output
•
Cumulative installed capacity kWel
Specific costs
•
Euro/kWel
•
Euro/kWhproduced
Category
Source: Own illustration.
•
Applied m2 @ technical characteristics
•
Cumulative kWhconserved
•
Euro/m2 @ technical characteristics
•
Euro/kWhconserved
158
M. Jakob and R. Madlener
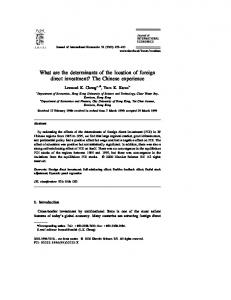
The cost of the energy conserved [8] not only depends on the maturity of the technology concerned, but also largely on the thermal quality standard actually chosen (insulation thickness, U-value, etc.). In other words, the costs of conserved energy can be low at an early stage of innovation because the consumers prefer low insulation thickness, whereas later on, when the cumulative output has grown further (and consequently the experience curve concept would suggest lower specific costs), they may in fact have risen because of an increase in insulation thickness used (e.g. due to legal requirements and/or higher prices/price expectations). Let us assume for a moment the stylised case where the insulation thickness is chosen in such a way that the marginal cost of conserved energy equals the marginal cost of heat generation, and that the latter would remain constant over time. In this case, the economic agents would adjust the insulation thickness in line with the techno-economic progress experienced (if insulation gets less expensive, then more insulation can be applied to reach the economic optimum) and, as a consequence, the observable cost of conserved energy would remain constant over time. Likewise, the observable specific costs and insulation thicknesses would not follow a single experience curve, but rather switch from one to another in a subsequent manner (see Figure 1). Of each of these different experience curves, however, only a short piece can be empirically observed, as insulation thicknesses and energy efficiencies of windows changed gradually and not in major steps. Indeed, since it is already difficult to empirically determine the present marginal cost curve (or the wall insulation cost as a function of insulation thickness), for practical reasons, it is almost impossible to determine historical marginal cost curves. Figure 1
Experience curves for different insulation thicknesses vs. marginal cost of heating (stylised)
Source: Own illustration.
The bottom line of this exposition is that the cost of conserved energy is not necessarily a good indicator to be used in experience curve considerations. However, there might be cases where the experience curve concept is applicable also for energy efficiency measures whose characteristics gradually evolve over time (such as standard wall insulation thickness, which increased steadily in the past). In any case, it is important to
Riding down the experience curve for energy-efficient building envelopes 159 assess the institutional, regulatory, techno-economic, societal and other framework conditions when interpreting relations between costs, technical progress, and cumulative output. In other words, it might be a good idea to separate innovation introduction phases where the marginal costs of energy efficiency rise (e.g. due to more stringent codes and standards which first lead to higher cost but also to higher energy efficiency) from consolidation phases where a downward-sloped experience curve can actually be observed. In the following two subsections, we first describe cases where the specific costs of energy conserved can be used, followed by two proposed alternative methods for cases where they are not suitable.
2.2.1 Method 1: Joint consideration of specific cost and technical characteristics Let us define the cost of energy efficiency (or cost of conserved energy) at time t, CEE,t, as: CEE ,t ≡
a ⋅ ( I t − I 0,t ) (U 0 − U t ) ⋅ HDDt ⋅ 24
(1)
where a is the annuity factor (that depends on the lifetime and interest rate assumed), (I – I0) denotes the additional investment costs at time t (Euro/m2) referred to the reference efficiency level U0, U is the resulting U-value of the efficiency investment considered (in W/m2K) and HDD stands for heating degree days [9]. Note that in the experience curve concept I0 and U0 correspond to the construction standard at t = t0, e.g. a wall without insulation. Such defined costs of energy efficiency can then be used in an experience curve approach for the following two cases: First, for clearly distinguishable technologies, such as double-glazed non-coated windows, double-glazed coated windows, triple-glazed coated windows, etc. Second, when a new market is created, or a certain standard of a technology is needed or applied due to new legal requirements, independent of the marginal cost of energy conservation or heat generation. For example, the introduction of the heat protection ordinance (‘Wärmeschutzverordnung’ [10]) or the passive energy house label in Germany, or the MINERGIE label for energy-efficient buildings in Switzerland (see subsection 3.1), created new markets that made it necessary to apply innovative technologies, or more energy-efficient versions of existing products and methods. This caused an augmentation of the marginal cost of energy efficiency in the short term. Later the costs decreased again, and it is exactly this cost reduction process that can be assessed by the experience curve concept. In mathematical terms, in both cases, the experience curve can be formulated as follows: b CEE = c ⋅ Ycum
(2)
where CEE denotes the marginal cost of energy efficiency (in CHF/kWh, €/GJ etc.; 1 Swiss Franc (CHF) is equal to about 0.66 Euros (€), Ycum the cumulative output (in m2 applied, kWhconserved etc.), and b and c are coefficients to be empirically estimated. Note that a cost decreasing experience curve effect can only be detected if b < 0, and that Ycum, expressed in kWh conserved, is calculated as the sum of the denominator of equation (1) times the area of insulation applied in each year, A, i.e.:
160
M. Jakob and R. Madlener T
kWh = ∑ [ At (U 0 − U t ) ⋅ HDD ⋅ 24]. Ycum
(3)
t =1
b = 2b. From this the progress ratio, pr, can be derived as pr = c ⋅ (2Ycum )b / c ⋅ Ycum
2.2.2 Method 2: Separate consideration of specific cost and technical characteristics If the energy quality of the building envelope is chosen according to some standard economic optimality condition (e.g. the marginal cost of energy efficiency equals the marginal cost of heat generation), or if the cost of conserved energy is even rising over time and over cumulative output despite some techno-economic progress (implying a shift to the right on the marginal cost curve, so that per m2 more energy is being saved), we propose the following alternative method that considers specific costs and technological characteristics separately. If the marginal cost of (additional) energy efficiency remains constant over time, or over cumulative output, then this does not necessarily mean that there is an absence of techno-economic progress. Indeed in economics in general and for energy efficiency in particular, it is often the case that technological progress leads to a higher utility level at constant cost. In these cases, techno-economic progress could be described by insertion of equation (2) into equation (1), yielding: b1 I − I 0 = c1 ⋅ Ycum
(4)
b2 U − U 0 = c2 ⋅ Ycum
(5)
If b1 – b2 = 0, then the marginal cost of energy efficiency is constant; in contrast, if b1 – b2 < 0, then some techno-economic progress has occurred that is dependent on cumulative output (and which thus can indeed be tackled by some experience-curve-based energy policy measures).
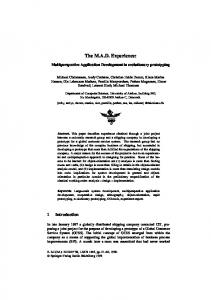
2.3 Established vs. pioneer markets When assessing new and innovative technologies, pioneer and niche market phenomena can be observed. In what follows next, we briefly discuss some empirical evidence found for the case of exterior wall insulation and windows in Switzerland. Figure 2 depicts the price differences per square metre (compared to an insulation thickness of 12 cm) charged by various Swiss building companies in relation to the thickness of the wall insulation concerned. Data were gathered in a survey in which the price as a function of the insulation thickness was asked for. Thus, the data do not represent real project prices, but rather systematic ‘close to the market’ offer prices. As can be seen from Figure 2, prices are quite similar in the range between 8 cm to 16 cm, which corresponds to today’s most commonly used insulation thickness (conventional ‘standard’ range, left of the dashed line), but they vary much stronger beyond a thickness of about 16 cm (innovative ‘above-standard’ range, right of the dashed line). This can be explained by the following two factors:
Riding down the experience curve for energy-efficient building envelopes 161 •
Having 12 cm as the most common insulation thickness, more than 15 cm is applied quite rarely, and the façade companies have not yet gained sufficient know-how and experience both in carrying out such façade applications and in competitive (marginal) cost calculation, so that it can be safely assumed that some precaution surcharges (risk premiums) are included in the price quotes.
•
The market for high-efficiency building envelopes is only about starting to develop, both on the supply and the demand side. Indeed, up to now, most architects and planners were not yet very well informed about best available technologies and best practice charges for increased insulation thicknesses, and neither were the consumers.
Figure 2
Additional price charged by different Swiss building companies (tagged A–G and K–P) for various wall insulation thicknesses; relative to standard insulation: (a) compact façades, (b) ventilated façades
(a)
(b)
Source: Based on [3].
At present, high insulation thickness is used mainly in niche markets where prices are price-policy-driven rather than cost-driven. However, it can be expected that the more the demand for increased insulation thickness will rise and the more architects, planners and investors are informed about best practice costs, the more the prices will decline towards the bottom end of best practice prices (companies D, F, L, N and O in Figure 2). Using the definition of CEE given in equation 1, it becomes evident that the cost of energy efficiency would drop considerably if this happens (see [1,3] for more details). Also, in the case of windows, the established market segment of plastic-framed windows shows a much less pronounced cost increase as a function of improved energy efficiency than the pioneer market for wood-based compound frames (see [1,3] for more details about these empirically based findings).
3
Techno-economic progress over the last 30 years
The legal and institutional framework conditions regarding energy standards determine to a large extent the techno-economic progress in the different countries. For example, it can be observed that in countries with legally binding but not very ambitious building
162
M. Jakob and R. Madlener
standards, new buildings are insulated much less and windows have higher thermal losses than in countries with more rigorous standards (see [1] for a compilation of wall and roof insulation thicknesses in Europe). In Europe, for instance, only a few large international window glazing manufacturing companies exist today. Nevertheless, the different local and national subsidiaries of these international corporate groups typically do not produce their best available technology (BAT), but only the level that meets the national or regional insulation standards and/or traditions. For example, while in Austria and Switzerland coated and inert-gas-filled glazing almost became the standard glazing technique during the early 1990s, the market share for this kind of window in Germany was only about 10%. Only the announcement of a building insulation ordinance (Wärmeschutzverordnung [10]) in Germany in 1995 triggered the rapid and accelerated market penetration of this kind of insulation glazing. The rapid diffusion was supported on the supply side, because the reduction in regulatory uncertainty induced the glazing companies to invest into production facilities that enabled to produce coated glazing at much higher output rates, and – because of both mass production effects and production type effects (change from batch production to serial production) – at lower costs (e.g. Blessing [11]).
3.1 Evolution of relevant framework conditions – the Swiss experience Deeply impressed by the two oil price shocks of the 1970s and their economic consequences, the Swiss authorities and professional associations (much like in many other countries) began to worry about the increasing energy consumption of the building sector and, accordingly, tried to promote energy efficiency improvements of the building envelope. To a limited extent, such improvements were also pushed by the construction industries, and partly pulled from the demand side through private and public project developers. While the first oil crisis in 1973–1974 led to a certain awareness about the importance of energy efficiency measures and some early action, only the second oil shock of 1979 led to the implementation of legally binding standards in several Swiss cantons. These were predominantly focused on individual construction elements (walls, roof, windows) though. In 1988 then, the Swiss Association of Engineers and Architects (SIA) published a standard based on these construction elements (SIA Standard 180) and, in addition, a unitary building standard on how to calculate the energy demand of buildings as a whole (SIA Standard 380/1), together with two benchmark levels (limit and target values) for energy demand [12]. In the mid-1990s, SIA published a so-called ‘reduction path’ (Absenkpfad) for energy requirements of buildings and the federal administration encouraged the harmonisation of energy-relevant legislation for buildings (see [13]). Meanwhile, the latest edition (2001) of SIA Standard 380/1 also contains an adaptation to European standards (SN EN 832) and serves most of the cantons for formulating their legislations (MuKEn [14]). As a consequence of all these actions taken, the energy-related quality of the building insulation and windows applied improved continuously over the past thirty years (cf. Figures 3 and 5), while the specific energy demand for space heating of new buildings has decreased accordingly. In fact, the technical progress of windows developed even faster than the legal requirements or the standards that were set by the SIA. As a reaction to rising difficulties in enforcing and tightening command-and-control measures aimed at raising the energy efficiency of buildings, some of the cantonal
Riding down the experience curve for energy-efficient building envelopes 163 authorities put more weight on motivation, stimulation, and incentive-based measures. In 1997, they co-founded the MINERGIE association, and a MINERGIE label (a registered trademark) and standard were created, with the goal of promoting further improvements regarding the energy requirements of buildings through labelling [15]. It is estimated that only five years after its introduction, the market share of new single-family MINERGIE houses has already reached some 5–8%. Mainly three factors are responsible for the great success of the MINERGIE concept: (a) the architects’ and planners’ freedom on how to achieve the energy demand requirements (optimising both building-envelope-related and/or energy-efficient or renewables-based end-use technology choices, i.e. a performance- instead of a component-oriented approach); (b) the linked promotion of co-benefits associated with improved building envelopes and the installation of air renewal systems (e.g. increased comfort of living); and (c) in the MINERGIE buildings niche market owners and tenants of new buildings show a non-negligible willingness to pay for these co-benefits, as first results from an ongoing survey evaluation confirm [16]. Thus, MINERGIE increasingly becomes an issue also for the real estate sector. Many of the cantons and many banks have since then defined the MINERGIE standard as a prerequisite for receiving financial support or more favourable conditions, respectively, for the construction of new and the refurbishment of existing buildings. Recently, the MINERGIE standard has been refined in various ways (minimum standard also for the building envelope, introduction of a more ambitious standard that reflects the German passive house standard, extension to service and industry sector buildings). It can be expected that the further development and expansion of the MINERGIE niche market will help to ratchet down the energy requirements of the Swiss building stock. Finally, the obligations entered under the Kyoto Protocol (UNFCCC [17]) and related national policy programmes (‘EnergieSchweiz’) and laws (e.g. Swiss CO2 Act 2000 [18]), respectively, are important driving forces, as are the above-mentioned steps that have been taken to foster innovation in the building sector.
3.2 Techno-economic progress – some empirical evidence for Switzerland A separate assessment of the different cost components seems advisable. In this section, we will discuss the techno-economic progress that has been made in Switzerland over the last three decades with respect to energy efficiency of the building envelope. Because energy efficiency measures in this field typically consist of several cost and/or technical components, we decided to provide illustrative examples for both façades and windows. Similar improvements have been achieved for inclined and flat roofs, ground floor or basement wall insulations, as well as for (outer) doors, as can be seen from Table 3. Table 3
Past development of insulation thicknesses of different construction elements (mm)
Construction element