J Neurophysiol 104: 799 – 810, 2010. First published June 10, 2010; doi:10.1152/jn.00231.2009.
Roles of Monkey Premotor Neuron Classes in Movement Preparation and Execution Matthew T. Kaufman,1 Mark M. Churchland,1,2 Gopal Santhanam,2 Byron M. Yu,1,2,6 Afsheen Afshar,2,3 Stephen I. Ryu,2,4 and Krishna V. Shenoy1,2,5 1
Neurosciences Program, 2Department of Electrical Engineering, 3Medical Scientist Training Program, 4Department of Neurosurgery, Department of Bioengineering, Stanford University, Stanford, California; and 6Gatsby Computational Neuroscience Unit, University College of London, London, United Kingdom 5
Submitted 16 March 2009; accepted in final form 4 June 2010
INTRODUCTION
Dorsal premotor cortex (PMd) is known to be involved in both the planning and execution of reaching movements. Frequently, both planning and movement-related activity are exhibited in the very same neurons (Tanji and Evarts 1976; Weinrich and Wise 1982). We therefore ask a basic question: why does PMd plan activity not drive movement? When a monkey is cued about the path of an upcoming reach but required to withhold it until a go cue, PMd activity exhibits tuning for parameters of the reach during the plan period (Churchland et al. 2006b; Godschalk et al. 1985; Hocherman and Wise 1991; Messier and Kalaska 2000; Riehle and Requin 1989). PMd activity also predicts reaction time (RT) (Churchland et al. 2006c; Riehle and Requin 1993) and variability in Address for reprint requests and other correspondence: K. V. Shenoy, 319 CISX, Paul G. Allen Bldg., 330 Serra Mall, Stanford University, Stanford, CA 94305-4075 (E-mail:
[email protected]). www.jn.org
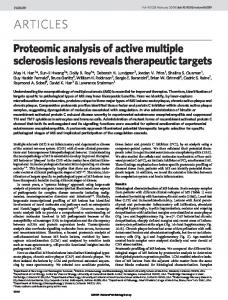
the upcoming movement (Churchland et al. 2006a). Further arguing that PMd is specifically involved in movement planning, disruption of PMd activity near the time of the go cue delays movement onset (Churchland and Shenoy 2007). Additionally, it is known that PMd sends projections down the spinal cord to motor interneurons (Dum and Strick 1991), and microstimulation in PMd causes arm movements (e.g., Weinrich and Wise 1982). Hence movement-epoch PMd activity presumably contributes to actually driving the movement. Theoretical treatments thus often assume a “gate” between plan and movement-related neurons (e.g., Bullock and Grossberg 1988; Cisek 2006a), and pharmacological experiments have suggested that reduction of inhibition might impair the ability to withhold premature movements (Sawaguchi et al. 1996). In the oculomotor system, this gating process is fairly well understood. During saccade preparation, cortical areas such as the frontal eye fields (FEF) generate a representation of the upcoming saccade. A downstream subcortical area (nucleus raphe interpositus) contains “omnipause neurons” (Cohen and Henn 1972), which tonically inhibit saccade-generating “burst neurons” in the brain stem (paramedian pontine reticular formation and rostral interstitial nucleus of the median longitudinal fasciculus) (for review, Fuchs et al. 1985). Omnipause neurons stop firing during the saccade, releasing their inhibitory gate of burst neuron output (Evinger et al. 1982). A hypothetical mapping of this mechanism to PMd is shown schematically in Fig. 1. In this mapping, corticospinal neurons might correspond to burst neurons, local interneurons to omnipause neurons, and local pyramidal neurons to upstream areas such as FEF. While PMd sends axons down the spinal cord, analogously to burst neurons, it is a cortical area, like FEF. There is also a small amount of preparatory activity even in the spinal cord (Prut and Fetz 1999). Thus it is not clear whether PMd should be more closely analogous to FEF or brain stem saccade areas or use some other mechanism entirely to prevent premature movements. It is known that PMd can exert inhibitory as well as excitatory effects on primary motor cortex (M1) (Ghosh and Porter 1988; Keller and Asanuma 1993; Tokuno and Nambu 2000), which might point toward a feedforward-inhibition gating mechanism. A recent study examined whether an oculomotor-like output-gating mechanism might be at play in forelimb movements in rats (Isomura et al. 2009). They found evidence against such a mechanism, but they also note that rats do not have a clear PMd-M1 separation and found that interneurons were only
0022-3077/10 Copyright © 2010 The American Physiological Society
799
Downloaded from jn.physiology.org on August 18, 2010
Kaufman MT, Churchland MM, Santhanam G, Yu BM, Afshar A, Ryu SI, Shenoy KV. Roles of monkey premotor neuron classes in movement preparation and execution. J Neurophysiol 104: 799 – 810, 2010. First published June 10, 2010; doi:10.1152/jn.00231.2009. Dorsal premotor cortex (PMd) is known to be involved in the planning and execution of reaching movements. However, it is not understood how PMd plan activity— often present in the very same neurons that respond during movement—is prevented from itself producing movement. We investigated whether inhibitory interneurons might “gate” output from PMd, by maintaining high levels of inhibition during planning and reducing inhibition during execution. Recently developed methods permit distinguishing interneurons from pyramidal neurons using extracellular recordings. We extend these methods here for use with chronically implanted multi-electrode arrays. We then applied these methods to single- and multi-electrode recordings in PMd of two monkeys performing delayed-reach tasks. Responses of putative interneurons were not generally in agreement with the hypothesis that they act to gate output from the area: in particular it was not the case that interneurons tended to reduce their firing rates around the time of movement. In fact, interneurons increased their rates more than putative pyramidal neurons during both the planning and movement epochs. The two classes of neurons also differed in a number of other ways, including greater modulation across conditions for interneurons, and interneurons more frequently exhibiting increases in firing rate during movement planning and execution. These findings provide novel information about the greater responsiveness of putative PMd interneurons in motor planning and execution and suggest that we may need to consider new possibilities for how planning activity is structured such that it does not itself produce movement.
800
KAUFMAN, CHURCHLAND, SANTHANAM, YU, AFSHAR, RYU, AND SHENOY
electrode arrays. We observed consistent differences in the activity patterns of putative interneurons versus putative pyramidal neurons. Those differences did not follow the predictions of the output-gating omnipause hypothesis; interneuron activity was highest, not lowest, around movement onset. Nor were our results consistent with other, more refined variants of the output-gating hypothesis. These results imply that either gating is not accomplished through inhibition or that the gate is located downstream of PMd.
A
IN P
METHODS
P
IN
Subjects
CS To spinal cord Interneuron
Corticospinal neuron
Firing rate
Pyramid
TARG
MOVE
TARG
MOVE
TARG
MOVE
FIG. 1. The output-gating hypothesis. A: cartoon of cortical connectivity. P, local pyramidal neurons; IN, interneurons; CS, a corticospinal neuron (also pyramidal). Blue synapses are excitatory, red are inhibitory. Gray connection exists, but is not central to the output-gating hypothesis. B: hypothetical PSTHs. TARG, target onset; MOVE, movement onset. Colors correspond to neuron types above. Superficial pyramidal neurons might be expected to build up activity during planning that is amplified at movement onset through recurrence. Interneurons might inhibit output neurons during planning, and later permit activity to flow through to the spinal cord during movement. Corticospinal neurons might then be almost exclusively active during movement.
weakly tuned, in contrast to known interneuron tuning in monkey M1 (Merchant et al. 2008). Thus it remains unclear what mechanism is at work in preventing PMd plan activity from driving movement in the monkey. Different hypotheses about movement gating make different predictions regarding the relative activity patterns of interneurons and pyramidal neurons. Examining differences in their patterns of activity could thus be informative regarding the gating mechanism. We therefore wished to identify interneurons and pyramidal neurons in our recordings. Because interneurons have briefer action potentials than pyramidal neurons (Connors and Gutnick 1990; McCormick et al. 1985), and the extracellular waveform reflects the intracellular waveform (Henze et al. 2000), the extracellularly recorded waveform duration can be used to distinguish interneurons from pyramidal neurons with substantial reliability (Bartho et al. 2004). This technique has previously been used in primary somatosensory cortex (Simons 1978; Swadlow 2003), prefrontal cortex (Diester and Nieder 2008; Johnston et al. 2009; Rao et al. 1999; Wilson et al. 1994), V4 (Mitchell et al. 2007), FEF (Cohen et al. 2009), and M1 (Merchant et al. 2008). We first replicate prior findings of a bimodal distribution of spike-waveform durations for single-electrode recordings. We then extend this method for use with chronically implanted J Neurophysiol • VOL
Task apparatus We used the same task apparatus as described previously (Churchland et al. 2006c). Briefly, during experiments monkeys sat in a customized chair (Crist Instruments) with the head restrained. The left arm of monkey J was restrained loosely using a tube and a cloth sling; monkey H did not have an arm restraint, but seldom moved the nonreaching arm from his side. Stimuli were back projected onto a frontoparallel screen "27 cm from the eyes (the exact distance depended on the size of the monkey). A photodiode was used to record the timing of video frames with 1 ms resolution. The position of a reflector taped to the fingers was tracked optically in the infrared (Polaris System; Northern Digital, Waterloo, Ontario, Canada). The eyes were also tracked in the infrared (Iscan, Burlington, MA). A clear acrylic shield prevented the monkey from touching the dichroic eye-tracking mirror or from bringing the reflector to his mouth. A tube fixed to this shield dispensed juice rewards.
104 • AUGUST 2010 •
www.jn.org
Downloaded from jn.physiology.org on August 18, 2010
B
Animal protocols were approved by the Stanford University Institutional Animal Care and Use Committee. Subjects were two adult male macaque monkeys (Macaca mulatta) trained to perform variants of the delayed reach task for juice reward. After initial training, we performed a sterile surgery during which the monkeys were implanted with a head restraint and either a 96 electrode silicon array (monkey H) or a standard recording cylinder (monkey J). The electrode array (Blackrock Microsystems, Salt Lake City, UT) was implanted in caudal PMd (adjacent to primary motor cortex), as estimated visually from local anatomical landmarks (Fig. 2A). Array recordings yielded strong, well-tuned plan-period activity for arm movements. The cylinder (Crist Instruments, Hagerstown, MD) was centered over caudal PMd, initially estimated using stereotaxic coordinates (13–17 mm anterior to stereotaxic zero, the intermeatal “ear bar” line) and from previous surgeries and MRIs in other monkeys. The cylinder was placed surface normal to the skull, which was left intact and covered with a thin layer of dental acrylic. To accommodate recording, 3 mm holes were drilled later under ketamine/xylazine anesthesia. We confirmed the location of our cylinder with a subsequent craniotomy (Fig. 2B) as part of a later array implantation surgery. The single-electrode recordings reported here appear to be in PMd proper just lateral of the precentral dimple, though potentially near the PMd/M1 “transition zone” (Keller 1993; Weinrich and Wise 1982; Wise et al. 1986). While we cannot definitively localize PMd without histology, consistent with the PMd classification plan-period activity was common and robust for PMd recordings, but not for surface or sulcal M1 sites (recorded separately, not otherwise reported here). Also, microstimulation thresholds for our PMd recordings were higher (median: 50 !A) than in M1 (median: 25 !A). Microstimulation evoked movements of the shoulder and upper arm, or (much less often) of the wrist. A number of our recordings were made deeper (!4 mm) than the typical depth of cortex, consistent with the thickening of cortex near the precentral dimple.
CHARACTERIZING INTERNEURONS IN MONKEY PMd
801
B
C
Neural recordings, classification of neuron types, and EMG 1 mm
D
Neural and electromyographic (EMG) recordings were made using previously described techniques (Churchland et al. 2006c). Neurons were classified as narrow- or broad-spiking using waveform analysis techniques similar to those in Mitchell et al. (2007). Full details are given in the appendix.
# of neurons
30
broad-spiking narrow-spiking deep non-canonical
20
Neural analyses
10
0
0
1
2
3
4 5 6 Depth (mm)
7
8
9
FIG. 2. Relative locations of narrow- and broad-spiking neuron recordings. A: location of the implanted electrode array in monkey H. Nearby sulci are shown with black lines. Red dots indicate narrow-spiking cells, blue dots indicate broad-spiking neurons. Note that some electrodes recorded 2 isolable neurons, indicated by 2 dots in the box for that electrode. B: approximate location of the region of single-electrode recordings in monkey J. C: expanded view of singleelectrode penetration locations for monkey J. Blue and red are as in A, black dots indicate noncanonical waveform neurons. Dots are scattered #0.1 mm to reveal overlapping recordings. D: counts of each neuron type by depth for monkey J. Red and blue are as in other panels; gray indicates neurons with noncanonical waveforms. Neurons unclassifiable due to flat peaks not shown.
Task design The tasks for both monkeys were variants of the center-out delayed reach task (Fig. 3), described previously (Churchland et al. 2006c). Experiments consisted of trials, each a few seconds long, that ended J Neurophysiol • VOL
We operationally define each neuron’s “cross-condition modulation pattern” as simply its mean response (in some time window) across conditions (16 or 24 conditions, depending on the monkey). This is effectively a tuning pattern, but no parametric tuning model (e.g., for direction, endpoint, etc.) is assumed. To obtain the cross-condition modulation pattern, we took the mean firing rate over the relevant epoch for each condition, resulting in a 16- or 24-element vector. We define the cross-condition modulation as the maximum element of the vector minus the minimum element. For analyses of tuning consistency, we produce one such vector for the baseline period, one for the plan period, and another for the peri-movement period. We subtract the baseline vector from each the plan and peri-movement vectors, and correlate the two resulting vectors. RESULTS
Separation of narrow- and broad-spiking neurons Previous work has established the trough-to-peak duration (TTP) of the spike waveform as among the more reliable methods for distinguishing putative interneurons from pyramidal neurons (Bartho et al. 2004; Mitchell et al. 2007). Specif-
104 • AUGUST 2010 •
www.jn.org
Downloaded from jn.physiology.org on August 18, 2010
in a juice reward if successful. The animal began a trial by fixating and touching (for "400 ms) a fixation spot, after which a target appeared. After a plan period, a go cue was given, and reaches were rewarded if they were brisk and accurate. Reward was delivered after the target was held for 300 ms (monkey H) or 450 ms (monkey J), with the next trial beginning a few hundred milliseconds later. For monkey H, the fixation spot was central and the plan period was 200 –1000 ms. Only trials with delay periods !400 ms were analyzed. The go cue was a slight enlargement of the target and the disappearance of the fixation spot. RTs were required to fall between 150 and 500 ms. Two rings of eight targets were used, for a total of 16 conditions. For this monkey, each target location is hereafter referred to as a “condition.” Monkey J performed a novel variant of the delayed-reach paradigm, called the maze task. This task also required delayed reaches (0 –900 ms plan period) to targets. Again, only trials with delay periods !400 ms were analyzed. The maze task includes a number of additional complexities (explained in the following text), but here we use it simply as a 24-condition delayed reach task. In the maze task, the monkey touched the screen but contacted the targets with a virtual cursor floating 2.5 cm above his hand. Additionally, we required that the cursor path not pass through a set of virtual barriers which varied trial to trial. Thus the monkey was required to make curved reaches on most trials. Cursor contact with a barrier resulted in an aborted (unrewarded) trial. Barriers appeared at the same time as the target, and trials with barriers were interleaved with no-barrier trials. Mazes varied in start point, endpoint, and barrier positions. Different mazes were used for different neurons, with 24 stimuli (including those with and without barriers) for each neuron. Effort was made to span the major reach directions and curve shapes for each neuron recorded. The target jittered slightly (2 mm) when it appeared, and the cessation of this jitter and disappearance of the central fixation spot comprised the go cue. RTs were required to fall between 150 and 600 ms. For this monkey, each unique maze (i.e., start point, endpoint, and reach shape) is hereafter referred to as a condition.
A
802
KAUFMAN, CHURCHLAND, SANTHANAM, YU, AFSHAR, RYU, AND SHENOY
Monkey H
Acquire touch
Target cue Plan period
Movement period Target acquired
Go cue
Monkey J
J Neurophysiol • VOL
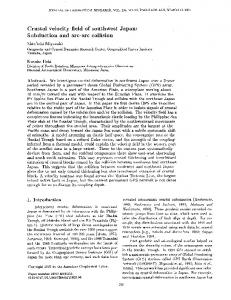
fied as narrow-spiking and 31 as broad-spiking (Fig. 4B). This corresponds to 39% of identified neurons being narrow-spiking. This modest over-representation of narrow-spiking neurons may occur because multiple broad-spiking neurons were commonly present on a single channel of the array recordings.
A
14
# of neurons
12 10 8 200 µs
6 4 2 0
B
100
200
8
300 400 500 Trough to peak (µs)
600
700
800
6
# of neurons
ically, the distribution of TTPs is often bimodal with the briefer mode thought to correspond with inhibitory interneurons and the second mode corresponding predominately with pyramidal neurons (Krimer et al. 2005). The only known mammalian narrow-spiking neurons that are excitatory, spiny stellate cells, are not thought to be common outside of layer IV of primary sensory cortex (Okhotin 2006). Additionally, previous studies in M1 and elsewhere have used spike-triggered averages to demonstrate that neurons with narrow spike waveforms are inhibitory with substantial reliability (Bartho et al. 2004; Merchant et al. 2008). Nonetheless, because we cannot know for certain that every neuron with a narrow waveform is an interneuron or that every neuron with a broad waveform is not, we refer to them as narrow-spiking neurons and broad-spiking neurons to be explicit that we are not directly measuring whether each neuron is inhibitory or excitatory. In monkey J, we recorded 163 neurons using single electrodes. We replicated the bimodal distribution of TTPs (Fig. 4A) found by Mitchell et al. (2007). The bimodality of our TTP distribution was significant with P $ 0.011 using Hartigan’s dip test with a bootstrap (Hartigan and Hartigan 1985; Mechler and Ringach 2002). For monkey J, 34 neurons were identified as narrow-spiking (putative interneurons) and 79 were identified as broad-spiking (putative pyramidal neurons). We excluded from analysis 14 neurons with flat-topped after-potentials the peak time of which could not be reliably measured. An additional 36 had noncanonical waveforms (e.g., missing a post-trough peak); these neurons are analyzed separately in a subsequent section. At most of the recorded depths, a consistent proportion of narrow-spiking neurons was found, though deeper recordings yielded mostly noncanonical waveforms (Fig. 2D). The fraction of narrow-spiking neurons found, 30% of identified neurons (21% of all recorded neurons), is consistent with the proportion found by others (26%: Merchant et al. 2008; 27%: Mitchell et al. 2007; 27%: Rao et al. 1999) and with the estimated fraction of interneurons in cortex, 20 –30% (Connors and Gutnick 1990). In monkey H, we recorded 71 single units using a chronically implanted multi-electrode array. Twenty neurons were identi-
200 µs
4
2
0
100
200
300 400 500 Trough to peak (µs)
600
700
800
FIG. 4. A: histogram of the trough-to-peak (TTP) duration for monkey J. Inset: amplitude-normalized mean waveforms. Red indicates narrow-spiking neurons, blue indicates broad-spiking neurons. B: same for monkey H using simulated multichannel acquisition processor (MAP) filters on broadband data from the chronic electrode array. Red and blue are as above, green indicates neurons considered unclassifiable. Special steps were taken to address the lack of 2 clear peaks in this distribution (see appendix), and subsequent analyses yield very similar results for both the single-electrode data and the electrode array data.
104 • AUGUST 2010 •
www.jn.org
Downloaded from jn.physiology.org on August 18, 2010
FIG. 3. Delayed reach tasks. Each row illustrates a single trial, taking 2–3 s. Top: task for monkey H; bottom: monkey J. Monkey H touched targets directly with his fingers; monkey J also touched the screen but contacted the targets with a cursor floating 2.5 cm above his hand. The animals first fixated (eye and hand/cursor) fixation cues (!400 ms), after which a target appeared. After a plan period (H: 200-1,000 ms; J: 0 –1,000 ms), the go cue was given. For monkey H, the go cue was indicated by a slight enlarging of the target; for monkey J, the target jittered slightly during the plan period and the cessation of jittering indicated “go.” In both cases, the fixation point was also extinguished at the time of the go cue. For monkey J, most trials also involved barriers which appeared at the same time as the target, instructing a curved reach.
CHARACTERIZING INTERNEURONS IN MONKEY PMd
High-quality spike sorts were thus achievable for a greater fraction of the (relatively isolated) narrow-spiking neurons, and they were therefore included at a higher rate. The precise depths of the implanted array tips are not known, but the electrodes are 1 mm long and were fully inserted immediately after surgical implantation. The electrode tips were therefore likely shallower on average than our singleelectrode recordings. Thus the array recordings were presumably primarily from the shallower cortical layers, while the single-electrode recordings sampled all layers. To our knowledge, narrow- and broad-spiking neurons have not previously been identified using this recording technology. Although special steps were required to address the lack of two clear peaks in the TTP distribution (see appendix), subsequent analyses yield very similar results for both our single-electrode data and our electrode array data. Comparison of the responsiveness of the two neuron classes
spikes/s
Broad-spiking
planning than at baseline. The flatness of the aggregate PSTH for broad-spiking neurons does not imply that they have weak cross-condition modulation, however. Instead it indicates that on average their firing rates decrease as often as increase, as in the example neuron (Fig. 5, left). Figure 6, bottom, plots mean cross-condition modulation, defined as the range of firing rates over all conditions at each time point independently. For both narrow- and broad-spiking neurons, cross-condition modulation rises substantially at target onset and stays high through movement onset. However, cross-condition modulation is greater for narrow-spiking neurons both during the plan period and around movement onset. Together with the mean PSTHs, this means that both classes of neurons show substantial cross-condition modulation, but cross-condition modulation was stronger for narrow-spiking neurons and their firing rates were more likely to increase than decrease. This contrasts sharply with results from rat forelimb motor cortex, in which interneurons show cross-condition modulation almost exclusively during the movement epoch and show little tuning for movement direction (Isomura et al. 2009). Merchant et al. (2008), however, found a generally similar pattern of firing rate changes in monkey primary motor cortex. To see whether the structure of the population PSTHs was representative, we performed a cell-by-cell analysis. For each neuron, we took the mean plan-period firing rate (50 – 400 ms after target onset) minus the mean fixation-period baseline firing rate. The histogram over neurons is plotted in Fig. 7, top. Consistent with the population PSTHs, the distribution for narrow-spiking neurons is shifted slightly to the right of that for broad-spiking neurons in both monkeys (monkey J, narrow vs. broad medians: 4.9 vs. 0.8 spikes/s, P # 0.02; monkey H: 0.5 vs. 0 spikes/s, P # 0.001, Mann-Whitney U tests). The middle row plots movement-period activity (%100 to &200 ms from movement onset) minus the baseline, and here the rightward shift for narrow-spiking neurons is more pronounced (J: 12.6 vs. 0.5 spikes/s, P # 0.002; H: 5.8 vs. 1.3 spikes/s, P # 0.03), again consistent with the population PSTHs. Results were similar when the analysis was performed over neuron-conditions instead of neurons. We also tested whether neurons exhibited a “pause-like” pattern of activity, as was hypothesized for interneurons in the
Narrow-spiking
60
60
40
40
20
20
Deep non-canonical 160 120 80 40
0
0 -400 TARG 400 -400 MOVE
600
0
-400 TARG 400 -400 MOVE
600
-400 TARG 400 -400 MOVE
600
FIG. 5. PSTHs of example PMd neurons (1 neuron per panel). Each trace plots the average firing rate for 1 condition from that neuron. Insets: the output-gating model’s predictions from Fig. 1. All neuron classes were highly heterogeneous, but PSTHs pictured represent common response patterns. During planning, pyramidal neurons often increased their firing rates for some conditions and decreased their firing rates for others. Interneurons’ firing rates typically increased during the plan period, and they tended to have their highest firing rates around the time of movement onset. Deep neurons, which may project to other brain areas or the spinal cord, tended to be less strongly modulated across conditions during the plan period but were typically quite active during the movement. 20 ms SD Gaussian smoothing used. Neurons from monkey J (P17, P33, P145).
J Neurophysiol • VOL
104 • AUGUST 2010 •
www.jn.org
Downloaded from jn.physiology.org on August 18, 2010
Figure 5 shows example peristimulus time histograms (PSTHs) for one broad-spiking neuron, one narrow-spiking neuron, and one deep noncanonical neuron (to be discussed later). Although there was wide variation in the response patterns of different neurons within each class, these examples exhibit the most common patterns recorded. During the plan period, the broad-spiking neuron (blue) shows increases in firing rate for some conditions and decreases for others. The narrow-spiking neuron (red) is also strongly tuned during the plan period, but most of its firing rate changes are positive. For this neuron, firing rates rise even further shortly before movement onset and drop back to baseline several hundred milliseconds after movement onset. Figure 6 (top) plots population PSTHs for narrow-spiking neurons and for broad-spiking neurons, collapsing over all conditions. There are substantial average differences between narrow- and broad-spiking neurons. Narrow-spiking neurons tend to increase their firing rates more strongly during the plan period and to show a much greater rise in firing rate before movement onset (as in the examples). Firing rates do not return to baseline until after movement onset. Surprisingly, the mean rate for broad-spiking neurons is almost unchanged between the baseline period and the plan period. That is, on average pyramidal neurons do not fire at higher rates during motor
803
804
KAUFMAN, CHURCHLAND, SANTHANAM, YU, AFSHAR, RYU, AND SHENOY
monkey J
monkey H mean PSTH
(mean across all conds) 25
spikes/s
35 narrow-spiking
25
15 -400
broad-spiking
TARGET 400 -400
0 MOVE
-400
600
TARGET 400 -400
600
MOVE
600
cross-condition modulation
40
spikes/s
(pref - least pref ) 25
0
5 -400
TARGET 400 -400
MOVE
-400
600
TARGET 400 -400
output-gating model (see Fig. 1B). We took the mean planperiod activity minus the mean movement-period activity for each neuron and plot the distributions in Fig. 7, bottom. A neuron with a tendency to be very active during plan and only weakly active during the movement has a large value for this measure. No significant difference was observed between cells classes in either monkey for this metric, and the trends present were not in the hypothesized direction (J: %3.6 vs. 0.8 spikes/s, P ! 0.14; H: %5.3 vs. %0.8 spikes/s, P ! 0.07). Thus it was not the case that one class of neuron tended to have a high firing rate during the plan period and pause during the perimovement period. Additionally, note that these distributions appear to be unimodal; there does not appear to be a subset of pause-like neurons. Results were again similar when the analysis was performed over neuron-conditions instead of neurons. From the output-gating hypothesis illustrated in Fig. 1, one might have expected a particular pattern of activity from interneurons: high and perhaps un-tuned firing rates during the plan period and a pause in firing around movement onset. This is not what was observed for the narrow-spiking neurons (putative interneurons). Instead such neurons generally showed strong cross-condition modulation during the plan period, followed by a rise in activity around movement onset. Nor was there a clear subset of narrow-spiking cells with a pause-like response. These patterns do not appear consistent with a straightforward formulation of the output-gating hypothesis, for which inhibition should decline around movement onset.
ings, we attempted to isolate every neuron encountered. Recordings were abandoned only if the isolation was lost, the neuron died, or the neuron was completely unresponsive during the plan period. Few neurons were abandoned due to a lack of responsiveness, perhaps because the novel task used with monkey J evoked particularly strong responses. While our selection criteria could lead to a general bias toward responsiveness, they should not lead to a systematic difference between the classes. Further, because we recorded as many narrow-spiking neurons as expected from the percentage of interneurons in cortex, our criteria probably did not strongly bias us toward or away from recording interneurons. For the array recordings, neuron selection was made purely on quality of isolation. Again this should not produce response differences between neuron classes, and similar results were found with the array recordings as with single electrodes. We also tested whether our effects were sensitive to the precise threshold for separating narrow- and broad-spiking neurons. We re-divided the population using a range of thresholds from 170 to 300 !s and calculated the mean difference between the population PSTHs for the two classes. The differences varied smoothly with the threshold value in both monkeys. Thus the observed difference in firing rate changes is largely insensitive to the precise threshold value.
Additional controls for neuron classification
We also considered that inhibitory interneurons might change their preferred condition between the plan period and the movement period [as observed by Rao et al. (1999) in
We considered whether the observed effects could be a result of neuron-selection bias. For the single-electrode recordJ Neurophysiol • VOL
Consistency of neural modulation across conditions between planning and movement
104 • AUGUST 2010 •
www.jn.org
Downloaded from jn.physiology.org on August 18, 2010
MOVE
FIG. 6. Comparison of response properties between narrow- and broad-spiking neurons. Changes in firing rate for monkey J (left) and monkey H (right). Top: mean firing rate across conditions. Red trace shows the average firing rate across all narrow-spiking neurons across all conditions (both preferred and nonpreferred). Blue trace shows the same for broadspiking neurons. These plots are essentially population PSTHs. Bottom: red trace shows the cross-condition modulation (most preferred minus least preferred condition at every time point) for narrow-spiking neurons. Blue trace is the same for broad-spiking neurons. These plots are effectively a nonparametric “depth of tuning” over time. Note that treating time points independently causes baseline crosscondition modulation to be !0 due to noise. TARGET, target onset time; MOVE, movement onset time. Flanking traces are SEs across neurons.
CHARACTERIZING INTERNEURONS IN MONKEY PMd
monkey J
monkey H 20
# of neurons
30
broadspiking
narrowspiking 0
0 -20
-10 0 10 20 30 plan - baseline (spikes/s)
-10
0 10 20 30 plan - baseline (spikes/s)
20
0
-40
# of neurons
20
0 -20 0 20 40 60 -20 0 20 40 60 140 move - baseline (spikes/s) move - baseline (spikes/s) 20
0
-60 -40 -20 0 20 40 plan - move (spikes/s)
60
0
-140
-60 -40 -20 0 plan - move (spikes/s)
20
FIG. 7. Cell-by-cell analysis of firing rates. Distributions for monkey J (left) and monkey H (right). This analysis summarizes patterns from Fig. 6 for individual neurons. Top: for each neuron, the mean plan-period firing rate (FR) is taken and the mean baseline-period FR is subtracted. The histogram over neurons is plotted. Red indicates narrow-spiking neurons, blue indicates broad-spiking neurons. Note that the distributions are unimodal and nearly symmetrical and that the distribution for narrow-spiking neurons is shifted to the right of that for broad-spiking neurons. That is, narrow-spiking neurons tended to have higher FRs during planning than during baseline. This shift was significant for both monkeys (see RESULTS). Middle: same for mean movementperiod FR minus mean baseline-period FR. Note similar shift as for the plan period above. This shift was significant for both monkeys. Bottom: mean plan-period FR minus mean movement-period FR. Large positive values indicate a pause-like neuron. The narrow- and broad-spiking distributions were not significantly different for either monkey.
prefrontal cortex]. During planning of a movement, one set of interneurons could prevent premature execution while pyramidal neurons achieved the needed pattern of rates. During execution of the movement, these interneurons might decrease their inhibition, while another set of interneurons inhibited competing movements. Instead of an overall pause in firing for interneurons, this version of the output-gating hypothesis predicts that interneurons would invert their preferred conditions between the plan and movement epochs. In contrast, pyramidal neurons would be expected to maintain consistent preferred J Neurophysiol • VOL
conditions. Thus what was inhibited during plan would be released during movement. We did not find this pattern in our data. We frequently observed changes in the preferred condition between the plan and movement periods. However, narrow-spiking neurons did not tend to fully invert their preferred conditions, and such preference changes were just as prevalent for broad-spiking neurons as for narrow-spiking neurons. PSTHs for three example neurons, all broad-spiking, are shown in Fig. 8 (top). These neurons are all well-modulated across conditions at nearly every time point. One of these neurons had consistent preferred conditions between the plan and movement periods (Fig. 8, top right). The other two examples’ patterns of crosscondition modulation change dramatically between the plan period and the peri-movement period: some most-preferred conditions during planning became least-preferred during movement, and vice versa. Such shifts are not visible in the population plots (Fig. 6), where cross-condition modulation was computed as the most-preferred minus least-preferred condition at each time point independently. To quantify the extent of such changes in cross-condition modulation and to ask whether changes were more common for narrow-spiking neurons, we determined the consistency between plan modulation and movement modulation for each cell. For each well-modulated neuron (!5 spikes/s crosscondition modulation for plan and move), we computed its “cross-condition modulation pattern”: a vector containing the mean rate for each condition over an epoch minus the baseline firing rate for that condition. We then correlated the crosscondition modulation patterns for the plan period (50 – 400 ms after target onset) with those from the peri-movement period (%100 to &200 ms from movement onset). These correlations spanned a broad range (Fig. 8, bottom): being sometimes near one (very similar modulation patterns during planning and movement) and sometimes near negative one (pattern of preferences inverted). On average, correlations were only slightly above zero (little relationship between the 2 patterns, neither consistent nor inverting). This was true for both monkeys for both narrow- and broad-spiking neurons. These weak correlations using cross-condition modulation patterns is consistent with previous findings using a cosine-tuning model (Crammond and Kalaska 2000), with population statistics (Johnson et al. 1999), and with oscillatory premotor neurons (Lebedev and Wise 2000). Results when fitting our data with cosine tuning curves yielded similar patterns between narrow- and broadspiking neurons as well (Supplemental Fig. S1).1 As a control, we considered whether this overall low correlation between plan- and movement-period modulation patterns could be due to noise: if we poorly estimated the mean firing rate due to low trial counts, this could reduce the correlation between patterns that were actually similar. To estimate the expected departure from unity correlation due to sampling noise, we re-sampled trials and calculated the resampled plan (move) modulation pattern against the original plan (move) modulation pattern; these re-samplings yielded values rather close to 1 (Fig. 8, gray arrows), implying that the wide range of correlations between the plan and move periods are not due to sampling noise. Finally we considered whether having subtracted baseline activity to compensate for posture 1
The online version of this article contains supplemental data.
104 • AUGUST 2010 •
www.jn.org
Downloaded from jn.physiology.org on August 18, 2010
# of neurons
20
805
806
KAUFMAN, CHURCHLAND, SANTHANAM, YU, AFSHAR, RYU, AND SHENOY 100
100
140
r = 0.17
r = 0.86
spikes/s
r = -0.53
0
0
0 -400 TARG 400 -400 MOVE
-400 TARG 400 -400 MOVE
HJ
Bootstraps
-400 TARG 400 -400 MOVE
HJ
600
Bootstraps
broad-spiking
6
3
-1
-0.5
0 0.5 Correlation (r)
0
1
-1
-0.5
0 0.5 Correlation (r)
tuning might have reduced the correlations. However, when baseline activity was not subtracted, correlations were even lower. Noncanonical waveforms In classifying neurons into narrow- and broad-spiking, we excluded waveforms that did not conform to the classical pattern of a trough followed by a peak. In particular, this included many neurons that had only a single positive peak, or a positive peak followed by a small trough and with little posttrough peak (Fig. 9A). Computer simulations, in combination with systematically positioned extracellular recordings, suggest that such waveforms may be obtained from the distal portion of pyramidal neurons’ dendrites because of capacitative currents (Gold et al. 2006). To isolate a distal dendritic recording with other neurons nearby, presumably the neuron must be large. Because noncanonical waveforms were found almost exclusively deep in cortex (Fig. 2D), this may indicate that they belong primarily to large pyramidal neurons in layers V and VI, which are apt to project to other brain areas or down
A
B
1
the spinal cord. Merchant et al. (2008) have recently argued for an identifiable subgroup of putative pyramidal neurons in primary motor cortex, characterized by having long duration waveforms, having seemingly different connectivity, and being located primarily in layer V. We suspect that the neurons we identify as having noncanonical waveforms may be a similar subgroup as that identified by Merchant et al. (2008) based on their depth. We found noncanonical waveform neurons almost exclusively in recordings from monkey J; the lack of noncanonical waveforms from the multi-electrode arrays is likely due at least in part to their having electrodes 1 mm long and thus probably not recording from the deeper layers. We analyzed these neurons separately. The example neuron shown in Fig. 5 (right) is representative of this neuron class. Such neurons typically had modest changes in firing rate during the plan period with much greater (and mostly positive) changes in firing rate during the movement. This movementperiod activity seems to be maintained relatively later into the movement than for the other two neuron classes. The pattern illustrated in the example neuron can be seen in the population PSTH and cross-condition modulation plots for noncanonical
C
mean PSTH
cross-condition modulation
40
narrow-spiking
35 deep non-canonical spikes/s
spikes/s
broad-spiking
25
200 µs 15 -400
5 TARG
400 -400 MOVE
600
-400
TARG 400 -400 MOVE
600
FIG. 9. Analysis of “noncanonical waveform” neurons (all from monkey J). A: normalized waveforms. B: mean firing rate across conditions and neurons over time (same format as Fig. 6, top left). C: cross-condition modulation (preferred - least preferred condition, same format as Fig. 6, bottom left). Black lines show responses of noncanonical neurons. Flanking traces are SEs.
J Neurophysiol • VOL
104 • AUGUST 2010 •
www.jn.org
Downloaded from jn.physiology.org on August 18, 2010
0
600
12
narrow-spiking
6
# of neurons
600
FIG. 8. Relationship between plan and perimovement cross-condition modulation patterns. Top: PSTHs for 3 example neurons, all broadspiking (monkey J P59, P57, P23). For these examples, the correlations between the plan and peri-movement cross-condition modulation patterns were %0.53 (left), 0.17 (center), and 0.86 (right). Colors correspond to different conditions. Conditions selected are representative; not all are shown. Bottom: distribution of correlation values. A near-zero correlation means that the neuron showed little relationship between its plan and peri-movement modulation patterns. A negative value implies inverted preferences during the 2 epochs. Left bottom: histogram of correlations for narrow-spiking neurons; right bottom: for broadspiking neurons. Neurons are pooled across monkeys: monkey J (H) contributed 33 (8) narrowspiking neurons and 79 (4) broad-spiking neurons (note that many of monkey H’s neurons had shallow cross-condition modulation for 1 epoch and were thus excluded from this particular analysis; see RESULTS). Black arrows are distribution means. For narrow-spiking neurons, the mean for monkey J (H) is 0.26 (0.16), and for broadspiking neurons, the mean is 0.17 (0.09). Gray arrows are bootstraps (see RESULTS).
CHARACTERIZING INTERNEURONS IN MONKEY PMd
waveform neurons (Fig. 9, B and C). This might indicate the presence of a mechanism for limiting the activity of output neurons within PMd. DISCUSSION
These results show that one can distinguish, based on extracellularly recorded waveforms, two classes of neurons in PMd: narrow-spiking (putative interneurons) and broad-spiking (putative pyramidal neurons). These classes differ, as populations, in their patterns of activity during both planning and execution of movements. Compared with putative pyramidal neurons, putative interneurons have stronger cross-condition modulation, are more likely to have firing rates that rise during motor planning, and are more likely to have firing rates that rise around the time of movement onset. Interneurons are more responsive than pyramidal neurons
Lack of support for output gating by inhibition Contrary to what is expected if inhibition served an outputgating function for PMd, putative interneurons were actually most active around movement onset. Indeed, of the two cell classes, interneurons showed the larger activity increase at that time. Thus it does not appear that inhibition falls around movement onset or that excitation outstrips inhibition. It was also not the case that interneurons tended to invert their direction/condition preference around movement onset as might be expected if they switched from inhibiting the planned movement to inhibiting competing movements. Instead interneurons had a broad distribution of correlations between their plan- and movement-period preferences across cells with the distribution centered slightly above zero. That is, on average they neither maintained their preferences consistently nor J Neurophysiol • VOL
switched their preferences consistently between planning and movement. Surprisingly, pyramidal neurons showed a similarly wide range of correlation values. This wide range of correlations is again inconsistent with the output-gating hypothesis, which predicts that the pattern of pyramidal cell plan-period activity should resemble the movement-period activity (merely at subthreshold levels). Thus it does not appear that premotor cortex simply creates a pattern of activity in the excitatory neurons while output cells are kept inhibited until the go cue. Alternative mechanisms for preventing plan activity from driving movement Some mechanism would appear to be necessary to prevent plan period activity from causing undesired movements. One possibility is that a small subset of interneurons might act as gates, whereas most have some other function. However, we did not see support for this in the form of a subset of cells with a pause-like activity pattern (high plan-period firing rates and low movement-period firing rates). Instead, regarding their tendency to pause during movement, we found a unimodal distribution across neurons (Fig. 7, bottom). A second possibility is that PMd may make feedforward connections primarily on inhibitory neurons in M1, essentially making the rest of M1 the “output” neurons in Fig. 1. There is physiological evidence that some pyramidal neurons in PMd synapse primarily on inhibitory cells in M1, producing feedforward inhibition (Ghosh and Porter 1988; Keller 1993; Tokuno and Nambu 2000). However, we did not find a clear subset of pyramidal neurons with pause-like activity patterns. The feedforward inhibition hypothesis also makes the concrete prediction that we should find pause-like neurons in M1, which presents a good target for future study. Another possibility is that gating may occur purely downstream of PMd. Local inhibition in M1 could prevent it from responding during planning and then be released before movement. Other work has suggested that cancellation of movements, a form of gating, could involve lateral inhibition in M1 (Riehle et al. 2006). However, recent work has shown that in M1, as in PMd, inhibition rises rather than falls around the time of movement onset (Merchant et al. 2008). An intriguing alternative is that the motor system does not use a straightforward mechanism of inhibitory gating at all. Indeed a blanket output-gating mechanism might be ill-suited to real-world reaching behavior. One must typically plan one movement while executing another or while maintaining a posture (e.g., in our task the arm had to be supported against gravity). If a feedforward gate exists, it seems it must therefore be movement-specific. The connectivity of PMd also argues against the presence of a blanket output gate: PMd projects to M1 and spinal interneurons but not to lower motor neurons (Dum and Strick 2002). Because both M1 neurons and spinal interneurons show some plan-period activity (Prut and Fetz 1999), PMd should be expected to send some signals down the spinal cord and into M1 even during the plan period. Such activity presumably modulates reflexes or otherwise prepares the downstream motor system. Last, the mean firing rate across pyramidal neurons barely changed during the planning period. It is thus possible that planning occurs in such a way that there is no “excess” output to gate.
104 • AUGUST 2010 •
www.jn.org
Downloaded from jn.physiology.org on August 18, 2010
The finding that interneurons are more strongly modulated across conditions than pyramidal neurons is consistent with their larger dynamic range (Connors and Gutnick 1990). More surprising was the finding that putative interneurons are more likely to have firing rates that rise during movement planning, while putative pyramidal neurons showed more symmetric firing rate changes. To put this another way, for interneurons most conditions (most reach directions/reach paths) caused an increase in firing rate, while for pyramidal neurons, conditions that caused suppression were almost as common as those that caused excitation. This is perhaps remarkable— one usually supposes that overall activity goes up during motor planning— yet our results indicated the average rate of a population of pyramidal neurons rises only slightly. Most of the increase in overall rate (and what is perhaps detected with lower-resolution methods such as fMRI) is contributed by interneurons. The functional significance of the rise in inhibition, but not in excitation, is unclear. One speculation is that as incoming excitation rises, the relative rise in internal inhibition may serve to maintain a balance of excitation and inhibition (Shadlen and Newsome 1998; van Vreeswijk and Sompolinsky 1996). Physiologically, the asymmetry may arise because many interneurons have chloride reversal potentials near threshold (Martina et al. 2001). If such neurons are not readily hyperpolarized by GABA, they may be less likely to show declines in firing rate.
807
808
KAUFMAN, CHURCHLAND, SANTHANAM, YU, AFSHAR, RYU, AND SHENOY
Summary We found a number of differences between the responses of putative interneurons and putative pyramidal neurons. Two findings present a potential challenge to our current conceptualization of PMd function. First, we found no evidence that interneurons in PMd act to gate outputs. It thus remains unclear how, in the absence of movement, planperiod activity can be so prevalent in neurons that also appear actively involved in generating movement. Second, we found that most neurons in PMd have cross-condition modulation that is inconsistent between the plan and movement epochs. It is possible that a dynamical systems/feedback-control framework can account for these findings, although it seems just as possible that the correct theoretical framework has yet to be developed.
1x
154 Hz 1-pole HP
100x amp
APPENDIX
Supplementary methods NEURAL RECORDINGS. We made neural recordings using single electrodes in monkey J and an implanted multi-electrode array in monkey H. For monkey J, single-unit recordings were made using tungsten single electrodes with 3–7 M' starting impedance (No. UEWLGCSEEN1E, Frederick Haer , Bowdoinham, ME) driven by a hydraulic microdrive (David Kopf Instruments, Tujunga, CA) as described previously (Churchland et al. 2006c). Electrode impedances were reduced to (1 M' after piercing the dura. An effort was made to isolate neurons that were active during the plan period. Neural signals were amplified, filtered, and sorted using a Multichannel Acquisition Processor (MAP; Plexon, Dallas, TX). The signal path was: unity-gain buffer (head stage), 154 Hz 1 pole high-pass filter, 100 ) amplifier, 8.8 kHz 1 pole low-pass filter, 10 ) amplifier, 30 Hz 1 pole high-pass filter, digital 400 Hz 2 pole high-pass filter, digital 6 kHz 6 pole low-pass filter (Fig. 10). Before (or occasionally after) recording each new neuron, waveforms were also collected with the digital filters disabled. For most neurons (137), the recording site depth was estimated. The point at which the electrode entered cortex was determined by listening to the noise characteristics while lowering the electrode. For analyses involving depth, we excluded penetrations where this point was uncertain. We recorded 163 neurons in total with an average of 14 trials per condition. For monkey H, signals were recorded from the implanted array using the Cerebus system (Blackrock Microsystems, Salt Lake City, UT) and sorted with the Sahani sorting algorithm (Santhanam et al. 2004) as described previously (Zumsteg et al. 2005). Clustering plots generated by the sorting algorithm assisted in identifying single units by hand; identified multiunits were discarded. During performance of the task, standard filter settings were used (Fig. 10). Before recordings, 2 min of broadband data were also recorded (0.3 Hz 1 pole high-pass filter, 7.5 kHz 3 pole low-pass filter) for use in waveform classification. A single day of recording (H20041119), which yielded 71 single units, was used. EMG RECORDINGS. EMG activity was recorded from monkey J using hook-wire electrodes (44 gauge with a 27 gauge cannula; Nicolet Biomedical, Madison, WI) placed in the muscle for the duration of single recording sessions. EMG was recorded for a subset of the maze conditions. Recordings were made from trapezius, latissimus dorsi, pectoralis, triceps brachii, medial and lateral aspects of the biceps
(incl. 400 Hz 2-pole HP)
Broad BP 10x amp
ADC
Single-unit waveforms
Single electrode
Cerebus “spike Head stage, incl. broad
ADC
250 Hz 4-pole HP
Save standard data
Simulate “spike Electrode array
ADC
Save broadband data
Classify events (spike sort)
Sorted waveforms
Simulate MAP 1-pole HP) FIG. 10. Signal paths for single electrode (MAP) recordings (top) and multi-electrode array recordings (bottom). Key filters marked with heavy outline. HP, high-pass; BP, band-pass; ADC, analog-digital converter. Bracket under top waveforms illustrates how trough-to-peak waveform duration is measured.
J Neurophysiol • VOL
104 • AUGUST 2010 •
www.jn.org
Downloaded from jn.physiology.org on August 18, 2010
Therefore instead of a gated oculomotor-like system such as that illustrated in Fig. 1, we might consider PMd and M1 as forming a dynamical system for controlling the arm (Churchland et al. 2006b; Cisek 2006b; Fetz 1992; Scott 2004; Todorov and Jordan 2002). Because there are many more neurons than muscles, neural activity would likely be higher dimensional than the muscle activity it controls. If so, many directions in the high-dimensional “neural space” would fall in the “null space” of the muscles: changes in neural activity along those dimensions would not produce changes in muscle activity (Churchland et al. 2007; Yu et al. 2009). An output-gating mechanism would not be required. Such a system would also not be obliged to possess elements with consistent “tuning” during the plan and movement epochs (or even within the movement epoch) (Churchland et al. 2006b; Fu et al. 1995; Hatsopoulos et al. 2007). Our findings are consistent with this view, but they fall well short of an explicit test. Future work will have to determine how to generate specific predictions from the dynamical systems/feedback-control framework.
CHARACTERIZING INTERNEURONS IN MONKEY PMd
brachii, and anterior, medial, and posterior aspects of the deltoid. Recordings were made one muscle at a time, after completion of neural recording. Electrode voltages were amplified, band-pass filtered (150 –500 Hz, four pole, 24 db/octave), sampled at 1,000 Hz, and digitized. Off-line, raw traces were differentiated (to remove any remaining baseline), rectified, smoothed with a Gaussian (SD of 15 ms), and averaged. We verified that plan activity was not producing substantial anticipatory changes in muscle activity. EMG activity was typically unmodulated from the baseline period to the plan period, or in rare instances, very weakly modulated during the plan period. This is consistent with our previous verifications in similar tasks with previous animals (Churchland et al. 2006b,c). CLASSIFICATION OF NEURON TYPES USING SINGLE-ELECTRODE RECORDINGS. To find each neuron’s mean waveform, we took #300
CLASSIFICATION OF NEURON TYPES USING MULTI-ELECTRODE ARRAY RECORDINGS. We extended the TTP method for classifying neu-
ron types to data collected with the Blackrock multi-electrode arrays. To our knowledge, neuron classes have not previously been distinguished using these arrays. To classify these waveforms, we simulated the filters used with our single-electrode recordings, which we knew could yield good separation of narrow- and broad-spiking neurons. To simulate the single-electrode signal path, we took advantage of the broadband array recordings made before some experiments (Fig. 10). We re-filtered the original broadband data with digital filters to simulate the (nondigital) single-electrode high-pass filters (thick border in Fig. 10). Spike sorting was still based on the original filtered waveforms, and the waveforms from broadband were classified by re-filtering them to match the standard array filtering. This produced sorted waveforms with filtering similar to that for monkey J, where we found bimodality. This process does not yield a distribution of waveforms from the array with two clear peaks, though the distribution does appear to be bimodal (see RESULTS). This blurring is presumably because of electrode tip geometry, lower impedance, filtering properties of the electrode tips, or other unknown properties of the arrays. Use of even broader filters (100 Hz 4 pole high-pass) did not yield cleanly separable peaks either. J Neurophysiol • VOL
We do not know what properties of the arrays are responsible for blurring the bimodality of the distribution. However, based on simulations using our single-unit data, we found that even relatively small amounts of additional filtering destroyed the two-peaked distribution shape. That exercise also revealed that even with such a blurred distribution it was still possible to properly classify neurons (classification after additional filtering always agreed with that before), so long as one was willing to use a small exclusion zone (30 !s). We thus applied this zone to the array-recorded TTP data, making our thresholds #185 !s and !215 !s. On the assumption that the filtering properties of the two electrode types (and/or the chronic vs. acute recording environment) are unlikely to be exceedingly different, this should be conservative. Importantly, we note that the key differences between neurons classified as narrow-spiking and neurons classified as broad-spiking were very similar between the single-unit dataset and the multi-electrode array dataset. This confirms that the choice of threshold and exclusion zone was reasonable. As a control, we subsequently repeated key analyses using different threshold choices and found that the main effects were only weakly sensitive to the exact choice of threshold. ACKNOWLEDGMENTS
We thank M. Risch for expert surgical assistance and veterinary care, D. Haven for technical consultation, and S. Eisensee for administrative support. Present addresses: B. M. Yu, Dept. of Electrical and Computer Engineering and Dept. of Biomedical Engineering, Carnegie Mellon University, Pittsburgh, PA 15213; S. I. Ryu, Dept. of Neurosurgery, Palo Alto Medical Foundation, Palo Alto, CA 94301. GRANTS
This work was supported by National Science Foundation graduate research fellowships to M. T. Kaufman, G. Santhanam, and B. M. Yu; a National Institutes of Health postdoctoral training fellowship to M. M. Churchland; a Helen Hay Whitney postdoctoral fellowship to M. M. Churchland; Burroughs Wellcome Fund Career Awards in the Biomedical Sciences to M. M. Churchland and K. V. Shenoy; NDSEG Fellowships to G. Santhanam and B. M. Yu; Christopher Reeve Paralysis Foundation funding to S. I. Ryu and K. V. Shenoy; a Stanford University Bio-X Fellowship to A. Afshar; a Stanford–NIH Medical Scientist Training Program grant to A. Afshar; funding from the Sloan Foundation to K. V. Shenoy; National Institute of Neurological Disorders and Stroke Grant CRCNS R01-NS-054283 to K. V. Shenoy; and an NIH Director’s Pioneer Award 1DP1OD006409 to K. V. Shenoy. DISCLOSURES
No conflicts of interest, financial or otherwise, are declared by the author(s). REFERENCES
Bartho P, Hirase H, Monconduit L, Zugaro M, Harris KD, Buzsaki G. Characterization of neocortical principal cells and interneurons by network interactions and extracellular features. J Neurophysiol 92: 600 – 608, 2004. Bullock D, Grossberg S. Neural dynamics of planned arm movements: emergent invariants and speed-accuracy properties during trajectory formation. Psychol Rev 95: 49 –90, 1988. Churchland MM, Afshar A, Shenoy KV. A central source of movement variability. Neuron 52: 1085–1096, 2006a. Churchland MM, Santhanam G, Shenoy KV. Preparatory activity in premotor and motor cortex reflects the speed of the upcoming reach. J Neurophysiol 96: 3130 –3146, 2006b. Churchland MM, Shenoy KV. Delay of movement caused by disruption of cortical preparatory activity. J Neurophysiol 97: 348 –359, 2007. Churchland MM, Yu BM, Ryu SI, Santhanam G, Shenoy KV. Neural variability in premotor cortex provides a signature of motor preparation. J Neurosci 26: 3697–3712, 2006c. Churchland MM, Yu BM, Sahani M, Shenoy KV. Techniques for extracting single-trial activity patterns from large-scale neural recordings. Curr Opin Neurobiol 17: 609 – 618, 2007.
104 • AUGUST 2010 •
www.jn.org
Downloaded from jn.physiology.org on August 18, 2010
waveforms, spline interpolated them to 2.5 !s precision, then aligned each. Alignment was generally performed at the mid-point of the slope between trough and peak to minimize jitter for both the trough and peak. For the very broadest-waveform neurons, this yielded poor alignment. Thus when the downward slope of the trough was !1.5 times that of the upward slope of the trough, we instead used the mid-point on the initial downward slope (see Supplemental Figs. S2 and S3). We found that this procedure yielded alignment as good or better than that provided by alternate methods based on the trough minimum or trough center of mass. Following alignment, we selected the cleanest waveforms for purposes of obtaining the average waveform (spikes were not discarded for other analyses). To do so, we took the SD of the waveforms at each time point, then accepted only waveforms where the absolute difference from the mean was #2 SD at every time point and the absolute mean difference from the mean across time was #0.4 SD. These values were chosen by hand as eliminating most noisy and vertically offset waveforms. We averaged these clean waveforms to get the mean waveform that was analyzed for each neuron. We then separated out by hand neurons with mean waveforms the shapes of which were not canonical (e.g., were lacking a trough or a post-trough peak; plotted in Fig. 9A of RESULTS) and rejected neurons with mean waveform afterpotentials which were very flat and therefore difficult to measure reliably. Rejections were performed blind to the trough-to-peak duration (TTP) distribution and were performed prior to subsequent analyses. We found a bimodal distribution with a TTP threshold (200 !s) for separating neuron types, essentially identical to that in Mitchell et al. (2007). We note that Song and McPeek (2010) report a TTP threshold of 300 !s for separating their recordings into two classes; this appears to be the threshold for distingushing class I pyramidal neurons from class II pyramidal neurons as observed by Merchant et al. (2008) and as can be seen in Fig. 4.
809
810
KAUFMAN, CHURCHLAND, SANTHANAM, YU, AFSHAR, RYU, AND SHENOY
J Neurophysiol • VOL
McCormick DA, Connors BW, Lighthall JW, Prince DA. Comparative electrophysiology of pyramidal and sparsely spiny stellate neurons of the neocortex. J Neurophysiol 54: 782– 806, 1985. Mechler F, Ringach DL. On the classification of simple and complex cells. Vision Res 42: 1017–1033, 2002. Merchant H, Naselaris T, Georgopoulos AP. Dynamic sculpting of directional tuning in the primate motor cortex during three-dimensional reaching. J Neurosci 28: 9164 –9172, 2008. Messier J, Kalaska JF. Covariation of primate dorsal premotor cell activity with direction and amplitude during a memorized-delay reaching task. J Neurophysiol 84: 152–165, 2000. Mitchell JF, Sundberg KA, Reynolds JH. Differential attention-dependent response modulation across cell classes in macaque visual area V4. Neuron 55: 131–141, 2007. Okhotin VE. Cytophysiology of spiny stellate cells in the striate cortex and their role in the excitatory mechanisms of intracortical synaptic circulation. Neurosci Behav Physiol 36: 825– 836, 2006. Prut Y, Fetz EE. Primate spinal interneurons show pre-movement instructed delay activity. Nature 401: 590 –594, 1999. Rao SG, Williams GV, Goldman-Rakic PS. Isodirectional tuning of adjacent interneurons and pyramidal cells during working memory: evidence for microcolumnar organization in PFC. J Neurophysiol 81: 1903–1916, 1999. Riehle A, Grammont F, MacKay WA. Cancellation of a planned movement in monkey motor cortex. Neuroreport 17: 281–285, 2006. Riehle A, Requin J. Monkey primary motor and premotor cortex: single-cell activity related to prior information about direction and extent of an intended movement. J Neurophysiol 61: 534 –549, 1989. Riehle A, Requin J. The predictive value for performance speed of preparatory changes in neuronal activity of the monkey motor and premotor cortex. Behav Brain Res 53: 35– 49, 1993. Santhanam G, Sahani M, Ryu S, Shenoy K. An extensible infrastructure for fully automated spike sorting during online experiments. Conf Proc IEEE Eng Med Biol Soc 6: 4380 – 4384, 2004. Sawaguchi T, Yamane I, Kubota K. Application of the GABA antagonist bicuculline to the premotor cortex reduces the ability to withhold reaching movements by well-trained monkeys in visually guided reaching task. J Neurophysiol 75: 2150 –2156, 1996. Scott SH. Optimal feedback control and the neural basis of volitional motor control. Nat Rev Neurosci 5: 532–546, 2004. Shadlen MN, Newsome WT. The variable discharge of cortical neurons: implications for connectivity, computation, and information coding. J Neurosci 18: 3870 –3896, 1998. Simons DJ. Response properties of vibrissa units in rat SI somatosensory neocortex. J Neurophysiol 41: 798 – 820, 1978. Song JH, McPeek RM. Roles of narrow- and broad-spiking dorsal premotor area neurons in reach target selection and movement production. J Neurophysiol 103: 2124 –2138, 2010. Swadlow HA. Fast-spike interneurons and feedforward inhibition in awake sensory neocortex. Cereb Cortex 13: 25–32, 2003. Tanji J, Evarts EV. Anticipatory activity of motor cortex neurons in relation to direction of an intended movement. J Neurophysiol 39: 1062–1068, 1976. Todorov E, Jordan MI. Optimal feedback control as a theory of motor coordination. Nat Neurosci 5: 1226 –1235, 2002. Tokuno H, Nambu A. Organization of nonprimary motor cortical inputs on pyramidal and nonpyramidal tract neurons of primary motor cortex: An electrophysiological study in the macaque monkey. Cereb Cortex 10: 58 – 68, 2000. van Vreeswijk C, Sompolinsky H. Chaos in neuronal networks with balanced excitatory and inhibitory activity. Science 274: 1724 –1726, 1996. Weinrich M, Wise SP. The premotor cortex of the monkey. J Neurosci 2: 1329 –1345, 1982. Wilson FA, O’Scalaidhe SP, Goldman-Rakic PS. Functional synergism between putative gamma-aminobutyrate-containing neurons and pyramidal neurons in prefrontal cortex. Proc Natl Acad Sci USA 91: 4009 – 4013, 1994. Wise SP, Weinrich M, Mauritz KH. Movement-related activity in the premotor cortex of rhesus macaques. Prog Brain Res 64: 117–131, 1986. Yu BM, Cunningham JP, Santhanam G, Ryu SI, Shenoy KV, Sahani M. Gaussian-process factor analysis for low-dimensional single-trial analysis of neural population activity. J Neurophysiol 102: 614 – 635, 2009. Zumsteg ZS, Kemere C, O’Driscoll S, Santhanam G, Ahmed RE, Shenoy KV, Meng TH. Power feasibility of implantable digital spike sorting circuits for neural prosthetic systems. IEEE Trans Neural Syst Rehabil Eng 13: 272–279, 2005.
104 • AUGUST 2010 •
www.jn.org
Downloaded from jn.physiology.org on August 18, 2010
Cisek P. Integrated neural processes for defining potential actions and deciding between them: a computational model. J Neurosci 26: 9761–9770, 2006a. Cisek P. Preparing for speed. Focus on “Preparatory activity in premotor and motor cortex reflects the speed of the upcoming reach.” J Neurophysiol 96: 2842–2843, 2006b. Cohen B, Henn V. Unit activity in the pontine reticular formation associated with eye movements. Brain Res 46: 403– 410, 1972. Cohen JY, Pouget P, Heitz RP, Woodman GF, Schall JD. Biophysical support for functionally distinct cell types in the frontal eye field. J Neurophysiol 101: 912–916, 2009. Connors BW, Gutnick MJ. Intrinsic firing patterns of diverse neocortical neurons. Trends Neurosci 13: 99 –104, 1990. Crammond DJ, Kalaska JF. Prior information in motor and premotor cortex: activity during the delay period and effect on pre-movement activity. J Neurophysiol 84: 986 –1005, 2000. Diester I, Nieder A. Complementary contributions of prefrontal neuron classes in abstract numerical categorization. J Neurosci 28: 7737–7747, 2008. Dum RP, Strick PL. The origin of corticospinal projections from the premotor areas in the frontal lobe. J Neurosci 11: 667– 689, 1991. Dum RP, Strick PL. Motor areas in the frontal lobe of the primate. Physiol Behav 77: 677– 682, 2002. Evinger C, Kaneko CR, Fuchs AF. Activity of omnipause neurons in alert cats during saccadic eye movements and visual stimuli. J Neurophysiol 47: 827– 844, 1982. Fetz EE. Are movement parameters recognizably coded in the activity of single neurons. Behav Brain Sci 15: 679 – 690, 1992. Fu QG, Flament D, Coltz JD, Ebner TJ. Temporal encoding of movement kinematics in the discharge of primate primary motor and premotor neurons. J Neurophysiol 73: 836 – 854, 1995. Fuchs AF, Kaneko CR, Scudder CA. Brain stem control of saccadic eye movements. Annu Rev Neurosci 8: 307–337, 1985. Ghosh S, Porter R. Corticocortical synaptic influences on morphologically identified pyramidal neurons in the motor cortex of the monkey. J Physiol 400: 617– 629, 1988. Godschalk M, Lemon RN, Kuypers HG, van der Steen J. The involvement of monkey premotor cortex neurones in preparation of visually cued arm movements. Behav Brain Res 18: 143–157, 1985. Gold C, Henze DA, Koch C, Buzsaki G. On the origin of the extracellular action potential waveform: a modeling study. J Neurophysiol 95: 3113– 3128, 2006. Hartigan JA, Hartigan PM. The dip test of unimodality. Ann Stat 13: 70 – 84, 1985. Hatsopoulos NG, Xu Q, Amit Y. Encoding of movement fragments in the motor cortex. J Neurosci 27: 5105–5114, 2007. Henze DA, Borhegyi Z, Csicsvari J, Mamiya A, Harris KD, Buzsaki G. Intracellular features predicted by extracellular recordings in the hippocampus in vivo. J Neurophysiol 84: 390 – 400, 2000. Hocherman S, Wise SP. Effects of hand movement path on motor cortical activity in awake, behaving rhesus monkeys. Exp Brain Res 83: 285–302, 1991. Isomura Y, Harukuni R, Takekawa T, Aizawa H, Fukai T. Microcircuitry coordination of cortical motor information in self-initiation of voluntary movements. Nat Neurosci 12: 1586 –1593, 2009. Johnson MT, Coltz JD, Hagen MC, Ebner TJ. Visuomotor processing as reflected in the directional discharge of premotor and primary motor cortex neurons. J Neurophysiol 81: 875– 894, 1999. Johnston K, DeSouza JF, Everling S. Monkey prefrontal cortical pyramidal and putative interneurons exhibit differential patterns of activity between prosaccade and antisaccade tasks. J Neurosci 29: 5516 –5524, 2009. Keller A. Intrinsic synaptic organization of the motor cortex. Cereb Cortex 3: 430 – 441, 1993. Keller A, Asanuma H. Synaptic relationships involving local axon collaterals of pyramidal neurons in the cat motor cortex. J Comp Neurol 336: 229 –242, 1993. Krimer LS, Zaitsev AV, Czanner G, Kroner S, Gonzalez-Burgos G, Povysheva NV, Iyengar S, Barrionuevo G, Lewis DA. Cluster analysisbased physiological classification and morphological properties of inhibitory neurons in layers 2–3 of monkey dorsolateral prefrontal cortex. J Neurophysiol 94: 3009 –3022, 2005. Lebedev MA, Wise SP. Oscillations in the premotor cortex: single-unit activity from awake, behaving monkeys. Exp Brain Res 130: 195–215, 2000. Martina M, Royer S, Pare D. Cell-type-specific GABA responses and chloride homeostasis in the cortex and amygdala. J Neurophysiol 86: 2887–2895, 2001.