In P. Romero, J. Good, E. Acosta Chaparro & S. Bryant (Eds). Proc. PPIG 17
Pages 145 - 159
Roles of Variables in Experts’ Programming Knowledge Jorma Sajaniemi1 and Raquel Navarro Prieto2 1
University of Joensuu, Department of Computer Science, P.O.Box 111, 80101 Joensuu, Finland,
[email protected], WWW home page: http://www.cs.joensuu.fi/˜saja/ 2 Universitat Pompeu Fabra, Estacio de la Comunicacio, Ocata 1, 08003 Barcelona, Spain
Abstract. Roles of variables capture the dynamic nature of variables, i.e., their behavior. Only ten roles are needed to cover 99 % of variables in novice-level procedural programs. Roles were originally identified by studying variables in existing programs and creating a classification for them. In order to find out whether roles are a part of experts’ programming knowledge, we conducted a knowledge elicitation investigation where professional programmers studied programs and the resulting mental representations were elicited using card sorting and interviews. This paper presents the analysis of the results from the point of view of the role theory. All roles appearing in the materials were identified by participants. There was some variation in perceiving the nature of behavior from the lifetime of a variable and in considering the similarity of behaviors. The roles could however be easily found in the participants’ card sorting results and in the dendrogram obtained by hierarchical cluster analysis.
1
Introduction
Programming involves the use of abstract concepts at various levels of abstraction. One such concept is the notion of variable plans, which represent stereotypic uses of variables [1, 2]. Based on the plan concept, Sajaniemi [3] has developed a theory of the roles of variables, which characterizes variables as having one of a set of distinctive roles. The role theory applies to small and large programs, and to different programming paradigms like functional and object-oriented programming. A set of ten roles covers practically all variables in novice-level procedural programs. Sajaniemi and Kuittinen [4] have used roles in teaching elementary programming. Students were divided into three groups that were instructed differently: in the traditional way with no treatment of roles; using roles throughout the course; and using a role-based program animator in addition to using roles in teaching. The results indicate that students are not only able to understand the role concept and to apply it in new situations but that the roles provide students a new conceptual framework that improves program comprehension; and that the use of the animator elaborates this knowledge resulting in a richer set of programming plans and in skilled programming [4, 5]. In another study, Ben-Ari and Sajaniemi [6] tested the understandability and acceptability of the role concept and of the individual roles as seen by computer science
17th Workshop of the Psychology of Programming Interest Group, Sussex University, June 2005
www.ppig.org
Sajaniemi and Navarro Prieto
educators. The web-based investigation consisted of a short tutorial on roles, a brief training session on assigning roles to variables, a test evaluating the participants’ ability to assign roles, and a set of open questions concerning their opinions of roles. Roles were identified with 85 % accuracy—in typical uses of variables with 93 % accuracy— and educators’ comments on the role concept in general were mostly positive. Furthermore, the results make it clear that increased teaching experience improves the ability to assign roles correctly, and they indicate that experts have little problem with the role concept. The role set was originally identified by studying all variables in three textbooks and by creating a classification for them [3]. This method does not guarantee that roles are a part of experts’ programming knowledge even though the easy learnability of the roles presents some evidence for this assumption. In order to study whether this is really the case, we conducted a knowledge elicitation investigation where professional programmers studied programs and the resulting mental representations were elicited. Research in the last years by Ca˜nas and al. [7] has provided the theoretical and empirical bases for the utilization and interpretation of the results of knowledge elicitation techniques. After a series of experiments they concluded that relationship judgments among concepts were useful to gather knowledge about a user’s conceptual model or information stored in the long term memory. Nevertheless, the information gathered is not a complete picture of the conceptual knowledge of the user, but rather a subset that depends on the information that is used for the particular task in the working memory, i.e., a short term store used to perform a task. Because of that Ca˜nas and al. recommend to complete the information obtained from the users’ judgments with other methods. For knowledge elicitation we used card sorting, or grouping, task. This method has been used in a wide range of areas to extract the mental knowledge of a specific set of people. In interaction design it is used to understand users’ mental models [8], in expert systems design it is used to understand how knowledge providers conceptualize the domain elements [9], and in program comprehension it has been applied to understand the difference between the mental representations of experts and novices. In our case, we completed the information gathered with the card sorting task with interviews where the participants explained why they sorted the variables in the way they did. This qualitative information about reasons for grouping things together has proven to be valuable in understanding the criteria used by the participants [10]. Other examples of the use of interviews to study program comprehension is Pennington’s work (e.g., [11]). The rest of this paper is organized as follows. Section 2 provides background by introducing the role concept in more detail. Section 3 describes the investigation followed by its results in Section 4. Section 5 discusses the results from the point of view of the role theory. Finally, Section 6 contains the conclusion.
2
Roles of Variables
Variables are not used in programs in a random or ad-hoc way but there are several standard use patterns that occur over and over again. In programming textbooks, two patterns are typically described: the counter and the temporary. Sajaniemi [3] has generalized this idea to the concept of the roles of variables, which he obtained as a result
PPIG 2005 Sussex University
www.ppig.org
Sajaniemi and Navarro Prieto
of a search for a comprehensive, yet compact, set of characterizations of variables for the purposes of, e.g., teaching programming and analyzing large-scale programs. His work is based on earlier studies on variable use made by Ehrlich and Soloway [1], Rist [2], and Green and Cornah [12]. Ehrlich and Soloway [1] gave three example roles, which actually describe the goal that a variable has to fulfill. Rist [2] developed further this idea and defined a plan as a set of actions that achieve a goal, and a goal as a state to be achieved, e.g., to calculate a value or a series of values. Sajaniemi’s idea of a role is in these terms the dynamic aspect of a goal or an invariant that holds for a variable, i.e., how the variable depends on itself and other variables. Green and Cornah [12] gave a more detailed list of roles in their proposal for a tool, Programmer’s Torch. Their roles are close to Sajaniemi’s roles but include also other aspects, e.g., whether a variable is used to control the execution path. Sajaniemi’s roles are based on the nature of the successive values a variable obtains, and pays no attention to the way the values are further used. In Sajaniemi’s role theory [3], the role of a variable characterizes the dynamic nature—or behavior—of a variable: the sequence of its successive values as related to other variables and external events. The way the value of a variable is used has no effect on the role, e.g., a variable whose value does not change is considered to be a fixed value whether it is used to limit the number of rounds in a loop or as a divisor in a single assignment. Furthermore, as roles describe behavior, they are related to the deep structure of programs as opposed to the surface structure, e.g., the form of assignment used to update a variable. Table 1 lists ten roles that cover 99 % of variables in novice-level procedural programs [3] and gives for each role an informal definition; exact definitions can be found in the Roles of Variables Home Page [13]. It should be noted that roles are cognitive— rather than technical—concepts. As an example, consider the Fibonacci sequence 1, 1, 2, 3, 5, 8, 13, . . . where each number is the sum of the previous two numbers. A mathematician who knows the sequence well can probably see the sequence as clearly as anybody sees the sequence 1, 2, 3, 4, 5, . . . , i.e., the continuum of natural numbers. On the other hand, for a novice who has never heard of the Fibonacci sequence before and who has just learned how to compute it, each new number in this sequence is a surprise. Hence, the mathematician may consider the variable as stepping through a known succession of values (i.e., a stepper) while the novice considers it as a gatherer accumulating previous values to obtain the next one. Ben-Ari and Sajaniemi [6] have shown that in one hour’s work, computer science teachers can learn roles and assign them successfully in normal cases. In their experiment, the roles one-way flag, temporary and organizer were not included in the materials, but one variable to be recognized was a one-way flag. Participants’ responses to this variable were totally different from other responses, with a large variety in suggested roles. These results provide evidence that roles are intuitive for computer science educators and that all the roles are really needed.
PPIG 2005 Sussex University
www.ppig.org
Sajaniemi and Navarro Prieto
Table 1. Roles of variables in novice-level procedural programming.
Role
Informal description
Fixed value
A variable initialized without any calculation and not changed thereafter. Stepper A variable stepping through a systematic, predictable succession of values. Follower A variable that gets its new value always from the old value of some other variable. Most-recent holder A variable holding the latest value encountered in going through a succession of values, or simply the latest value obtained as input. Most-wanted holder A variable holding the best or otherwise most appropriate value encountered so far. Gatherer A variable accumulating the effect of individual values. Transformation One-way flag
3
A variable that always gets its new value with the same calculation from values of other variables. A two-valued variable that cannot get its initial value once its value has been changed.
Temporary
A variable holding some value for a very short time only.
Organizer
An array used for rearranging its elements.
Investigation
In order to study expert programmers’ knowledge about variables and to what extent roles are part of it, a card sorting investigation was conducted. Professional programmers were instructed to get acquainted with short programs and then asked to sort all variables into groups based on their similarity. Participants were also interviewed about the sorting criterion they used. The interviews were audio recorded. The resulting groups and the interviews were then analyzed. Participants: Thirteen programmers with a background between 3 and 24 years of professional programming (mean 13.7, mode 15) were recruited from software companies in the Joensuu region in Finland. All participants knew the programming language C well, had been programming in several procedural or object-oriented languages, and were unaware of the researchers’ prior work in the area of programming knowledge as well as the role concept. All participants were male. The participants or their companies were paid a small fee for participating in the investigation. Materials: Five C programs having between 19 and 33 non-comment and nonblank program lines (mean 25.4, mode 22) were prepared. All programs had a different application domain, e.g., blood hormone testing or day number format conversion. The beginning comment of each program included an example of the execution of the program: input and corresponding output. Each program had an associated modification
PPIG 2005 Sussex University
www.ppig.org
Sajaniemi and Navarro Prieto
task; the tasks were designed to be simple and not to require the introduction of new variables. There was a total of 30 global scalar variables in the programs; all having the type int except a single char. The variables represented typical deep structures of six roles. For each role, different surface structures were used by varying operators in assignments, forms of assignments, and enclosing control structures. Table 2 lists all variables, their roles, and surface structures. In order to avoid too coarse granularity in the sorting task, participants were asked to form groups consisting of 3 to 8 variables. The programs were designed so that the group size restriction did not prevent participants from using sorting criteria based on role, phase in data flow, or form of assignment. If the variables are sorted using role as the criterion, the result consists of 6 groups containing 4–5 variables each; sorting based on phase in data flow yields 5 groups containing 3–8 variables; and sorting based on the form of assignment used in updating a variable yields 5 groups containing 4–7 variables. For control purposes, several alternative naming conventions were used for the variables, e.g., month, smallDigit, pier length, SHIP, INT greatest. (For the sake of clarity, all variable names are written throughout this paper using a single convention, e.g., pierLength.) Different naming styles were used within each of the above theoretical groups. Even though it was possible to use the naming convention as sorting criterion (5 groups of 4–8 variables), we did not expect anybody to do that. The materials and theoretical groups can be found at http://www.cs.joensuu.fi/˜saja/var roles/materials/exp03/index.htm. In order to be able to compare similarities of groupings, we defined a similarity metrics. The similarity of two groupings, P 1 and P 2, is obtained as follows. For each variable v let G1 and G2 be the groups in P 1 and P 2 containing v. Divide the number of variables in the intersection of the groups G1 and G2 (excluding v) by the the number of variables in the union of the groups G1 and G2 (again excluding v). Then, the similarity value is obtained as the mean of the results of the division operations. Using this method, the similarity of two identical groupings is 1.00, and the similarity of two totally orthogonal groupings is 0.00. Table 3 gives the similarity values of groupings obtained by using the theoretical criteria described above. The largest similarity value, 0.45, is between roles and phase in data flow. This comes from two similar groups in these theoretical groupings: the role most-recent holder is quite close to input variables, which start data flow; and the role stepper happens to be the same as the position of loop counters in the data flow. Procedure: Participants were run individually. A session started with a background questionnaire conducted by the researcher. The participant was then given five sheets of paper, each containing one program and its modification task, and was asked to study the programs so that he understood them well, and to make the modifications using a pencil. The programs were laid side by side on a table and their order was systematically varied. Participants were allowed to study the programs in the order they wanted, but most of them studied the programs in the given order. There was no time limit for this phase, and the durations varied between 22 and 99 minutes (mean 45.9, mode 40).
PPIG 2005 Sussex University
www.ppig.org
Sajaniemi and Navarro Prieto
Table 2. Variables in the programs used in the investigation. FIX = fixed value, STP = stepper, FOL = follower, MRH = most-recent holder, MWH = most-wanted holder, GAT = gatherer. Variable base largePowerOfTwo monthsToProcess norm pierLength currentMonth count month powerOfTen powerOfTwo daysToBeginning lastShip preceding previous yesterday command currDigit current dayNbr ship testRes closest greatest longest maxDelta smallDigit
Role Initialization FIX int base=7 FIX int largePowerOfTwo=65536 FIX monthsToProcess=12 FIX norm=15 FIX int pierLength=100 STP for (currentMonth = 4; STP count=10 STP month=-1 STP for (powerOfTen = 100000000; STP powerOfTwo = largePowerOfTwo FOL daysToBeginning=0 FOL int lastShip=0 FOL scanf(”%d”, &preceding) FOL scanf(”%d”, &previous)
numericValue
GAT
int numericValue=0
daysAtEnd
GAT
daysAtEnd=0
used
GAT
int used=0
total
GAT
total = current+previous+preceding
FOL MRH MRH MRH MRH MRH MRH
scanf(”%d”,¤t) dayNbr=rand()%400 int ship=0 scanf(”%d”,&testRes) MWH closest=testRes MWH greatest=total MWH longest=0 MWH int maxDelta=0 MWH smallDigit=10
Update
for(...currentMonth+=1) while ... count−− while ... month++ for(...powerOfTen=powerOfTen/10) while ... powerOfTwo=powerOfTwo/2 while ... daysToBeginning=daysAtEnd while ... case ... if ... lastShip=ship for ... preceding=previous for ... previous=current while ... yesterday=testRes while ... scanf(”%c”,&command) while ... scanf(”%d”,&currDigit) for ... scanf(”%d”,¤t) while ... dayNbr=rand()%400 while ... case ... scanf(”%d”,&ship) while ... scanf(”%d”,&testRes) while ... if ... closest=testRes for ... if ... greatest=current+previous+preceding while ... case ... if ... longest=ship while ... if ... maxDelta=abs(testRes-yesterday) for ... if ... smallDigit= numericValue/powerOfTen%10 while ... numericValue= base*numericValue+currDigit while ... daysAtEnd= daysAtEnd+daysInMonth[month] while ... case ... used+=ship case ... used-=ship for ... total+=current
The researcher then rearranged the program sheets in the order they were originally presented to the participant and laid cards representing the variables in the program on top of each sheet. Each card had the names of the program and the variable written on it. The researcher asked the participant to sort the cards in groups of three to eight variables so that “similar variables will go together”, and to apply the same sorting criterion for all groups. The time used for the sorting task was not limited and it varied between 8 and 35 minutes (mean 17.6, mode 15). When the sorting task was ready, the participant was asked to give a written explanation for each of his groups. This was followed by an interview where the participant explained the sorting criterion he had used, the exact contents of each group, and alternative sorting criteria he had thought of or might consider to be appropriate. During the interview, the participant was allowed to move cards between groups. This occurred often, as some of the programs were complicated and some variables had for control purposes a bit obscure (but still meaningful) names, resulting in obvious slips in sorting. For example, in order to avoid superlatives in all names for extreme values, the variable holding the smallest digit found so far was not named smallestDigit but smallDigit and this resulted in some cases in false recall of the meaning of the
PPIG 2005 Sussex University
www.ppig.org
Sajaniemi and Navarro Prieto
Table 3. Similarities of the theoretical criteria. Role Role Phase in data flow Form of assignment Naming convention
1.00 0.45 0.24 0.10
Phase in data flow
Form of Naming assignment convention
1.00 0.18 0.10
1.00 0.14
1.00
variable. Participants were also asked to further divide groups having more than 8 cards. In some cases the participant was unable to do that; then the group was left unchanged. Participants were allowed to put a variable in more than one group by cloning its card, and to leave variables outside any group. The number of extra cards varied between 0 and 21. Seven participants used no extra cards; three used 1–2 cards; and the remaining three participants used 4, 17, and 21 cards. Two participants left one or two cards outside the groups. The total length of the sessions varied between 58 and 144 minutes.
4
Results
Even though the participants were instructed to use a single sorting criterion for all groups, it turned out that most of them used several criteria either hierarchically or mixed in some more complicated way, e.g., a couple of groups based on one criterion and other groups based on another criterion with subdivision based on yet another criterion. This is in line with the findings of Ca˜nas and al. [7] who found that in knowledge elicitation tasks the limits of working memory cause context effects in the selection between various criteria for judgments. Figure 1 lists all sorting criterion principles used by the participants or identified in the interviews as possible alternative criteria the participants had thought of using. The criterion principles may be organized in four main categories. Domain-based criteria deal with issues related to the application domain, technology-based criteria deal with the features of programming languages, execution-based criteria are based on activities that occur during the execution of a program, and strategy-based criteria have their origins in the strategies that the programmer applies when working with the program. Each criterion principle may give rise to several sorting criteria with differences among details. A detailed treatment of the sorting criteria is outside the scope of this paper and can be found elsewhere [14]. One participant used the naming convention as his sorting criterion. This was against our expectations because the materials were carefully prepared so that variables named using the same convention had nothing in common. The interview revealed that the participant worked in a company that had a strict naming standard where the form of variable names tells either data hierarchy or the location of the data element: is it in a data base or is it a temporary data element. Thus his sorting criterion was actually based on data hierarchy and scope even though his technique did not work in the current situation. This participant is discarded from further analysis of the results.
PPIG 2005 Sussex University
www.ppig.org
Sajaniemi and Navarro Prieto
data unit
Domain−based
data relationship data type
Technology−based
data hierarchy scope
Sorting criterion
phase in control flow phase in data flow visibility to user Execution−based
source behavior utilization contribution programming strategy
Strategy−based
testing strategy
Category
Criterion principle
Fig. 1. Sorting criteria principles found during interviews.
Table 4 presents the mean similarities of participants’ groupings to the groupings based on the theoretical criteria. The difference between participants’ groupings’ similarity to the two best-matching theoretical criteria—role and phase in data flow—is statistically significant (paired t test, t = 3.157, df = 11, p = .0091). Because roles match best the participants’ groupings and the similarity between roles and phase in data flow is 0.45, it is evident that also phase in data flow gets a high similarity score with the participants’ groupings. Table 4. Similarities of participants’ groupings to the theoretical criteria. Theoretical criterion Role Phase in data flow Form of assignment Naming convention
Mean 0.51 0.38 0.19 0.11
S.D. 0.15 0.11 0.05 0.03
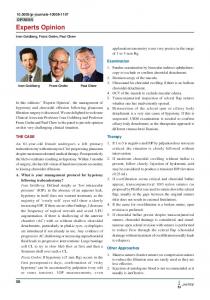
In order to obtain a general view of the groups, we applied hierarchical cluster analysis. This analysis method has been used by several researchers to understand if mental representations are organized following a significant set of groups (e.g., [15, 16]). We used the program EZCalc [17] to produce a dendrogram that depicts the frequency of variables occurring in the same groups. This technique does not allow a variable to be included in several groups, so the following adjustments were made:
PPIG 2005 Sussex University
www.ppig.org
Sajaniemi and Navarro Prieto
fixed value
0.0
0.2
0.4
0.6
0.8
1.0
0.0
0.2
0.4
0.6
0.8
1.0
monthsToProcess base pierLength largePowerOfTwo norm dayNbr currDigit
most−recent holder
command current testRes ship previous
follower
preceding yesterday lastShip
most−wanted holder
smallDigit closest maxDelta longest greatest
gatherer
used numericValue total count currentMonth
stepper
month powerOfTen powerOfTwo daysToBeginning daysAtEnd
Fig. 2. Result dendrogram of the hierarchical cluster analysis.
– For the participant with 21 extra cards, multiple occurrences of variables in the “computing” group were discarded (because the participant said that those should perhaps have been excluded but “I just started to make it this way and did not want to start again”). – The participant with 17 extra cards was excluded totally because we could not find good reasons to exclude the extra cards in any meaningful way. – In all other cases with a card in two groups, the variable was excluded from both groups and marked “the participant does not understand what this card means”—an option allowed by the analysis program. Figure 2 depicts the results of the hierarchical cluster analysis. The sooner the lines emanating from variables at the left hand side of the dendrogram are joined, the more frequently the variables occur together in the groups formed by the participants. As seen in the Figure, most of the variables are clustered according to the roles defined in Section 2. The last two variables—daysToBeginning and daysAtEnd— were supposed to be a follower and a gatherer, respectively. However, they allow several interpretations in the role theory. The supposed way to look at them was to see daysAtEnd as a gatherer accumulating the lengths of individual months, and to see daysToBeginning as a follower of daysAtEnd. On the other hand, the lengths of
PPIG 2005 Sussex University
www.ppig.org
Sajaniemi and Navarro Prieto
individual months are obtained from an array with values listed in the declaration, and hence the value sequences of both daysToBeginning and daysAtEnd are predictable, and these two variables can be considered as steppers also. And indeed, on the .35 level they are clustered with other variables that are steppers in the role theory.
5
Discussion
The results show that roles explain the overall behavior of the participants in the card sorting task well: it was the closest of the theoretical sorting criteria and matched the result of the hierarchical cluster analysis. This does not, however, necessarily mean that roles would be part of experts’ programming knowledge. Therefore we will look more closely at the groups formed by the participants and the descriptions of the criteria they used. Only if these descriptions support role theory, roles can be argued to belong to expert programmers’ knowledge. Roles are based on the behavior of variables. Thus the use of behavior principle in sorting variables is an indication of role-like thinking. Other sorting principles, e.g., utilization of variables, do not support the existence of roles even though they may in some cases yield the same groups. It is therefore most important to analyze whether groups are formed using behavior as sorting criterion. In the following we will look separately at every role in the investigation: its existence in the participants’ groups, relation to various sorting criteria, and different versions suggested by the participants. Fixed value: Eleven participants put essentially all fixed values in one group and referred to it usually as “constant” or “don’t change after initialization”. One participant called the group “set-up” and another explained: P09: They are constants [because their value does not change] but also in the sense that if they have a different value then the execution of the program changes in a radical way [i.e., there is a change in the control flow]—usually this also, but not necessarily always. Thus constants can be described not only by their behavior—no change after initialization—but also by their common utilization to control a program. On the other hand, one participant used his testing strategy as his sorting criterion and he sorted constants together because they do not change and hence need no special attention in debugging. Thus the same group of fixed values can be obtained by several sorting criteria: behavior (i.e., role), utilization, and testing strategy. In Figure 2, the first five variables consist of the fixed values of the programs. The first, monthsToProcess, is used to control the number of rounds in a loop whereas the others are “magical values” needed in calculations but with no special control function. The dendrogram supports the above quotation that there are two subclasses of fixed values: those controlling execution and those giving, e.g., domain dependent constants. Thus the main criterion may be based on behavior, utilization, or testing strategy, but the subcriterion is based on utilization. However, the difference between the subclusters is small in the dendrogram.
PPIG 2005 Sussex University
www.ppig.org
Sajaniemi and Navarro Prieto
Most-recent holder: There were six most-recent holders in the programs. Five of them are obtained through input whereas one, dayNbr, is obtained from a random number generator. Four participants identified all these variables as “input”. The inclusion of dayNbr indicates that their view of the group extended traditional input even though they had no name for the more general concept. One participant used the term “current item”, which captures the idea of most-recent holder perfectly, and divided it into two subgroups: “current item to limit looping” and “current item [used in some other way]”. Thus he used two sorting criteria simultaneously: behavior criterion with a subdivision based on utilization. Six participants did not put dayNbr in the same group with inputs, and, moreover, half of them included in the input group two variables, previous and preceding, which get their initial values through input but are thereafter followers. Thus their groups do not correspond to the idea of most-recent holders but represents pure input. The difference is important: most-recent holders can be recognized by behavior criterion only whereas pure input can be obtained by several sorting criteria: data flow, programming strategy, and testing strategy. In the cluster of Figure 2, the difference between most-recent holder and input is reflected by the loose connection between dayNbr and other most-recent holders. The connection is, however, stronger than any of the between-role connections in the dendrogram. Follower: Followers were recognized by four participants who named the group as “previous values”, “history data”, or “state maintenance”, i.e., who were using behavior as their sorting principle. In Figure 2, the variables previous and preceding form their own subgroup supposedly because they are first initialized through input—a behavior not typical to followers. The cluster is, however, clear. One participant named the group very differently: “important data to be used later” and included also a gatherer in his group. His criterion was based on the lifetime of values even though it happens to capture almost the same variables as the follower role. Most-wanted holder: There were five most-wanted holders in the programs. Three of them (maxDelta, longest, and greatest) are looking for the greatest value, and they form a tight cluster in Figure 2. It seems odd that smallDigit, which looks for the smallest value, is more loosely connected to the above three variables than closest, which looks for the closest value. However, smallDigit occurs in the program that the participants reported to be hardest to understand and its name does not reflect its purpose well. Perhaps some participants did not understand this variable well enough to sort it correctly. Four participants sorted most-wanted holders together and referred to the group as “extreme values” or “greatest etc.”. Thus they based their sorting on the behavior of the variables. One participant had groups named “largest value of interest” and “smallest value of interest”. He included in these groups one gatherer and one follower that limited the current area of interest. Thus he was using a mixture of behavior and utilization, and his group does not correspond to the notion of most-wanted holders.
PPIG 2005 Sussex University
www.ppig.org
Sajaniemi and Navarro Prieto
Gatherer: Three participants identified a group with a name referring to sums. Their idea was not restricted to a traditional total sum because their groups contained also either numericValue or used, which are not obtained by pure addition. The variable numericValue combines the effect of individual digits when reading a number digit by digit and involves also multiplication. The variable used describes the amount of pier usage when ships are arriving and departing and is obtained by additions and subtractions. Even though this behavior-based notion of accumulation is vague within the participants, it forms a cluster in Figure 2. One participant had a group for “intermediate results that are not destroyed but are gradually constructed” that is a generalization of the gatherer concept. In addition to gatherers, he put into this group two steppers (powerOfTwo and powerOfTen) that are updated using division, and a follower that is following a gatherer. He had also a phase in data flow-based group “output” containing two gatherers and all most-wanted holders, and this group had priority over other groups. Had he used behavior principle only, the output group would probably be combined with the other group resulting in a large group containing gatherers and most-wanted holders. This close relationship between the two roles can be seen in the clusters of Figure 2, too. Stepper: There were five steppers: two loop counters (count and currentMonth) limiting the number of rounds in a loop, one (month) counting how many times a loop is executed, and two (powerOfTwo and powerOfTen) controlling a loop and being updated by division. Three participants recognized these as a group and used names like “loop variables” and “counters”. Another three participants excluded powerOfTwo and powerOfTen from their groups; one of them however said: P07: These [powerOfTwo and powerOfTen] are kind-of counters. The clusters in Figure 2 demonstrate these subgroups of the stepper role. It is important to note that the variable month, which counts the number of rounds but does not control the loop, was included in participants’ groups. This demonstrates that they were using behavior principle (instead of utilization principle) resulting in the stepper role. One participant used the name “loop counters” and he put the variable month in another group, sums. Thus he was not using behavior principle but a utilization criterion. Controversial variables: There are two variables—daysToBeginning and daysAtEnd—that make up their own cluster in Figure 2. As described in Section 4, they allow several interpretations in the role theory. Thus, their roles can be understood differently by different persons. In the groups made by the participants of this investigation, they are clustered with steppers—an appropriate interpretation for both of them. Other roles: One participant, who sorted the variables with a criterion that combined behavior and utilization, was asked in the interview whether he could think of any other groups that he might use if he were sorting variables in his own programs. He replied:
PPIG 2005 Sussex University
www.ppig.org
Sajaniemi and Navarro Prieto
P11: Sometimes you have to store information about errors or error codes, in case that everything will not go well if it is more complicated [...] and you have to know that there has been errors ... This describes one-way flag, one of the four roles not covered in the investigation. Summary: All the six roles appearing in the materials were identified by at least some participants. However, there appears to be two sources of variation in the judgment of roles: what behavior do programmers perceive from the lifetime of a variable, and what behaviors are considered to be similar. We will look at these separately. An example of the first source of variation, what behavior is perceived, is given by the variable daysAtEnd that accumulates the lengths of individual months given in an array. One participant sorted it into a behavior-based group titled “intermediate values obtained through some expression” whereas another participant sorted it into a behavior-based group titled “intermediate results that are not destroyed but are gradually constructed”. The latter participant thus perceived that new values of the variable depend on its old values combined with some new data whereas the first participant did not see such a connection between the new and old values of the variable. Another example of differences in perceiving behavior was given in Section 2: a mathematician may consider a variable that traverses the Fibonacci sequence using addition as stepping through a known succession of values whereas a non-mathematician may consider it as an accumulation of previous values. Thus the behavior may be perceived differently by the two persons even though they look at the same variable, at the same operations on the variable, and at the same value sequence. The second source of variation stems from programmers’ different views of what behaviors are similar. For example, some participants considered repeated division by a constant to be similar to repeated addition by a constant (and thus sorted them together in a group corresponding to the stepper role), others considered these to be two different behaviors, and some were unsure (“these are kind-of counters”). This variation is manifested in vague role boundaries and in differences in the granularity of the roles. For example, one participant had a group for a coarser version of the gatherer role that contained steppers also. Roles are defined by the behavior of variables. In many cases, participants’ groups differed from roles because participants combined two principles, utilization and behavior, in their sorting criterion. Usually utilization principle was used to make a subdivision for a group obtained by behavior. However, roles can be easily found in the participants’ groups and in the result of hierarchical cluster analysis.
6
Conclusion
Previous studies have shown that roles of variables enhance learning to program and that computer science educators have little problems in learning the roles and assigning them to variables. In order to study whether roles actually are part of experts’ programming knowledge, we conducted a knowledge elicitation investigation where professional programmers studied programs and the resulting mental representations were elicited by card sorting and interviews.
PPIG 2005 Sussex University
www.ppig.org
Sajaniemi and Navarro Prieto
The materials in the investigation consisted of variables representing six different roles. Each of these roles could be identified in the groups of at least some participants. There was some variation but the concepts represented by the roles could be easily recognized in the groups. Two sources of variation were identified: differences in perceiving the nature of behavior based on the lifetime of a variable, and differences in considering the similarity of behaviors. Because the role theory defines roles as cognitive concepts, roles have no unique definitions and differences among interpretations are possible. Thus differences among participants do not invalidate the role theory. Roles could also easily be identified in the result of hierarchical cluster analysis; the only two exceptions consider variables which clearly have two different interpretations. Thus one may argue that roles are part of experts’ programming knowledge.
Acknowledgments This work was supported by the Academy of Finland under grant number 206574.
References 1. Ehrlich, K., Soloway, E.: An empirical investigation of the tacit plan knowledge in programming. In Thomas, J.C., Schneider, M.L., eds.: Human Factors in Computer Systems. Norwood, NJ: Ablex Publishing Company (1984) 113–133 2. Rist, R.S.: Knowledge creation and retrieval in program design: A comparison of novice and intermediate student programmers. Human-Computer Interaction 6 (1991) 1–46 3. Sajaniemi, J.: An empirical analysis of roles of variables in novice-level procedural programs. In: Proceedings of IEEE 2002 Symposia on Human Centric Computing Languages and Environments (HCC’02), IEEE Computer Society (2002) 37–39 4. Sajaniemi, J., Kuittinen, M.: An experiment on using roles of variables in teaching introductory programming. Computer Science Education 15 (2005) 59–82 5. Byckling, P., Sajaniemi, J.: Using roles of variables in teaching: Effects on program construction. In: The 17th Annual Workshop of the Psychology of Programming Interest Group (PPIG 2005). (2005) 6. Ben-Ari, M., Sajaniemi, J.: Roles of variables from the perspective of computer science educators. In: The 9th Annual Conference on Innovation and Technology in Computer Science Education (ITiCSE 2004), Association for Computing Machinery (2004) 52–56 7. Ca˜nas, J.J., Antoli, A., Quesada, J.F.: The role of working memory on measuring mental models of physical systems. Psicologica 22 (2001) 25–42 8. Robertson, J.: Information design using card sorting. http://www.steptwo.com.au/papers/cardsorting/ (2001) 9. Cordingley, E.S.: Knowledge elicitation techniques for knowledge-based systems. In Diaper, D., ed.: Knowledge Elicitation: Principles, Techniques and Applications. Chichester, U.K.: Ellis Horwood Ltd (1989) 89–178 10. Davies, S.P., Gilmore, D.J., Green, T.R.G.: Are objects that important? The effects of expertise and familiarity on the classification of object-oriented code. Human-Computer Interaction 10 (1995) 227–248 11. Pennington, N.: Stimulus structures and mental representations in expert comprehension of computer programs. Cognitive Psychology 19 (1987) 295–341
PPIG 2005 Sussex University
www.ppig.org
Sajaniemi and Navarro Prieto
12. Green, T.R.G., Cornah, A.J.: The Programmer’s Torch. In: Human-Computer Interaction INTERACT’84, IFIP, Elsevier Science Publishers (North-Holland) (1985) 397–402 13. Sajaniemi, J.: Roles of variables home page. http://www.cs.joensuu.fi/˜saja/var roles/ (2004) (Accessed Dec. 22th, 2004). 14. Sajaniemi, J., Navarro Prieto, R.: An investigation into professional programmers’ mental representations of variables. In: The 13th IEEE International Workshop on Program Comprehension (IWPC 2005), IEEE Computer Society Press (2005) 15. Rist, R.S.: Plans in programming: Definition, demonstration and development. In Soloway, E., Iyengar, S., eds.: Empirical Studies of Programmers, Norwood, NJ: Ablex Publishing Company (1986) 28–47 16. Robertson, S.P., Yu, C.C.: Common cognitive representations of program code across tasks and languages. International Journal of Man-Machine Studies 33 (1990) 343–360 17. Dong, J., Martin, S., Waldo, P.: A User Input and Analysis Tool for Information Architecture. http://www-3.ibm.com/ibm/easy/eou ext.nsf/Publish/410 (2004)
PPIG 2005 Sussex University
www.ppig.org