RUBIK: Efficient Threshold Queries on Massive Time Series Eleni Tzirita Zacharatou† , Farhan Tauheed‡∗, Thomas Heinis¶∗ , Anastasia Ailamaki† †´
Ecole Polytechnique F´ed´erale de Lausanne, Switzerland ‡ Oracle Labs Zurich, Switzerland ¶ Imperial College London, United Kingdom
ABSTRACT An increasing number of applications from finance, meteorology, science and others are producing time series as output. The analysis of the vast amount of time series is key to understand the phenomena studied, particularly in the simulation sciences, where the analysis of time series resulting from simulation allows scientists to refine the model simulated. Existing approaches to query time series typically keep a compact representation in main memory, use it to answer queries approximately and then access the exact time series data on disk to validate the result. The more precise the in-memory representation, the fewer disk accesses are needed to validate the result. With the massive sizes of today’s datasets, however, current in-memory representations oftentimes no longer fit into main memory. To make them fit, their precision has to be reduced considerably resulting in substantial disk access which impedes query execution today and limits scalability for even bigger datasets in the future. In this paper we develop RUBIK, a novel approach to compressing and indexing time series. RUBIK exploits that time series in many applications and particularly in the simulation sciences are similar to each other. It compresses similar time series, i.e., observation values as well as time information, achieving better space efficiency and improved precision. RUBIK translates threshold queries into two dimensional spatial queries and efficiently executes them on the compressed time series by exploiting the pruning power of a tree structure to find the result, thereby outperforming the state-of-the-art by a factor of between 6 and 23. As our experiments further indicate, exploiting similarity within and between time series is crucial to make query execution scale and to ultimately decouple query execution time from the growth of the data (size and number of time series).
1.
INTRODUCTION Time series are becoming increasingly ubiquitous in many
∗
This work was done while the author was at EPFL.
Permission to make digital or hard copies of all or part of this work for personal or classroom use is granted without fee provided that copies are not made or distributed for profit or commercial advantage and that copies bear this notice and the full citation on the first page. Copyrights for components of this work owned by others than the author(s) must be honored. Abstracting with credit is permitted. To copy otherwise, or republish, to post on servers or to redistribute to lists, requires prior specific permission and/or a fee. Request permissions from
[email protected].
SSDBM ’15, June 29 - July 01, 2015, La Jolla, CA, USA c 2015 Copyright held by the owner/author(s). Publication rights licensed to ACM.
ISBN 978-1-4503-3709-0/15/06. . . $15.00 DOI: http://dx.doi.org/10.1145/2791347.2791372
applications across different domains, ranging from finance (e.g., stock information) to science (e.g., sensor readings). Increasingly powerful hardware, e.g., precise instruments or sensors and more powerful computers, lead to ever more and longer time series being recorded. The amount of time series data is arguably growing the fastest in the simulation sciences where increasingly powerful supercomputers as well as nearly unlimited storage capacity encourage scientists to simulate consistently bigger models (more data points) for longer periods (increasing number of time steps), resulting in a rapidly growing number of increasingly long time series. Already today scientists are overwhelmed with this deluge of time series data and tools for their efficient analysis are pivotal to enable scientific breakthroughs [14]. Efficiently querying the wealth of time series data is crucial to extract knowledge, particularly in the simulation sciences where the number and length of time series grow rapidly. Only analyzing the time series enables the simulation scientists to refine their models and to make them more realistic. Unfortunately not all data resulting from a simulation can be analyzed in great detail, but luckily not all data is equally interesting or important either. Typically only small subsets of the time series data are interesting and it is sufficient to find and analyze in detail these subsets. The challenge we are consequently addressing is to find interesting time series using threshold queries, i.e., time series where the observed value exceeds or falls below a threshold. Subsequently, the interesting subsets can be analyzed in detail with state-ofthe-art analysis methods. The goal of the approach we develop in this paper is to find the interesting time series and, in them, interesting periods of time. More formally, we define a time series as a discrete set of observations X = x1 , x2 , ...xn at consecutive time steps t = 1, 2...n (ordered in time). Examples of time series include temperature measurements over time, stock tickers, electrocardiograms and others. Given a set of time series XN and a query q with a threshold o for the observation as well as an upper and lower bound tu and tl (with tu ≥ tl ) for time, we want to find all time series X ∈ XN where xt satisfies the following conditions: xt ≥ o and tl ≤ t ≤ tu (time-bounded threshold query). The approach of the state-of-the-art is to compress the time series data (usually lossy) and use the compressed data as an index to answer queries approximately. Approximate answers, typically guaranteed not to allow for false dismissals, are then validated by reading the exact time series from disk. Clearly, the more precise the approximation, the fewer false positives and therefore the fewer slow reads from disk are necessary. Most state-of-the-art approaches, however, are designed for time series similarity queries and therefore
compress along the temporal dimension (for example averaging discrete time steps [4]) to avoid the curse of dimensionality [9]. Sacrificing temporal resolution when executing threshold queries, however, leads to an excessive number of false positives and, even worse, to false dismissals because in a reduced feature space the original interval where the time series exceeds a threshold cannot be identified. RUBIK, the approach we develop, does not sacrifice temporal resolution to compress, but instead exploits that many time series are, in general and in the simulation sciences in particular, very similar to each other. RUBIK therefore encodes the time information at the highest resolution and uses binning to discretize the observation values of the time series, indexes the resulting range encoded bitmaps (representing the time series) with a Quadtree [17] and finally compresses the leaves of the Quadtree using Word Aligned Hybrid (WAH [21]). Queries can then efficiently be executed on the compressed Quadtree as two dimensional spatial range queries. Exploiting the similarity between time series and representing them using a Quadtree allows for a substantially more efficient compression while preserving time resolution and faster query execution. Using the same space budget, RUBIK executes queries 9 times faster than the state-of-the-art and the trend indicates that query execution time with RUBIK will increase considerably slower than related approaches as datasets grow rapidly. The main contribution of RUBIK consequently lies in transforming a time series threshold query problem into a two-dimensional bitmap problem. Additionally, by grouping the time series and decomposing each group collectively using a Quadtree, RUBIK exploits the similarity between time series to reduce the size of the bit representation while maintaining high precision as otherwise the number of false positives imposes an undue penalty on the query execution (as is the case for competing approaches). Thanks to the representation as a Quadtree, queries with time and observation value predicates can be translated into efficient spatial range queries. Doing so enables the evaluation of both predicates at the same time while the query execution in related work evaluates predicates sequentially, losing early filtering power. The remainder of this paper is organized as follows. In Section 2 we review related work on time series indexing and querying methods and in Section 3 we motivate RUBIK. We give an overview over RUBIK in Section 4 and then discuss in detail the indexing process in Section 5 as well as query execution in Section 6. Before demonstrating the performance of RUBIK in Section 7 we discuss configuration considerations and we finally draw conclusions in Section 8.
2.
RELATED WORK
Indexing time series has received considerable attention in recent years [16]. In most time series analysis tasks the major cost factor is access to the disk. The general framework consequently is to use a compressed representation of the time series in main memory to answer queries approximately. The approximate answers are then verified by accessing the exact candidate time series on the disk. An ideal representation can give precise answers and makes all access to disk unnecessary. In case a representation only provides approximate answers, all correct results need to be included in the answer but at the same time false positives should also be minimized (and therefore unnecessary disk accesses). Clearly there is a trade-off between the size of the representation and the quality of the answers, i.e., number
of false positives. In the following we discuss related work and distinguish between approaches based on whether they are designed to use lossy compressions (through dimensionality reduction) or whether they reduce the size of time series through lossless compression.
2.1
Lossy Compression
The majority of the work for indexing time series has focused on determining similarity between time series in general and pattern/subsequence matching in particular. Almost all approaches for calculating similarity between time series index all time series with high-dimensional indexes where each time step equals a dimension. To ensure efficiency – indexes do not scale well to very high dimensions [9] – many approaches to time series mining reduce the number of dimensions, i.e., they divide the time series into segments (along the temporal dimension) and summarize each segment. Summarizing the time steps to reduce dimensionality also compresses the time series. A first class of approaches is data adaptive, i.e., the approaches encode time series individually to minimize the error of the encoding. APCA [11], for example, divides each time series into segments of variable length along the time dimension and encodes each segment with its mean. SAX [4, 12] (and iSAX) builds on the idea of PAA [10] and APCA but uses vertical segmentation of the series (i.e., the definition of breakpoints) to minimize the error for each segment (and thus for the entire time series). SAX also uses a symbolic representation of time series which has the advantage of lower error bound guarantees, i.e., the distance measure on the representation is always equal or smaller than the distance measure on the real data. Many data mining approaches can thus be used directly on the representation as they will only provide false positives, but no false dismissals. To compute the similarity between time series, MVQ [15] identifies frequent subsequences, i.e., codewords, in the time series and assigns each of them a symbol. Each subsequence in time series can then be represented by the codewords (or their symbol) its subsequences resemble the most, yielding a very compact encoding. Because it is difficult to find a suitable resolution (codeword length), MVQ uses several resolutions and organizes the encoding hierarchically, i.e., each frequent subsequence contains shorter frequent subsequences. The distance, or similarity, between two time series is computed based on the weighted frequency of the occurrence of codewords in either time series. GAMPS [7] uses the insight that many time series, particularly resulting from sensors, are similar or at least use similar templates (a subdivision of time series into segments of consecutive time steps). To compress the time series data the approach identifies frequent segments (also referred to as templates) among all time series. Each time series is finally represented as a collection of templates (using scaling), considerably reducing their size. A second class of approaches is non data adaptive, i.e., it encodes all time series with the same encoding (independent of their individual characteristics). Approaches based on the discrete fourier transformation (DFT) [6] (or on discrete cosine transformation) attempt to preserve the main characteristics of the time series. Fourier transformation is used to extract dominant features (and to reduce the dimensionality) that are then indexed, i.e., their minimum bounding rectangle (MBR), with a spatial index (R*-Tree [2]). Features of subsequences to be matched are also extracted with
DFT and the resulting MBR is executed as range query on the spatial index. Approximation with chebyshev polynomials [3] essentially interpolates the time series (or trajectories) with chebyshev polynomials. Chebyshev polynomials have the advantage that they are easy to compute and have lower bound guarantees. For smooth trajectories, i.e., time series of measurements, interpolation with Chebyshev polynomials outperforms APCA and PAA [3].
2.2
Lossless Compression
Arguably the most renowned indexing approach using compression [21] for scientific data as well as time series is FastBit [20]. FastBit uses binning and encoding, i.e., discretization, on the time series. The resulting bitmaps are compressed using word-aligned hybrid (WAH) compression. Compared to other bitmap compression schemes, WAH strikes a good balance between space and time efficiency. Threshold queries can efficiently be executed on the compressed bitmaps but because the compression (the binning) is lossy, candidate time series have to be retrieved and tested in detail. Detrimental to performance, however, is that the time information has to be indexed separately. Queries on the observation values therefore cannot exploit the pruning power of the time predicate early and vice versa.
3.
MOTIVATION
Scientific applications produce so much data today that we can no longer afford to analyze all of it in great detail. All the more important are threshold queries to find interesting events in the deluge of time series originating from scientific applications that can then be analyzed in all necessary detail. Despite being very simple, their efficient execution is crucial for explorative access to time series data.
3.1
Limitations of Related Work
The state-of-the-art for indexing time series has been primarily designed for time series mining, i.e., testing for similarity and subsequence matching. To avoid the curse of dimensionality, time series mining approaches [11, 4, 15, 6, 3] typically reduce the dimensionality by segmenting each time series and approximating each segment with a value a (e.g., in PAA [11] a is the average of all observations in the segment). Both segmentation and approximation, however, are detrimental to performance of time bounded-threshold queries q. Segmentation leads to false positives as the approximation a may fall above the observation threshold of q, but not within the time thresholds. Even worse, approximation can cause false dismissals. To avoid any false negatives, the observation thresholds need to be adjusted with the error e, the biggest difference between any observation and the approximation a of its segment. Adjusting the observation threshold o, however, leads to considerably more false positives as the threshold is relaxed to o − e. Compression approaches like GAMPS [7] also rely on segmentation as well as approximation and thus inherit the same problem like the time series mining approaches discussed before. Approaches like FastBit [20], on the other hand, do not index temporal information per se, meaning that a separate index on time steps needs to be built. Clearly the pruning power of the time predicate cannot be used when executing the query using the observation value predicate and vice versa. Further detrimental to the performance of FastBit is that it uses run-length encoding, making the eval-
uation of the time predicate directly on the compressed data impossible. As a consequence, two separate queries have to be executed on either index directly and the result needs to be combined. Additionally, FastBit and other bitmap based approaches do not exploit the full potential of compression because they treat time series individually. As already the work in the context of GAMPS [7] shows, time series frequently have considerable similarity between them and a compression between time series results in similar (if not better) space efficiency compared to state-of-theart approaches. Preserving temporal resolution (and avoiding coarse approximation) is key to execute time bounded queries without undue overhead resulting from false positives. As a consequence, RUBIK primarily compresses between similar time series but also the time series themselves without losing the temporal resolution.
3.2
Motivating Application
Many spatial simulations produce time series as output. In a spatial simulation of material deformation based on a mesh [1], for example, the temperature (as well as the change in position) observed of every mesh vertex is recorded over time. If the temperature increases at a vertex v in the mesh as a result of the deformation, the temperature at neighboring vertices N connected to v in the mesh via edges will increase as well. The time series measuring temperature at each neighboring vertex n ∈ N of v will consequently resemble each other. Similarly, the simulation of earthquakes [18] based on meshes produces multitudes of time series with a high degree of similarity. More interestingly to us, and driving the development of RUBIK, are the time series resulting form the simulation of brain activity. We collaborate with neuroscientists in the Blue Brain project (BBP [13]) who simulate the propagation of voltage through very fine-grained models of the neocortex populated with millions of neurons. Also in this scenario, voltage at two neighboring neurons (connected through synapses over which the voltage leaps) is similar at one time step in the simulation and consequently the time series from neighboring neurons will also be similar. Crucial for making any approach to time series analysis scale in the future is to compress along both dimensions where time series are growing, i.e., the number of time steps and the number of time series. When growing the models, scientists not only increase the size (spatial extent) of their models, but also increase their resolution by orders of magnitude [8] as the same shapes will be represented with meshes featuring a substantially higher number of vertices (and edges). The trend to higher resolution models will also lead to more time series (typically one time series per vertex). The resulting time series will, however, have a high degree of similarity because the vertices are closer in space and compression methods must exploit the similarity to achieve good compression in face of growing models. At the same time, a scalable approach to threshold query execution must compress along the time dimension to address increasingly longer simulations and the resulting time series. To tackle this growth, exploiting the similarity between consecutive time steps in a time series is pivotal. Time series in a broad range of applications, particularly resulting from the observation or simulation of natural phenomena (e.g., brain simulations, earthquakes, meteorology etc.), are in general smooth, i.e., the observation values of most consecutive time steps only differ by a little, but they have
massive spikes.
4.
RUBIK OVERVIEW
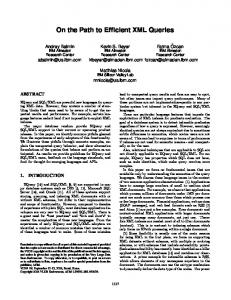
To enable efficient and scalable threshold query execution in the face of growing time series (number and length), RUBIK takes advantage of the similarity within time series and between time series in general and of time series resulting from the simulation sciences in particular. Given a specific time step t, the values across different time series are similar at t; also inside a given time series, the values between consecutive time steps do not vary much except for spikes (sudden surges, e.g., of voltage, movement etc.). RUBIK exploits the similarity of time series by discretizing them as well as indexing and compressing them with a Quadtree. Threshold queries based on time and observation value predicates used to find interesting time series can then be translated into efficient two dimensional range queries on the Quadtree. Crucially, RUBIK preserves the time resolution completely and thereby avoids considerable overhead due to false positives. More precisely, RUBIK first discretizes/bins the time series along the observation dimension (the time dimension is already implicitly discretized). Each binned time step ts of a time series is then range encoded: all bins below the observation value o at ts are set to 1 while the bins greater or equal to o are set to 0. Doing so for all time steps in a time series essentially translates the time series into a two dimensional bitmap with the area under the curve filled with 1’s. The time dimension is implicitly discretized already due to the discrete time steps in simulations or due to epochs in sensor network deployments. Figure 1 shows the binning and range-encoding of a time series. By discretizing and range-encoding the time series RUBIK essentially precomputes a set of answers for threshold queries that align with the discretization.
Figure 1: A two-dimensional time series bitmap.
Binning and range-encoding the time series is crucial for compression as otherwise time series almost always differ slightly, rendering efficient compression impossible. Inspired by the Quadtree-based decomposition of bitmap images [5], we notice that Quadtree decomposition can be applied to compress the bitmaps representing the time series. However, this technique compresses each bitmap individually and does not exploit the similarity between the time series. To overcome this limitation, we make clusters of binned time series,
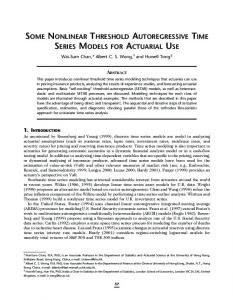
i.e., each cluster comprises of several binned time series (in fact the bitmaps corresponding to the time series). Doing so essentially results in the creation of a 3-dimensional bitmap where the third dimension is the number of time series in the cluster. Ultimately, we apply the Quadtree decomposition strategy collectively on the whole cluster of bitmaps, that is we hierarchically divide each cluster into four blocks of equal size. The Quadtree decomposition strategy is adapted to accommodate the additional third dimension (number of time series). If a 3D block of bits contains 0’s and 1’s (in any of the three dimensions), then it is recursively subdivided further in the time and the observation dimension. If, on the other hand, it only contains either 1’s or 0’s then it is no longer divided. Figure 2 illustrates (using the red lines) how the cluster of time series is divided into two along the time and the observation dimension. RUBIK compresses beyond binning and, in case a block only contains 0’s and 1’s, only stores this information. Using Quadtree decomposition on a 3D bitmap can lead to cases where a block cannot further be subdivided in the time and the observation dimension, yet contains 0’s and 1’s. To efficiently deal with such blocks and improve space efficiency RUBIK uses Word Aligned Hybrid compression (WAH [21]) on the mixed bitvector. Time%%%
Number%of% %Time%Series%
Observa,on% Bin% 1%
1%
1%
1%
1%
1%
1%
1%
1%
1%
1%
1%
1%
1%
1%
1%
1%
1%
1%
1%
Figure 2: A cluster of time series bitmaps, split along the time and observation dimension with the purpose of identifying blocks enclosing the same bit value.
To execute a threshold query with observation and time predicates, a query on the Quadtree built on the time series is executed. Each threshold query is translated into a two dimensional range query bounded by the time and observation predicates. During query execution, RUBIK first discretizes the observation threshold and then traverses the Quadtree performing query execution on the compressed data. If the bin b where the query observation threshold falls is enclosed in blocks that contain only 1’s for all the time steps inside the query range, all the time series are returned. If a mixed WAH compressed block is encountered, only the time series that contain a 1 in b are returned. Like many related work approaches, RUBIK also works on a lossy compression/representation of the time series data, thus retrieves approximate results and consequently has to verify a subset of the results by reading the exact time series from disk.
5.
RUBIK INDEXING
Indexing with RUBIK has three basic steps: first the binning & encoding of each time series, second, grouping similar time series into clusters and finally, indexing (as well as compressing) each time series cluster with a Quadtree.
5.1
Discretization/Binning
Each time series is discretized along the observation dimension into n bins B where each bin b ∈ B has an upper and lower boundary bu and bl. RUBIK uses range encoding to encode the discretized values as bitmaps, i.e., given the observation value v at a specific point in time, all bins b ∈ B with both boundaries smaller than v will be set to 1 whereas all bins with any boundary greater than v will be set to 0. Algorithm 1 illustrates the discretization process with pseudocode. For the purpose of efficiency, RUBIK’s implementation wraps the binning/encoding into the building of the Quadtrees, thereby accelerating the indexing process. Input: ts: array containing a time series l: number of time steps of time series binshigh : array of higher bin boundaries b: number of bins Output: bitmap: discretized time series (two dimensional array) for i = 0; i < l; i++ do for j = 0; j < b; j++ do if ts[i] ≥ binshigh [j] then bitmap[i][j] = 1; end else bitmap[i][j] = 0; end end end return bitmap Algorithm 1: RUBIK Algorithm for Discretization of one Time Series The sizes of the bins can vary, depending on the dataset, the query workload or both. If, for example, the observation thresholds of queries are frequently in the same range, the precision of the index can be improved if the bins in the range are chosen smaller than outside. Similarly, if the time series have all or most of their observation values in a small range at most points in time, precision can be equally improved by using more (but smaller) bins in this range, thereby taking advantage of RUBIK’s ability to use bins of variable width.
5.2
Clustering Time Series
To achieve further compression RUBIK groups similar time series into clusters and indexes each cluster individually. Several approaches have been developed in the past to determine similarity between time series. All of these approaches can be used to group similar time series into clusters. GAMPS [7], for example, clusters time series based on shared subsequences. A simpler approach is to use the inherent local similarity in the time series. As we argued previously, time series from nearby locations in simulation datasets are frequently very similar and so it suffices to use the distance between the locations where the time series have been recorded to compute the clusters. More elaborate approaches could be used for the clustering, but the benefit is not substantial enough to justify the overhead. In RUBIK we use a coarse grained binning to determine similarity between time series. In essence RUBIK calculates for each time series a coarse grained binning in both dimensions corresponding to the Quadtree representation at a certain level of resolution (an example is shown in Figure
3) and assigns all time series with identical representations to a cluster. A minimum cluster size is set beforehand so that very small clusters (or single time series) are grouped together as one.
Figure 3: Coarse-grained discretization for clustering.
The number of clusters (and consequently also their size) is therefore a crucial configuration parameter. The smaller the clusters are, the more similar can the time series in them be and the higher is the compression rate for the cluster (despite WAH not compressing small clusters as well as bigger ones). At the same time, however, the more clusters there are, the more space is spent on data structures (like the Quadtree hierarchy) and the more Quadtrees need to be queried. Clearly there is an interesting trade-off to be explored between improved compression ratio that the Quadtree decomposition can achieve in each cluster and increased overhead for querying and storing several Quadtrees.
5.3
Quadtree Index
RUBIK’s indexing process builds a compressed Quadtreelike structure by recursively splitting the cluster of bitmaps representing the time series along the observation and time dimension.
5.3.1
Data Structure
While indexing RUBIK builds a Quadtree that stores in each node the information about the enclosed bits of the bitmap, i.e., whether they are only 1’s, only 0’s or both. More precisely, if a node only contains 1’s it is labeled All 1 and there is no need to store all the enclosed individual bits. Similarly, if a node would contain only 0’s, it is labeled All 0 and the enclosed bits do not need to be stored individually. In either case, the node in fact becomes a leaf node as there is no need to partition it further. When a node contains both 0’s and 1’s it is labeled Mixed and RUBIK tries to split it in both the observation and time dimension. Only if this does not succeed, the actual values are stored in the leaf node in a bit bucket. Consequently only the mixed leaf nodes of the tree store actual bits in bit buckets. As the bit buckets are mixed, they cannot be substituted by a single label and we use WAH to reduce their size. Figure 4 shows an example of the data structure used in memory: the leaf nodes either store the (compressed) bit bucket itself or the information that all bits are 1’s or 0’s. When writing the Quadtree to disk, it is translated to a leafless Quadtree in which the internal nodes contain their children. To avoid storing pointers (from nodes to their children), the leafless Quadtree on disk has fixed sized nodes, making nodes directly addressable through the calculation of their address. Mixed nodes are stored in a
Mix%
Mix%
All%1%
Bit%Bucket%
All%0%
All%0%
Mix%
All%1%
All%1%
All%1%
0% 0% 0% 1% 0%
Figure 4: Example Quadtree built by RUBIK in main memory.
separate file on disk. A hashmap maps a mixed node in the tree to its offset in the file containing the mixed nodes.
5.3.2
Indexing Algorithm
RUBIK indexes the discretized time series by recursively splitting the cluster of bitmaps (representing time series) along the observation and time dimension into blocks of equal size. If a block only contains either 1’s or 0’s, the block is not split any further and the compressed block is stored (labeled as all 1’s or all 0’s) in the tree structure. The corresponding node in the tree is a leaf node as it will not be split any further. If, on the other hand, the block is mixed, it is split in both dimensions again. The corresponding node in the tree is labeled as mixed. Once a mixed node can no longer be split further because it has length one in either the observation or time dimension, its literal representation is compressed with word aligned hybrid (WAH) and is stored in the tree as a leaf node.
Figure 5: RUBIK splitting the example cluster in two steps.
Figure 5 illustrates how the cluster of discretized, rangeencoded time series is split in two steps. Starting with the cluster depicted at the top, building the tree is done until the blocks can no longer be divided (after two splits in this example). Each node in the example is connected with the block it represents (dashed line). All blocks can be stored
compressed, except one that needs to be stored literal because the time series of the cluster have different binned values in the first time step. Algorithm 2 illustrates the process in pseudocode: the cluster of discretized time series is recursively split into smaller blocks until either all blocks are uniform (contain either only 1’s or only 0’s) or can not be split any further. The procedure starts by passing the cluster as well a null root node into Algorithm 2. Input: block: three dimensional array containing the clustered time series parent: parent node in the Quadtree structure Output: tree: tree structure representing the compressed cluster node = new node if (parent == null) then parent = node end else attach node to parent end if all one(block) then label node as all 1’s end else if all zero(block) then label node as all 0’s end else if block can be split then label node as mixed split block into 4 blocks along time and observation dimension RUBIK(block1 , node) RUBIK(block2 , node) RUBIK(block3 , node) RUBIK(block4 , node) end else apply WAH compression to block label node as mixed attach compressed block to node end end Algorithm 2: RUBIK(block, node) Indexing Algorithm Clearly, determining efficiently whether a block is uniform is key. RUBIK computes the type of a block as follows. It maintains two vectors T imeStepM in[] and T imeStepM ax[], each of which has the length equal to the number of time steps. Then RUBIK scans all the time series in the cluster and, for each time step ti , stores in T imeStepM in[ti ] the bin number that corresponds to the minimum value for that time step among all the time series, and stores in T imeStepM ax[ti ] the bin number that corresponds to the maximum value found for that time step. In other words, the two vectors record the bin numbers of the minimum value and maximum value for each time step among all the time series, respectively. Given a block between time steps t1 and t2 (t1 < t2 ) and observation bins b1 and b2 (b1 < b2 ), RUBIK iterates over [t1 , t2 ]. If every T imeStepM ax[ti ] is less than or equal to b1 , all the bins of this block have value 0 according the method of encoding used in RUBIK; or if every T imeStepM in[ti ] is greater than b2 , all the bins of this block have value 1; otherwise, the block has mixed values of
0 and 1. Instead of Quadtrees and WAH we could also use runlength encoding. Run-length encoding identifies a maximum run (consecutive bits) that have the same bit value and represents them with their bit value and a count instead of storing every bit separately. With RUBIK we attempt to do the same but in three dimensions, i.e., we find 3D areas with the same bit value. To simplify the procedure, we use a Quadtree which essentially predefines the maximum lengths of the runs in two out of the three dimensions. Remaining areas that are mixed (i.e., contain 1’s and 0’s) are compressed with WAH (in one dimension). This ability of the Quadtree to identify runs in three dimensions by adapting its decomposition strategy for a cluster of bitmaps is the main reason why we chose it as a core component of our approach. RUBIK could also use an Octree or a KD-Tree to encode the cluster and treat splitting as a three dimensional problem. Either approach would presumably decrease the depth of the tree as splitting in the third dimension (the number of time series) would essentially allow to identify uniform subclusters of time series and eliminate the need to subdivide nodes with bit values differing only in the third dimension. This would therefore also decrease the number of mixed bit buckets that need to be compressed individually. Initial experiments, however, showed that the potential of further decreasing the size of the cluster is small whereas the size of the tree structure increases (additional nodes for splitting along the third dimension). For example, splitting a block that only contains 1’s (or 0’s) in the third dimension (after it is already split in the observation and time dimension) unnecessarily increases the size of the tree structure without bringing any benefits.
6.
RUBIK QUERY EXECUTION
To execute a threshold query, RUBIK maps the query on the observation and time dimension and executes it on the Quadtree which summarizes a cluster of bitmaps (which represent time series). More precisely, RUBIK executes a spatial query which is bounded by the upper and lower bound tu and tl of the time predicate in the temporal dimension. In the observation dimension RUBIK identifies the bin b in which the observation threshold falls that is the upper observation bound of the query while the lower bound is b − 1 (the immediately lower bin of b). The first step of query execution consists of performing the spatial query on the Quadtree. The result of this step is a set of nodes that intersect with the query range. The second step of answering a threshold query consists of using the retrieved nodes in order to determine a set of potential and definite results. Any bitmap (i.e., time series) in the Quadtree that contains a 1 in bin b will definitely be in the final result as a 1 signifies that the actual value is bigger or equal to the upper bound of the bin. Any bitmap in the Quadtree that contains a 0 in bin b but a 1 in bin b − 1 potentially is a result as the actual value is bigger than the lower bound and smaller than the upper bound of bin b. Potential results need to be verified by inspecting the actual time series as the precise information is lost due to the discretization. All results which have a 1 in b will also have a 1 in b − 1, i.e., all definite results will also be reported as potential results. To ensure efficient computation of the result, RUBIK thus first identifies the definite result and then the potential result to finally only inspect difference of the two sets in detail (retrieving time series from disk
and analyzing them), i.e., the potential results without the definite ones. Figure 6 shows examples of a definite result with a 1 in b (left) and a potential result with a 0 in b and a 1 in b − 1 (right). While the two examples correspond to the same time series, the threshold queries are different (use different thresholds) resulting in two different dimensional queries (shaded). 0
0
0
0
0
0
0
0
0
0
0
0
0
0
0
0
0
0
0
0
0
0
1
0
0
0
0
1
0
0
0
0
1
0
0
0
0
1
0
0
0
1
1
0
0
0
1
1
0
0
Definite result
b b-1
b b-1
Potential result
Figure 6: Example of a definite result (left) and a potential result (right).
During query execution, RUBIK benefits significantly from the clustering of the bitmaps, as in the case of uniform nodes all the enclosed bits of the bitmaps have the same value and thus there is no need to examine them one by one. Operating on the WAH compressed bit buckets in order to determine the values of the individual bits is undoubtly more expensive. However, in case the query is only asking whether any time series exceeds the threshold but does not need to know which one does, decompressing and iterating over a bit bucket is not necessary, as the very fact that a node is labeled mixed implies that there must be at least one 1.
7.
EXPERIMENTAL EVALUATION
In this section we empirically evaluate the performance of RUBIK. We first describe the setup, the methodology and the configuration of the experiments. Then we use a real neuroscience dataset to test and evaluate the performance of RUBIK on a real world example, while we also compare it against FastBit. We focus on FastBit as it is the most broadly used index for the execution of threshold queries on time series. As a final test, we use a synthetically generated dataset, where we can control some basic characteristics of the time series.
7.1
Experimental Setup
Hardware: The experiments are run on Red Hat 6.3 machines equipped with 2 quad CPUs AMD Opteron, 64-bit @ 2700 MHz, 32 GB RAM and 4 SAS disks of 300GB (10000 RPM) capacity as storage. We only use one of the disks for the experiments, i.e., no RAID configuration is used. Software: RUBIK was implemented single-threaded in C++. Additionally a single-threaded application was implemented in C++ on top of the FastBit 2.0.1 API in order to load the data, build the indexes and query them. Setting: We experimentally compare FastBit’s bitmap indexing approach against RUBIK. We have implemented two different approaches to execute time-bounded threshold queries in FastBit. The first option is to use two separate indexes, one for the time dimension and one for the observation value. The second option is to use only one index for the observation value and filter the returned result according to the queried time-bound. This is possible as we are
dealing with time-stepped data which allows to map bits to time steps. The additional filtering is applied directly on the bitvectors. The choice between these two options is a tradeoff between storage and computation, because the bitmap index for the time dimension used in the first option can be considered as a set of pre-computed filtering masks while in the second option the required mask is computed on the fly according to the queried time boundaries. As discussed in section 5, different strategies could be used for choosing the bin boundaries. Since the discretization step is common for both FastBit and RUBIK, the same binning strategy is used for both approaches for a fair comparison. All bitmap indexes are range-encoded, so essentially a bitmap index contains bitvectors that are pre-computed answers to threshold queries with a specified precision configured at building time. FastBit was compiled without memory map support (using defined macros) in order to achieve a fair comparison as RUBIK does not support it. All the structures are initialized and the whole index is loaded into memory before querying so that it is guaranteed that no I/O operations are performed during the measurements. The data page size used for RUBIK is 96KB and 4KB for FastBit. Before each experiment, we clear OS caches and disk buffers.
7.2
Experimental Methodology
Neuroscience Dataset: The primary dataset used in our experiments is obtained from the simulation of brain activity, provided by the neuro-scientists in the Blue Brain Project(BBP [13]). The dataset represents the 6th layer of a rat neocortical column and contains 312349 time series. The electrical (action potential) simulation is carried out for 1000 time steps which is thus the length of each time series. In particular, each time series records sequentially the voltage value of a neuron at each time step within a given period of time. An important property of this dataset is that time series resulting from neighboring neurons have similar overall patterns. A sample (four time series) of this dataset is shown in Figure 7. The size of the binary file containing the time series is 1.2GB. Synthetic Dataset: To test RUBIK further we generated synthetic data based on simulated brain activity. Many models have been proposed for different neuron responses. Some of them are able to reproduce spiking and bursting behavior of known types of cortical neurons. They are based on ordinary nonlinear differential equations and are convenient for marked spiking behavior. We use a model more similar to our real data, i.e., we use a so-called resonate model. For producing simulated neuron responses we have considered the model proposed by A. Watson [19] for temporal sensitivity in visual perception. In our experiments we have used the impulse response of the model, when the excitation is a spike. A sample (four time series) of this dataset is shown in Figure 7. Micro-benchmark: The micro-benchmarks used in our experiments consist of 60 two-dimensional threshold queries which attempt to retrieve the time series of interest. Each threshold query has a time predicate specifying a time period between two time steps and a voltage predicate specifying a value range greater than a value selected randomly from all the possible voltage values. Approach: In order to obtain accurate results, the query processing consists of two phases, querying the index and then filtering to eliminate any false positives that the binning has introduced. We are focusing only on the first phase,
which essentially calculates two sets of results, one with definite results and one with potential results. The potential results determine which entries need to be verified by testing the full time series. The query execution time reported in all the experiments consists of the time required to count the number of definite results and the number of potential results. The time for identifying the exact location of the candidate results and filtering them is not included.
7.3
Comparative Analysis
In this section, we compare the performance of RUBIK and FastBit when a fixed space budget is provided. The space budget allocated to the indexes is fixed to 155MB. Given this space budget RUBIK is able to maintain an accurate in-memory index. For FastBit, we evaluate three different variants by using two indexes and varying the number of bins dedicated to the time information in {10, 25} and by using only one voltage index and removing the returned results that are outside the time range. We refer to them as FastBit10, FastBit25 and FastBitF respectively. First we build the indexes on the brain simulation dataset for both RUBIK and FastBit and measure the index sizes to make sure that they respect the space budget. Then we run all the 60 threshold queries in the micro-benchmark and measure the total query execution time for all the alternative approaches. Index Size: Figure 8 shows the index size of RUBIK and of the three FastBit variants. All the indexes built have a similar size due to the limitation of the space budget. For FastBit the size of the time index increases as the number of bins used for the time information increases, which results in the opposite trend for the voltage index, which is forced to sacrifice its resolution (going from 39 to 14 bins) in order to fit in the allocated budget. FastBitF and RUBIK exploit all the available space budget for the voltage information. As RUBIK is able to compress more it is able to use 128 bins, while FastBitF can only use 54. Query Execution Time: Figure 8 shows the total execution time of 60 threshold queries. The experiment shows that FastBit25 is slower than FastBit10. This is because FastBit10 does not always use the available time index because of its limited filtering power that renders it useless for some queries. Also, FastBitF is slightly slower than FastBit25 as building the mask used to filter on the fly incurs some processing overhead. Most importantly, however, RUBIK runs 6 to 9 times faster than the different variants of FastBit as it has more pruning power in both, the time and the voltage dimension. Accuracy: Figure 8 shows the percentage of hits (results that do not need to be verified) and the percentage of candidates (results that have to be verified by inspecting the time series) with respect to the total number of returned results. We observe that the choice of how the available budget is split among the time and the voltage information in FastBit does not have any significant impact on the accuracy. FastBitF exploits all the available budget for the voltage index, and subsequently filters out some of the candidates. Consequently, FastBitF is the FastBit variant with the best accuracy. However, the accuracy is still not as good as RUBIK’s, because FastBitF uses a smaller number of bins for the voltage index.
7.4
Scalability Analysis
In this section, we study the impact of parameter configurations and dataset characteristics on RUBIK. We vary,
Figure 7: Sample (four time series) of the neuroscience dataset (left) and the synthetic dataset (right).
Figure 8: RUBIK and FastBit index sizes (left), execution time (middle) and accuracy (right).
respectively, the number of time series, the length of time series, and the number of bins which allows us to test RUBIK with larger datasets, measure how its performance changes accordingly and how it compares to FastBit. For the following experiments, no fixed space budget is used. Instead, we use the same precision for both FastBit and RUBIK, i.e. both approaches use an equal number of bins with the bin boundaries being the same, and we measure the difference in the index size. Our previous experiment shows that the overall best FastBit variant is FastBitF, as for the same space budget it offers increased accuracy, while being only 1.4 times slower than the fastest variant (FastBit10). Consequently, in the rest of the experiments we only compare against FastBitF.
7.4.1
Scaling with Data Volume (increase in the number of Time Series)
We perform experiments on both the neuroscience and the synthetic dataset.
Neuroscience Dataset. In order to scale our original dataset with respect to the number of time series we use interpolation to increase the number of time series in the dataset. Starting with 312349 time series, we obtained two datasets containing double and four times the amount of time series respectively. Index Size: Figure 9 shows the sizes of the resulting indexes for each dataset. RUBIK’s index size scales sublinearly with the number of time series, that is, the compression rate increases as the number of time series increases. Consequently, the larger the size of the original time series
dataset is, the more compression gain RUBIK achieves. Query Execution Time: Figure 9 shows the total query execution time for FastBitF and RUBIK. As RUBIK groups time series, it scales well with the increase in their number because with only one Quadtree traversal the threshold condition is tested on an increasing number of time series. FastBit on the other side has to execute the query on increasingly longer bitvectors. As a result, the achieved speedup over FastBitF increases from 9 to 23. Query Execution Time Breakdown: Figure 9 shows a breakdown of the total execution time for RUBIK. The index operation stands for the time to perform a 2D spatial range query on the Quadtree (first step of query execution). The metrics stands for the time to compute an upper and a lower bound of the number of results (second step of query execution). The index operation time remains roughly constant, as adding more time series (which fall in the already existing clusters) does not affect the structure of the tree. On the other hand, the metrics time increases alongside with the increase in the data size, as each one of the tree nodes is now bigger and consequently the number of returned results that have to be counted is now higher.
Synthetic Dataset. In order to test the performance more thoroughly, we performed the previous experiment for RUBIK using the synthetic dataset. We first obtained a base dataset of 2.1GB containing 543900 time series, which we scaled up by interpolation. The sizes of the obtained datasets are shown in Figure 10. Index Size: Figure 10 shows the size of the indexed data
Figure 9: RUBIK and FastBit index sizes (left), execution time (middle) and RUBIK execution time breakdown (right) depending on the number of time series (neuroscience dataset).
Figure 12: RUBIK and FastBit index sizes (left) and query execution time (right).
Figure 10: RUBIK index and data sizes depending on the number of time series (synthetic dataset).
parison with FastBit on a bigger dataset, we also built FastBitF on the 8GB dataset which contains around 2 million time series. In this experiment, the memory in the machine that was used was not enough to build the index. The solution that FastBit proposes is to split the input in several partitions and build one index per partition. Figure 12 shows the index sizes and the query execution results. For FastBitF the results from different partitions are superimposed. In this case, RUBIK achieves a speedup of 20, while using half the space that FastBitF does (for the same binning).
7.4.2
Figure 11: RUBIK execution time breakdown depending on the number of time series (synthetic dataset).
and the index size. Clearly, as the dataset size increases, the compression ratio increases as well. Query Execution Time Breakdown The query execution breakdown of Figure 11 exhibits the same trends as in Figure 9. As we mentioned above, what causes an increase in the metrics time, is the fact that the number of results that need to be counted increases as more time series are added. Comparison with FastBit: In order to perform a com-
Scaling with Temporal Resolution (increase in the number of Time Steps)
In order to scale our original neuroscience dataset with respect to the number of time steps we used interpolation to generate longer time series. As a result we obtained two datasets with time series that are 1999 and 3997 time steps long respectively. Index Size: Figure 13 shows index sizes. We observe that FastBit’s WAH compression is able to exploit the increased similarity in the time dimension. Query Execution Time: Figure 13 shows the query execution time. We note that the time ranges of the queries are also stretched proportionally to the length of the time series. As FastBitF scales better than RUBIK with the increase in the number of time steps, RUBIK’s speedup decreases from 8.5 to 5.5. Query Execution Time Breakdown: Figure 13 shows a breakdown analysis of RUBIK’s query execution. The increase in the number of time steps results in a deeper Quadtree (as bitmaps become longer in the time dimension and more subdivision steps are required), which causes the index operation time to increase.
7.4.3
Scaling with Observation Value Resolution (increase in the number of Bins)
Figure 13: RUBIK and FastBit index sizes (left), execution time (middle) and RUBIK execution time breakdown (right) depending on the number of time steps (neuroscience dataset).
Figure 14: RUBIK and FastBit index sizes (left), execution time (middle) and accuracy (right) depending on the number of bins (neuroscience dataset).
We build the index of RUBIK on the entire brain simulation dataset with three different configurations of number of bins, namely, 128, 256, and 512. Index Size: Figure 14 shows the sizes of the different indexes built for both FastBitF and RUBIK when different numbers of bins are used. Remarkably, the index size of RUBIK with 256 bins is only slightly bigger than the one that FastBitF builds using only 128 bins. Also, we observe that the index size of FastBitF with 512 bins is 1.4G which is actually bigger than the indexed data itself (1.2G). Query Execution Time: In Figure 14 we observe that FastBitF’s query execution time is independent of the number of bins. No matter how many bitvectors the bitmap index has, FastBit only retrieves two of them during query execution (the bin b where the threshold falls as well as the immediately lower bin b − 1). RUBIK on the other side is influenced by the number of bins, because those have an impact on the internal structure of the tree (the bitmaps become longer in the observation dimension). Accuracy: Figure 14 shows the percentage of hits and candidates of each configuration. We observe that when more bins are used, the chance of hitting the exact time series increases and conversely the chance of checking the candidates decreases quickly, as higher-resolution binning results in higher indexing precision. As FastBitF uses the same binning for the voltage index and filtering for the time, its accuracy is the same (but it requires a larger index).
7.5
Time to Index
RUBIK’s indexing process consists of the following main steps: after performing one pass over the data, the skeleton of the Quadtree is built in-memory, then WAH compression
is applied to the mixed bit buckets and both the compressed bit buckets as well as the Quadtree structure are serialized on disk. Compared to the different FastBit variants, RUBIK requires more time to index the datasets (building time can take from 20 minutes for the smallest dataset tested and up to 2 hours for the largest one). However, at the same time, the index needs significantly less space for the same targeted precision. Additionally, for our use cases indexing is done once the simulation output becomes available and could be performed in an incremental fashion. Another alternative is to index the different clusters in parallel as they are completely independent. Ultimately, we believe there is room for improving RUBIK’s indexing performance and we plan to investigate this as future work.
8.
CONCLUSIONS
In this paper, we develop RUBIK, a novel approach for indexing time series data. RUBIK transforms threshold queries on time series into a two-dimensional bitmap problem. By decomposing the time series using a Quadtree, RUBIK reduces the size of the bit representation while maintaining high precision as otherwise the number of false positives imposes an undue penalty on the query execution. Thanks to the representation as a Quadtree, queries with time and observation value predicates can be translated into efficient spatial range queries. The representation as Quadtree along with the use of WAH for compression also exploit that time series in many application domains and particularly in the simulation sciences are often similar to each other. By using both, Quadtree and WAH, RUBIK can efficiently compress similar time series and will scale particularly well to time series resulting from increasingly detailed simulation models as our experi-
ments show. Crucially, our experimental evaluation shows that, because RUBIK can collectively represent and process a group of time series as well as exploit the pruning power of the Quadtree, RUBIK outperforms the state-of-the-art by a factor of 6 to 23 for query execution while producing a more space-efficient index.
Acknowledgements The authors would like to thank Dr. Xuesong Lu for his help. This work is supported by the Hasler Foundation (Smart World - Databasing the Brain, No 11031) and the EU Framework Programme (FP7/2007-2013) under grant 604102 (HBP).
9.
REFERENCES
[1] G. Anciaux, S. B. Ramisetti, and J. F. Molinari. A Finite Temperature Bridging Domain Method for MD-FE Coupling and Application to a Contact Problem. Computer Methods in Applied Mechanics and Engineering, 205 -208(1):204–212, 2012. [2] N. Beckmann, H.-P. Kriegel, R. Schneider, and B. Seeger. The R*-tree: an Efficient and Robust Access Method for Points and Rectangles. In SIGMOD ’90. [3] Y. Cai and R. Ng. Indexing Spatio-temporal Trajectories with Chebyshev Polynomials. In Proceedings of the 2004 ACM SIGMOD International Conference on Management of Data, SIGMOD ’04. [4] A. Camerra, T. Palpanas, J. Shieh, and E. Keogh. isax 2.0: Indexing and mining one billion time series. In Proceedings of the 2010 IEEE International Conference on Data Mining, ICDM ’10. [5] Y.-K. Chan. Block image retrieval based on a compressed linear quadtree. Image and Vision Computing, 22(5):391–397, 2004. [6] C. Faloutsos, M. Ranganathan, and Y. Manolopoulos. Fast Subsequence Matching in Time-series Databases. In Proceedings of the 1994 ACM SIGMOD International Conference on Management of Data, SIGMOD ’94. [7] S. Gandhi, S. Nath, S. Suri, and J. Liu. GAMPS: Compressing Multi Sensor Data by Grouping and Amplitude Scaling. In Proceedings of the 2009 ACM SIGMOD International Conference on Management of Data, SIGMOD ’09. [8] T. Heinis, F. Tauheed, and A. Ailamaki. Spatial Data Management Challenges in the Simulation Sciences. In Proceedings of the 2014 International Conference on Extending Database Systems Technology, EDBT ’14, 2014. [9] J. M. Hellerstein, E. Koutsoupias, and C. H. Papadimitriou. On the Analysis of Indexing Schemes. In Proceedings of the Sixteenth ACM Symposium on Principles of Database Systems, PODS ’97. [10] E. Keogh, K. Chakrabarti, M. Pazzani, and S. Mehrotra. Dimensionality Reduction for Fast Similarity Search in Large Time Series Databases. Knowledge and Information Systems, 3(3), 2001. [11] E. J. Keogh, K. Chakrabarti, S. Mehrotra, and M. J. Pazzani. Locally Adaptive Dimensionality Reduction for Indexing Large Time Series Databases. In Proceedings of the 2001 ACM SIGMOD International Conference on Management of Data, SIGMOD ’01. [12] J. Lin, E. Keogh, L. Wei, and S. Lonardi. Experiencing sax: A novel symbolic representation of time series. Data Mining and Knowledge Discovery, 15(2), 2007. [13] H. Markram. The Blue Brain Project. Nature Reviews Neuroscience, 7(2):153–160, 2006. [14] H. Markram and et al. Introducing the Human Brain Project. volume 7, pages 39 – 42, 2011. Proceedings of the 2nd European Future Technologies Conference and Exhibition 2011. [15] V. Megalooikonomou, Q. Wang, G. Li, and C. Faloutsos. A Multiresolution Symbolic Representation of Time Series. In Proceedings of the 21st International Conference on Data Engineering, ICDE ’05. [16] J. Roddick, K. Hornsby, and M. Spiliopoulou. An Updated Bibliography of Temporal, Spatial, and Spatio-temporal Data Mining Research. In Temporal, Spatial, and Spatio-Temporal Data Mining, pages 147–163. 2001. [17] H. Samet. The quadtree and related hierarchical data structures. ACM Computing Surveys, 16(2):187–260, 1984.
[18] T. Tu and D. R. O’Hallaron. A computational database system for generating unstructured hexahedral meshes with billions of elements, 2004. [19] A. B. Watson et al. Temporal sensitivity. Handbook of perception and human performance, 1:6–1, 1986. [20] K. Wu, S. Ahern, E. W. Bethel, J. Chen, H. Childs, E. Cormier-Michel, C. Geddes, J. Gu, H. Hagen, B. Hamann, W. Koegler, J. Lauret, J. Meredith, P. Messmer, E. Otoo, V. Perevoztchikov, A. Poskanzer, Prabhat, O. R¨ ubel, A. Shoshani, A. Sim, K. Stockinger, G. Weber, and W. M. Zhang. FastBit: Interactively Searching Massive Data. Journal of Physics: Conference Series, 180(1), 2009. [21] K. Wu, E. J. Otoo, and A. Shoshani. Optimizing Bitmap Indices with Efficient Compression. ACM Transactions on Database Systems, 31(1).