Apr 1, 2000 - PM10 contains hygroscopic components which attract water. Due to this water uptake particles which actually belong to PM10 may become so ...
April 2000
ECN-C--00-061
SAMPLING OF PM10 AT HIGH RELATIVE HUMIDITY
H.M. ten Brink
Revisions A B Made by:
Approved:
Checked by:
Issued:
ECN-Clean Fossils Environmental Analysis and Technology
Abstract This study was part of larger research project, financed by the Ministry of Housing, Physical Planning and Environment of the Netherlands, for assessing the role of water in measurement of PM10.
Acknowledgement This author is grateful to drs. H. (Henk) Bloemen and dr. A. (Ton) van der Meulen of RIVM for their expert guidance to keep this complex research issue in focus.
2
ECN-C--00-061
CONTENTS SUMMARY
5
1.
INTRODUCTION
7
2. 2.1 2.2 2.3 2.4 2.5 2.6
RESULTS The concept of a single hygroscopic growth factor Aerosol components and hygroscopicity Size distribution of the hygroscopic components in the Netherlands Seasalt Ammonium sulfate and ammonium nitrate Fog
8 8 8 9 9 9 9
3.
CONCLUSIONS
11
REFERENCES
12
APPENDIX 1 Growth of hygroscopic particles as a function of RH
13
APPENDIX 2 FOG
15
FIGURES
ECN-C--00-061
3
4
ECN-C--00-061
SUMMARY PM10 contains hygroscopic components which attract water. Due to this water uptake particles which actually belong to PM10 may become so large that they are not collected in PM10 sampling. In calculations of the PM10 concentration this loss is not considered, which leads to an overestimate of the modeled PM10. ECN was asked to identify the major factors influencing the hygroscopic growth of PM10 in the Netherlands and to provide an estimate of the loss in sampling of PM10 at high relative humidities. The following was found. The dominant hygroscopic aerosol components in the Netherlands are sulfate/nitrate and seasalt. Sulfate and nitrate (in the form of ammonium sulfate and ammonium nitrate) are typically present in particles with a dry diameter smaller than 2.5 :m. Such small particles only grow to droplets with a size larger than 10 :m in situations with fog. It is shown that the non-hygroscopic material should also be present in the fog-droplets. This means that most PM is not sampled during fog. With the given frequency of fog in the Netherlands, this leads to the estimate that on an annual basis 5% of PM10 is missed during sampling. Since PM10 values are expected to be high on foggy days, much larger differences between modeled and measured peak values of PM10 are projected. Little seasalt will be missed in PM10 sampling, because it is not present in fog/seamist.
ECN-C--00-061
5
6
ECN-C--00-061
1.
INTRODUCTION
Growth of particles by uptake of water could be a mechanism by which less material is sampled than modeled, as the following shows. PM10 consists for quite some part of material that is soluble in water (hygroscopic). This material attracts a substantial amount of water already at the average relative humidity (RH) in the Netherlands of 80%. More water is taken up by the aerosol when the RH is higher than 80%. Due to the uptake of water the PM particles can become so large that they are not collected by PM10-samplers. This process is not being considered in current models and might lead to discrepancies when measured and modeled concentrations of PM10 are compared. ECN was asked to provide, in a quick-scan, a semi-quantitative assessment of the amount of aerosol material that is missed in PM10 sampling at high RH. The study formed part of larger research project of "Bureau Blauw", financed by the Ministry of Housing, Physical Planning and Environment of the Netherlands, in which the role of aerosol-water in measurement of PM10 has been assessed. This subproject was carried out in full consultancy with drs. H. (Henk) Bloemen and dr. A. (Ton) van der Meulen of RIVM, Bilthoven, the Netherlands.
ECN-C--00-061
7
2.
RESULTS
Little information is available on the size of atmospheric particles as a function of RH in the Netherlands. Also other countries do not provide information which could be translated to Dutch conditions. Therefore it is not possible to directly assess how much of PM10 is not being collected at high RH due to water uptake. A method to ascertain this loss would be to sample both at ambient RH and in a system in which the air is dried. Such a procedure has been developed in the past and is still being used in measuring campaigns [1,2]. The method is certainly of scientific interest, but not practical in everyday sampling.
2.1
The concept of a single hygroscopic growth factor
In a study in 1982-1983 on the effect of water uptake on aerosol size, the concept of a fixed growth factor was used by van der Meulen [3]. The growth factor was an empirical fit to describe the increase in the light scattered by aerosol and the related decrease in visibility with an increase of RH. Light-scattering by aerosol is dominated by particles with a size which is similar to that of the wavelength of the visible light and therefore the growth factor typically applies for particles of approximately 0.5 :m in diameter. Initially we followed the same route to describe the water uptake by particles of the size for which the growth factor had been derived. It was then found that the growth of particles would only be important in case of an RH approaching saturation. It was also realized that the concept of a single growth factor for all PM10 does not hold, because the coarser particles differ in composition from the small aerosol for which the mentioned growth factor was established. We used information on the composition of the aerosol as a function of size, which became available in the years following the study of van der Meulen, to assess the hygroscopic growth in more detail.
2.2
Aerosol components and hygroscopicity
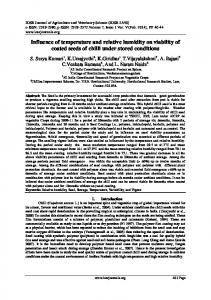
Compounds which attract water are termed hygroscopic. Typical hygroscopic components of ambient aerosol in the Dutch atmosphere are ammonium sulfate and ammonium nitrate and seasalt. Ammonium sulfate has been used as a reference salt to describe the uptake of water as a function of RH and the information has recently been summarized in a PhD thesis at our institute by Khlystov [4]. We refer to the thesis and to appendix 1 for a detailed description of the growth of particles consisting of ammonium sulfate and other components. Fig.1 summarizes the most important features of the hygroscopic growth for ammonium sulfate, but these graphs are very similar for the other atmospheric hygroscopic compounds. PM10 also contains non-hygroscopic material like dust, fly ash, elemental carbon and most of the “organic carbon”. These materials can be present in separate particles and such particles will not grow with RH. When the hydrophobic material is present in the same particle as the hygroscopic compounds they limit the growth of the hygroscopic material. An example of the effect of the presence of non-soluble material in an ammonium sulfate particle is shown in the lower curve of fig. 1. For atmospheric particles the growth is also limited, as reflected in the difference in growth of “Winkler” atmospheric aerosol and ammonium sulfate (fig 2),which is indicative that atmospheric aerosol contains some 50% non-soluble material.
8
ECN-C--00-061
2.3
Size distribution of the hygroscopic components in the Netherlands
In the Netherlands the aerosol has a bimodal mass-distribution as a function of size, with a saddle point around 2 :m [5]. The coarse aerosol consists either of seasalt or of crustal material (dust/fly-ash). These two species do not coexist: seasalt is present in when the wind comes from the sea/ocean and crustal material (dust) is present in dry continental air, with easterly winds. The crustal material is not soluble in water [6]. PM2.5 aerosol in The Netherlands consists for a good part of the hygroscopic compounds ammonium sulfate and ammonium nitrate [5]. In air coming from the direction of the UK also some sodium sulfate and sodium nitrate are present [5]. These are also hygroscopic components. However, since their hygroscopic growth is similar to that of the ammonium salts and their concentration are less, they are not separately discussed here. Hereafter we describe in more detail the growth of the two classes of hygroscopic components, viz. seasalt and ammonium sulfate/nitrate, making use of the formulation and graphs described in appendix 1.
2.4
Seasalt
Seasalt at the Dutch coast is rather pure ands contains very little water-insoluble material [6]. Seasalt aerosol is produced as seaspray-droplets which lose most of their water when they become entrained in the air above the sea which is typically at 80% RH. At this humidity the aerosol is still wet and contains a substantial fraction of water, see fig 1. The size of the particles at this relative humidity is larger than that of the dry components only. However, seasalt is sized at ambient humidity and therefore size distributions as used in calculations are those for the "wet" aerosol at 80% RH. In case the humidity is higher than the average 80%, the seasalt is larger. However, as fig 1 shows, the difference between the size of seasalt particles at 80% RH and 90% is small. It should further be considered that the density of the particles is lower at higher RH because of the water uptake. This lower density corresponds to a smaller aerodynamic size. This shows that the increase in aerodynamic size of seasalt, when the RH is 90% instead of the average 80%, hardly effects sampling. It is seen from fig. 1 that the increase in size of seasalt is only significant when the RH exceeds 95%. Such a high RH typically occurs in seamist. However, then wind speeds are too low to produce substantial amounts of seaspray and thus also the concentrations of seasalt must be low. It is thus concluded that the RH conditions in which the growth of the seasalt would be significant are hardly encountered. Only when PM-sampling would occur very close to the seashore the seasalt particles can be large, because the seaspray droplets may not have had sufficient time to lose their water. Then they might be missed in sampling.
2.5
Ammonium sulfate and ammonium nitrate
Most of the ammonium sulfate and ammonium nitrate is in particles with a (dry) size smaller than 1 :m. The growth of such small particles by uptake of water to a size of 10 :m and larger only occurs when the RH is very close to 100% (fig. 1) or rather exceeds it. In this situation fog is formed.
2.6
Fog
When the relative humidity starts to exceed 100%, unlimited uptake of water can occur so that droplets can grow to a size larger than 10 :m. The exact way of growth of particles in fog to droplets of this size can not be predicted, see appendix 2. However there is
ECN-C--00-061
9
empirical information in the Netherlands on the size of fog droplets. It turns out that droplets which contain most of the water are larger than 10 :m, even in “thin” fog [7]. Knowledge gained in extended fog studies in the Po-valley, see appendix 2, is used here to assess the particle growth in the Netherlands. There more than half of the sulfate is in droplets larger than 10 um, even in the thinnest fogs. Since other material of PM2.5 is intimately mixed with the sulfate also this material must be in droplets of that size. When these results are extrapolated to the Netherlands it means that in fog more than half, and presumably most, of the PM2.5 particles grow to droplets larger than 10 um and are thus not collected in PM10 sampling. There is a discussion in literature whether non-soluble dust particles, mainly in the fraction PM(10-2.5), also grow by water uptake in fog-like conditions. This discussion is of little importance for fog situations in the Netherlands, because very little dust is expected on such days. The reasons are that wind speeds are low and that the soil is wet. The amount of road dust brought into the atmosphere by traffic is most likely also limited because of the wetness of the road surface. In contrast to the expected low concentrations of PM(10-2.5), the concentrations of PM2.5 are expected to be high, because of the stagnant conditions. The portion of the time with fog in the eastern part of the Netherlands, where fog is most frequent, is about 2.5 %. If we further assume that PM concentrations of up to 50 :g m-3 occur during fog and that all of this would not be sampled, the average annual concentration would be low, only 1 :g m-3. Whereas the underestimate of the annual concentration may not be dramatic, a more serious problem of sampling during fog is the possible large mismatch between modeled and measured peak values of PM. As mentioned above, such peak values are specifically expected to occur on foggy days.
10
ECN-C--00-061
3.
CONCLUSIONS
Humidity seems to have little influence on sampling of PM10, unless saturation humidity (100% RH) is reached or surpassed, which means during fog or in fog-like situations. Then most PM grows to a size larger than 10 :m and is thus missed in PM10 sampling. This translates to a loss of PM10 of the order of 1 :g m-3. However, since peak PM2.5 values are expected to occur during fog, modeled maximum PM2.5 concentrations are projected to be much larger than the measured values.
ECN-C--00-061
11
REFERENCES 1.
Berner A., 1989: Haze and its relation to the atmospheric accumulation aerosol. Sci. Total Environ., 86, 251.
2.
Wiedensohler A. et al.., 1999: Closure studies on Aerosol mass and total number concentration. in: Eurotrac-AEROSOL Annual Report 1998, 90-95; H.M. ten Brink ed. GSF-Muenchen public.
3.
Meulen A. van der, 1986: The Dutch aerosol study: physical aspects. In: Aerosols (eds: S. D. Lee et al.) Lewis Publ., Chelsea MI, USA, pp. 283-300.
4.
Khlystov A., 1998: Cloud forming properties of ambient aerosol in the Netherlands. PhD thesis, University of Wageningen.
5.
Brink H.M. ten, C. Kruisz, G.P.A. Kos and A. Berner, 1997: Size/composition of the light-scattering aerosol in the Netherlands. Atmos. Environ. 31, 3955-3962.
6.
Brunnemann G. , H.M. ten Brink, R. Dlugi, L. Kins and G.P.A. Kos, 1996: Comparison of aerosol composition and size distributions at Petten (The Netherlands) and Hohenpeissenberg (Southern Germany) for northwesterly and easterly air masses. J. Aerosol Sci. 27, S115-S116.
7.
Vermeulen A. et al., 1997: Fog deposition on a coniferous forest in the Netherlands. Atmos. Environ., 31, 375-386.
8.
The Po Valley Fog Experiment 1994 (CHEMDROP), 1998: Contrib. Atmos. Phys. 71, Volume 1. Overview: S. Fuzzi,, P Laj, L. Ricci, G. Orsi, J. Heintzenberg and H. ten Brink, pg 3-29.
12
ECN-C--00-061
APPENDIX 1 Growth of hygroscopic particles as a function of RH The description given here is based on chapter 2 of ref 4 section "Effects of of hygroscopic growth"; the reader is referred to that section for addtional information and specific references. Salts show the phenomenon of deliquescence: when the RH exceeds a certain value they attract water vapor from the atmosphere and dissolve into it. (The deliquescence point is at the RH which corresponds to that of the saturated solution of the respective salt). For the typical hygroscopic aerosol components in the Netherlands this deliquescence point is between 60 and 80% RH. Since the relative humidity of the air in coastal countries is high (the average RH in the Netherlands is 80%) most aerosol particles are wet here. The relative humidity of deliquescence of relevant atmospheric salts is given in Table A1. It is seen that an aerosol particle which contains a combination of salts has a deliquescence point which is lower than that of the pure salts, see table A1. When the RH is higher than the deliquescence point, more water is taken up by the particles/droplets. The water uptake as a function of RH for a particle with a known composition can be readily calculated from thermodynamics. Most often some approximation formula’s are used, developed for salts which are most common in the atmosphere, such as NaCl, (NH4)2SO4 and NH4NO3. The most widely-used is that of Fitzgerald. Such formula’s are applicable for an RH up to 99.5%. (At higher RH fog starts for which an equilibrium thermodynamic description does not apply, see next section.) Atmospheric aerosols not only contain salts but also non-hygroscopic material so that less water is taken up. Winkler used a semi-empirical growth formula to fit a set of measured growth curves for samples collected near Mainz and Hamburg, Germany. As a comparison, the growth curve for a particle according Winkler's formula and that for a pure ammonium sulfate particle, calculated with the best known model (Fitzgerald), are given in Fig. 1. Figure 1 demonstrates that the growth of particles is moderate up to 95% RH (factor of 2). As mentioned, the difference in the curves of Winkler and of Fitzgerald is basically the presence of insoluble material in atmospheric particles. A very simple approximate formula is the following which suffices to show the major aspects of the hygroscopic growth of the particle diameter as a function of RH D/Ddry = {dAf/(1-RH) + 1}1/3 in which: D= d= f= A=
diameter density of the dry salt in g/cm3 (close to 2 for the relevant salts) fraction soluble material the ratio of the molar weights of water and salt times the number of ions of the dissociated salt in solution (van ‘t Hoff factor); A has a value of close to 0.4
ECN-C--00-061
13
Experimental proof of hygroscopic growth of ambient aerosol In older experiments deliquescence and hysteresis in the water uptake by ambient aerosol was determined using material collected on substrates. Those data are certainly influenced by the water affinity of the collection substrate. In recent years the growth with RH was investigated with aerosol in the airborne state. One example is the so-called TDMA, used at several sites in Europe with which the size of the aerosol at a given low and high RH were compared. It was shown that at all sites the aerosol is present in two classes with respect to water uptake: a hygroscopic mode and a non-hygroscopic one. Unfortunately, the method is limited to particles of a size of 0.1-0.3 :m. Another method is humidity controlled nephelometry, with which a quick assessment can be made of the growth in size of the particles that dominate light-scattering. Such particles are typically 0.5 micrometer. An attempt to use optical particles counters to measure the growth failed because of drying of sampling air and aerosol inside the monitors. It is not yet possible to experimentally assess the growth in the RH-range where the growth is largest, i.e. in the range 90-100%. Such RH cannot be set with sufficient precision in the instruments described. It must be considered that a change of RH of 1% at these humidities, see fig 1, corresponds to a large change in particle size. To establish a situation with better than 1% RH control in the whole of the measuring loop the air temperature should be controlled with an accuracy of better than 0.2 degrees. In addition, the particles should have sufficient time to grow to the equilibrium size which requires long measuring loop instrumentation.
Table A1. Deliquescence RH, at 25 C, of relevant salts and combinations; for the mixtures the lowest deliquescence RH is given. Compounds NaCl (NH4)2SO4 NH4N03 NH4N03+ (NH4)2SO4 NaNO3 NaN03+NaCl
14
RH, % 76 80 62 57 74 68
ECN-C--00-061
APPENDIX 2 FOG Fog starts to form when the RH increases to such high values that it reaches and exceeds the saturation ratio (100% RH). In the Netherlands this situation typically occurs in cloudless nights because of radiative cooling of the ground surface. The air above the ground is also cooled which leads to an increase in RH. This situation is only stable when there it is no vertical mixing with drier upper above. This requires stagnant meteorological conditions, which mostly occur in autumn. Fog is also formed in winter when warm moist air is advected from the south over a cold surface. Characteristics of fog measured in such a situation were used in the main text. At high RH a very subtle change in temperature gives rise to fog conditions and a drastic change in particle size. While the growth of a hygroscopic particle in going from 80 to 95% RH is only a factor of 1.5, the growth from 95% to 99.5% is a factor of 10, see fig 1. It should be realized that such a change of less than 5% in RH corresponds to a temperature drop of less than 1 oC! Because of the large effect of small temperature differences on RH the formation of fog can not yet be reliably described. Use has been made here of empirical knowledge gained during fog-measurement campaigns in the Po-valley [8]. The Po-valley is an area with persistent fog in the late autumn and thus a proving ground for fog-models; ECN participated in the projects carried out there. Major results of the Po-valley campaigns are. • • •
Fog models can help to understand the microstructure of fog but can not predict it. Only a limited number of particles grow to fog droplets larger than 10 :m, but: More than half of the submicron aerosol material is in these large fog droplets.
As mentioned, this information on droplet size and composition from the Po-valley was used for an estimate of the growth of PM2.5 in fog in the Netherlands. It should be considered that the aerosol shows rather good similarity in the two areas with respect to concentration and composition, specifically with respect to concentration of ammonium nitrate.
ECN-C--00-061
15
Figure 1. Growth of particles consisting of pure ammonium sulfate as a function of RH.
The growth factor is the ratio of the size at the given RH and the dry size. Growth curves for seasalt and ammonium nitrate are very similar. Note: the lower curve is for a particle with a total diameter of 0.5 :m containing 10% ammonium sulfate (and 90% non-soluble material).
16
ECN-C--00-061
Figure 2. Growth, as a function of RH, of pure ammonium sulfate and atmospheric aerosol according to "Winkler" (both with a dry size of 0.5 :m) [4].
ECN-C--00-061
17
18
ECN-C--00-061