Proceedings of the "2013 International Symposium on Electromagnetic Theory"
23PM2D-01
SAR Evaluation for Multiple Wireless Communication Devices inside a Vehicle Yinliang Diao #, Wei Nong Sun#, Kwok Hung Chan #1, Sai Wing Leung#2, Yun Ming Siu# #
Department of Electronic Engineering, City University of Hong Kong, Tat Chee Avenue, Kowloon, Hong Kong SAR, China 1 2
[email protected] [email protected]
Abstract—In this paper, the specific absorption rates (SAR) evaluation in the scenarios of passengers using different wireless communication devices inside a vehicle is evaluated. The effects of the devices with different operational frequencies 900MHz/1.8GHz/2.4GHz, and different seating locations on the SARs are investigated. A computer simulation for SAR distributions in a human body was performed based on the FDTD method. Results have indicated that the SAR variation human body could be 30% when using two wireless communications devices inside a vehicle. As the 900MHz mobile devices generate a high output radiation power, it could induce about one-tenth of its maximum SAR value to the other mobile device users in the vehicle. This SAR value is sufficient to increase the SAR induced in the 2.4GHz mobile device user by twofold. However, the SAR value is still lower than the SAR induced in the 900MHz mobile devices user.
I. INTRODUCTION There has been a rapid growth in the use of portable wireless communication devices in past two decades; these devices include smart phones, and notebook computers. Meanwhile, the concern of possible adverse effects on human health from electromagnetic (EM) energy due to the use of wireless communication devices has been raised by the general public. Restrictions on the radiation levels of consumer products were therefore established. These include the International Commission on Non-Ionizing Radiation Protection (ICNIRP) guidelines [1] and the IEEE C95.1 standard [2]; radiation limits in general defined in free space. The potential adverse health effects for body exposure can be evaluated by SAR, which relates to the temperature rise in human bodies [3-5]. The whole body SAR evaluations are commonly conducted in a free space situation or an indoor environment [6], but wireless communication devices are frequently used in enclosed environments, such as elevators, cars, and trains [7-13], that consist of metallic boundaries. In such fully enclosed or semi-enclosed spaces, human exposure in terms of SAR is closely related to the EM field, which is multiplied, reflected and scattered by the metallic walls of the enclosure. This could lead to complicated resonance effects. In addition, the mobile derives could operate at different frequency bands [15], and therefore the SAR values induced in the human body would be altered. This possible argument of an EM field inside an enclosure has raised serious concerns among the general public.
In response to the general concern over potential health effects of widespread EMF exposure, the World Health Organization (WHO) [16] also set the study of various exposure scenarios for new and emerging RF technologies, and for changes in the use of established technologies to be high-priority research. This paper will therefore focus on the impact of mobile phone radiation on the SAR, when multiple wireless communication devices are used inside a vehicle with an irregular boundary, in order to characterize the effects of multiple radiations to the SAR. The SAR induced in a passenger using a single mobile phone operated at different frequency bands, and two passengers using mobile phones operated at the same and different frequency bands are also investigated. The effects of the seating locations of passengers on the SAR variations are also assessed. II. NUMERICAL MODELING A FDTD method has been used throughout the study, and the FDTD numerical model was simulated by means of commercial software, namely, Fidelity [13]. The FDTD modeling consists of 227 × 299 × 189 = 12,827,997 cells. The largest cell was 8 mm × 8 mm × 8 mm while the smallest cell was 0.5 mm × 0.5 mm × 1 mm in the spatial domain. In the simulation model, the perfectly matched layer (PML) technique was used for boundary condition, in which a fourthorder PML with a depth of 6 cells was constructed. The time step, Δt, was 1.056286 ρs which satisfies the equation of the stability criteria, (3) 1 Δt ≤ 1 1 1 c max + + 2 2 2 Δ x min Δ y min Δ z min where Δt was the time step; Δxmin, Δymin, and Δzmin were the minimum space increments in x, y and z axis respectively; and cmax was the maximum velocity in the simulation. The solutions are set to be converged for S-parameter extractions when the amplitude residual of the time signals are less than 0.001. III. CONFIGURATION OF MODELING The FDTD simulation model consisted of three items; the vehicle, the human model, and the mobile phone. Typical situations of people sitting inside a five-passenger vehicle
626 Copyright 2013 IEICE
Proceedings of the "2013 International Symposium on Electromagnetic Theory"
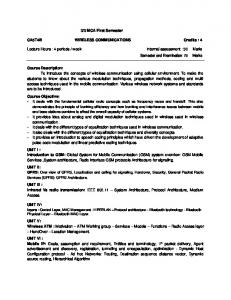
were modelled and are illustrated in Fig. 1. The vehicle with an exterior dimension of 2.04 m × 1.54 m × 1.3 m; the vehicle was made of metal and glass. As the mobile phone radiation is propagated mainly within the interior parts of the vehicle casing, the front and the rear sections of the vehicle were not necessary and therefore not included in the simulation for the modeling. In addition, the removal of these parts saved more than 50% of simulation time and memory allocation. The passengers were named P1 to P5. In addition, the distances from P5 to other passengers are indicated in the figure, and P5 is assigned to talk on a mobile phone as an example. P1 P2 P3 500 P4
1230
P5
720
500 873.5 716.25 1300
Top View
2040
Unit : mm
1540
Fig. 1. Configuration of five passengers in a vehicle. (P5 is assigned to talk on mobile phone)
P2
P1
P3
P5
P5
(a)
P4
P5
(b)
(c)
P5
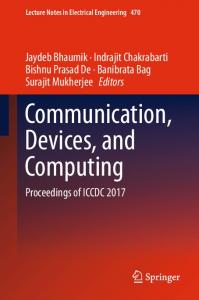
To study the effects of multiple mobile phone radiations on the SARs, two of the passengers were designed to talk on mobile phones at fixed locations. Fig. 2 shows four different configurations of 2 passengers sitting inside the vehicle in our study. The other 3 passengers sitting inside the vehicle are not shown here. In the modelling, the vehicle consisted mainly of vehicle casing and windows; the human model consisted of a head and body, and the mobile phone consisted of an antenna and casing. The details of dielectric properties of each item are presented in Table I. Fig. 3 illustrated the human and mobile phone models used in the simulation. The human model consists of a head and body, and it is modeled to be seated in the vehicle based on an established human model [8]. Fig. 3(a) shows the dimensions of the human body, with the diameter of the human head being 200 mm. The dielectric properties of the human model fulfilled the recommended value from the FCC OET Bulletin 65 [18]; details for which are summarized in Table I. The modeling of the mobile phone is shown in Fig. 3(b). The mobile phone consisted of a quarter wavelength monopole antenna and a casing. It operated in frequency bands at 900MHz, 1.8GHz or 2.4GHz with the length of the antenna l set as 83 mm, 41.5mm, and 31.5 mm, respectively. The dimension of the casing was 20 mm × 40 mm × 150 mm. The mobile phone was mainly made of copper filled with plastic material. For the excitation of the mobile antenna, a coaxial feeding technique by constructing an enclosed port at the antenna feeding position was used in the FDTD simulation. The output radiation power were set to 2W, 1W, and 0.1W for mobile devices operated at 900MHz, 1.8GHz, and 2.4GHz, respectively, in order to model the worst case scenario in practical mobile communications.
(d)
Fig. 2. Different configurations of 2 passengers using mobile phones in the vehicle: (a) P1+P5, (b)P2+P5, (c)P3+P5, and (d) P4+P5. The other 3 passengers in the vehicle are not shown. TABLE I DIELECTRIC PROPERTIES IN THE FDTD MODELING Item Vehicle Casing Window Human Head (900MHz) Body (900MHz) Head (1.8GHz) Body (1.8GHz) Head (2.4GHz) Body (2.4GHz) Wireless Com. Device Antenna & Casing Inside Casing
Relative Permittivity εr
Relative Permeability Conductivity Density μr σ (S/m) ρ (kg/m3)
1 8
1 1
1× 10⁷ 0
1 1
41.5 55 40.0 53.3 39.2 52.7
1 1 1 1 1 1
0.97 1.05 1.40 1.52 2.40 2.73
1 1 1 1 1 1
1 2.6
1 1
3.358 × 10⁷ 0
1 1
(a)
(b)
Fig. 3. Configuration of (a) human and (b) mobile phone in FDTD modeling
IV. RESULTS AND DISCUSSION In this section, the return loss of the mobile phone antenna and SAR values due to the single and multiple wireless communication devices operated at the frequency bands of 900MHz, 1.8GHz, and 2.4GHz are presented.
627
Proceedings of the "2013 International Symposium on Electromagnetic Theory"
A. Return loss of a mobile phone operated in free space and in a vehicle The S-parameter with reference impedance of 50Ω has been calculated after obtaining enough convergence from the simulations. The comparison on the results of the return loss (|S11|) of the mobile phone when being used in free space and by passengers P1 or P5 in the vehicle is shown in Fig. 4. Results have shown that the resonant frequency of the mobile phone operated at 900 MHz had a maximum of about 8 dB in magnitude for S11. It was found that when the mobile phone is operating within this semi-enclosed environment with different human loadings, the return loss of the antenna is not particularly affected, and there is no shift in the resonant frequency. Similar results are also obtained for 1.8GHz and 2.4GHz case but not shown here. 0 1 2 3
dB
4 5 6
Free space P1 P5
7 8 9
0.5
0.6
0.7
0.8 0.9 1.0 Frequency (GHz)
1.1
highest averaged SAR with a value of 3.02 W/kg, which is mainly due to the high output power of the mobile phone. C. SAR due to two mobile phones operated at the same frequency band ( 900MHz /1.8GHz /2.4GHz) The situations of two passengers using mobile phones operated at the same frequency while the other three passengers are sitting inside the vehicle are evaluated. A total of 4 cases of mobile phone users sitting in different locations in the vehicle are computed. The computed SARs induced in two mobile phone users due to 900MHz, 1.8GHz, and 2.4GHz mobile phones are summarized in Table 2. Results have shown that the 900MHz mobile phone would induce the highest SAR of 3.78 W/kg, while the 2.4GHz mobile phone would induce the lowest SAR of 0.13 W/kg. The SAR induced in the human body is mainly dominated by the output radiation power. Results have also shown that there are some variations on the induced SARs when both passengers are using the mobile phone in the vehicle. In general, the SAR variations for passenger P5 could be up to about 30%, when one of the passengers is talking on the mobile phone in different locations inside the vehicle. This variation is mainly due to internal wave reflections and mobile phone radiations from another user in the vehicle. TABLE II MAXIMUM AVERAGED SAR OVER 10G IN TWO PASSENGERS WHEN THEY BOTH USE 900MHZ, 1.8GHZ, OR 2.4GHZ MOBILE PHONES IN A VEHICLE
1.2
1.3
Fig. 4. Return loss of 900MHz mobile phones used in free space and by P1 and P5 in vehicle.
Case
P5+P1 P5+P2 P5+P3 P5+P4 SAR Variation [%]
B. SAR due to a mobile phone operate at different frequencies bands (900MHz /1.8GHz /2.4GHz) MAX SAR (W/kg) (dB)
Max. SAR = 3.02 W/kg Max. SAR = 1.88 W/kg Max. SAR = 0.19 W/kg
(a)
(b)
(c)
Fig. 5. Maximum averaged SAR and SAR Distributions for 1 person using (a) 900MHz, (b) 1.8GHz, and (c) 2.4GHz mobile phone.
The situation of passenger P5 using the mobile phone, while other passengers P1-P4 are sitting inside the vehicle are evaluated. The computed maximum averaged SAR over 10g and corresponding SAR distribution for passenger P5 using mobile phone is shown in Fig. 5. Results have shown that the SAR is concentred at the head position at the operational frequencies of 1.8GHz and 2.4GHz owing to the skin effect. By considering the limits of the output powers in a practical situation, the 900MHz mobile phone is found to have the
Max SAR10g (900MHz) [W/kg] P5 P1, P2, P3 or P4 3.110 2.977 3.578 3.777 3.095 3.731 3.589 2.956
Max SAR10g (1.8GHz) [W/kg] P5 P1, P2, P3 or P4 1.519 1.456 1.494 1.556 1.547 1.713 1.464 1.409
Max SAR10g (2.4GHz) [W/kg] P5 P1, P2, P3 or P4 0.200 0.134 0.163 0.169 0.176 0.173 0.159 0.140
27.7
21.6
29.1
16.0
5.7
25.8
D. SAR due to two mobile phones operated at different frequency bands ( 900MHz /1.8GHz /2.4GHz). In this part, the situations of two passengers using a mobile phone operated at the different frequency bands of 900MHz, 1.8GHz, and 2.4GHz, while the other three passengers are sitting inside the vehicle are discussed. The cases of passengers P5 and P2 are designed to talk on mobile phones are presented as the highest SAR is identified in Table II. The computed SARs induced in the two passengers P5 and P2 are summarized in Table 3. Similarly, results have shown that the passenger using the 900MHz mobile phone would have the highest SAR value. For 900MHz, 1.8GHz, and 2.4GHz mobile phone users, the SAR variation is 12.5 %, 22.9%, and 155%, respectively. A large variation on the SAR induced in the 2.4GHz mobile phone user is observed. In investigating this situation, Fig. 6 shows the SAR distributions in P5 due to the 2.4GHz mobile phone radiation from P5, and due to the
628
Proceedings of the "2013 International Symposium on Electromagnetic Theory"
900MHz mobile phone from P2. Results have indicated that the SAR induced in the 2.4GHz mobile phone user (P5) due to the 900MHz mobile phone radiation from the other mobile phone user (P2) is slightly larger than the SAR induced by the 2.4GHz mobile phone radiation from P5. As shown in Fig. 6(a), the SAR induced in P5 due to the 2.4GHz mobile phone radiation from P5 is mainly distributed nearby the right side of the head. The SAR in P5 due to the 900MHz mobile phone radiation from P2 is distributed mainly on the head and left side of the human body. Results have shown that the SAR induced in the 2.4 GHz mobile phone users can be increased by twofold, when another passenger using 900MHz mobile phone in vehicle. However, the SAR value is still lower than the SAR induced in the 900MHz mobile phone user. TABLE III MAXIMUM AVERAGED SAR OVER 10G IN 2 PASSENGERS (P2 AND P5) WHEN THEY USE MOBILE PHONES OPERATED AT DIFFERENT FREQUENCY BANDS IN A VEHICLE
Max SAR10g in P5 [W/kg] Max SAR10g in P2 [W/kg]
P5 using 900MHz Mobile
3.578
P2 using 1.8GHz Mobile
1.667
P2 using 2.4GHz Mobile
P5 using 1.8GHz Mobile
P5 using 2.4GHz Mobile
1.777 3.405
3.556
This work was supported by the City University of Hong Kong under a grant [Project No. 9041672]. REFERENCES [1] [2] [3]
0.415
1.556
3.530
[6] 0.194
1.446 1.531
0.210
[5]
3.357
1.494
0.383
ACKNOWLEDGMENT
[4]
3.777
P2 using 900MHz Mobile
user by more than 150%, but the SAR value is small when compare with the SAR induced in the 900MHz mobile device user.
[7]
0.169 0.163
[8]
Max SAR = MAX SAR 0.162 W/kg (W/kg)
(dB)
Max SAR = MAX SAR 0.253 W/kg (W/kg)
(dB)
[9] [10]
[11]
(a)
[12]
(b)
Fig. 6. SAR distribution in P5: (a) SAR due to 2.4GHz mobile radiation from P5, and (b) SAR due to 900MHz mobile radiation from P2.
[13]
V. CONCLUSION The SAR evaluation in the scenarios of passengers using different wireless communications devices with different operation frequency bands inside a vehicle is presented. The analyses are computed by numerical FDTD method. From our results, when a passenger using multiple wireless communication devices in a vehicle, the induced SAR in a human body could be varied by 30%. Since a high output radiation power is generated by the 900MHz mobile phone, it could increase the SAR induced in the 2.4GHz mobile phone
[14] [15] [16] [17] [18]
629
ICNIRP Guidelines, “Guidelines for limiting exposure to time-varying electric, magnetic and electromagnetic fields (up to 300GHz),” Health Physics Society, vol. 74, no. 4, pp. 494–522, Apr. 1998. IEEE Standard for Safety Levels With Respect to Human Exposure to Radio Frequency Electromagnetic Fields IEEE, 3 kHz to 300 GHz, IEEE Std C95.1-2005, 2005. A. Hirata, M. Fujimoto, T. Asano, J. Wang, O. Fujiwara, and T. Shiozawa, “Correlation between maximum temperature increase and peak SAR with different average schemes and masses,” IEEE Trans. Electromagn. Compat. vol. 48, no. 3, pp. 569-577, 2006. A. Hirata, T. Asano, and O. Fujiwara, “FDTD analysis of human bodycore temperature elevation due to RF far-field energy prescribed in the ICNIRP guidelines,” Phys. Med. Biol., vol. 52, no. 16, pp. 5013-5023, 2007. A. Hirata, H. Sugiyama, and O. Fujiwara, “Estimation of core temperature elevation in humans and animals for whole-body averaged SAR,” Prog. Electromagn. Res., vol. 99, pp. 53-70, 2009. S. Ilvonen, T. Toivonen, T. Toivo, T. Uusitupa, and I. Laakso, “Numerical specific absorption rate analysis and measurement of a small indoor base station antenna,” Microwave Opt. Techno. Lett., vol. 50, no. 10, pp. 2516–2521, Oct. 2008. A. Y. Simba, T. Hikage, S. Watanabe, and T. Nojima, “Specific absorption rates of anatomically realistic human models exposed to RF electromagnetic fields from mobile phones used in elevators,” IEEE Trans. Microw. Theory Tech., vol. 57, no. 5, pp. 1250-1259, May 2009. C. K. Tang, K. H. Chan, L. C. Fung, and S. W. Leung, “Effect on radio frequency human exposure of mobile phone inside an enclosed metallic elevator”, Microwave Opt. Techno. Lett., vol. 50, no. 8, pp. 2207-2210, Aug. 2008. C. K. Tang, L. C. Fung, and S. W. Leung, “Electromagnetic field radiation of mobile phone inside metallic enclosure”, in Proc. IEEE Int. Symp. Electromagn. Compat., Honolulu, HI, 2007, pp. 1-6. K. H. Chan, S. W. Leung, and Y. M. Siu, “Specific absorption rate evaluation for people using wireless communication device in vehicle,” in Proc. IEEE Int. Symp. Electromagn. Compat., pp. 706-711, Pittsburgh, PA, 2010, pp. 706-711. A. Hirata and T. Ida, “Analysis of electromagnetic environment in a CAD-based vehicle with a human body for far-field incidence, IEEE Antennas Wireless Propag. Lett., vol. 7, pp. 625-628, 2008. G. Anzaldi, F. Silva, M. Fernandez, M. Quilez, and Riu, P.J, “Initial analysis of SAR from a cell phone inside a vehicle by numerical computation,” IEEE Trans. Biomed. Eng., vol. 54, no. 5, pp. 921-930, 2007. T. Hikage, Y. Abiko, M. Hirono, T. Nojima, M. Omiya, S. Watanabe, and T. Shinozuka, “Estimation of the EMF excitation by cellular radios in actual train carriages - with and without passenger,” Proc. IEEE Int. Symp. Electromagn. Compat., Chicago IL, 2005, vol. 2, pp. 628–631. A. R. Ruddle, “Computed SAR levels in vehicle occupants due to onboard transmissions at 900 MHz”, in Proc. Antennas Propag. Conf., Loughborough, UK, 2009, pp. 137-140. K. H. Chan, C. K. Tang, K. H. Wong, L. C. Fung, and S.W. Leung, “Study of ground plane of dual-band patch antenna on SAR,” Microwave Opt. Techno. Lett., vol. 49, no. 4, pp. 949-953, Apr. 2007. WHO Research Agenda for Radiofrequency Fields, World Health Organization, Switzerland, 2010. Fidelity User’s Manual, Release 5, Fremont, CA: Zeland Software, Inc., Apr. 2006. OET Bulletin 65, Supplement C (Edition 97-01), Federal Communications Commission, Jun. 2001.