Jan 2, 2000 ... The correct bibliographic citation for this manual is as follows: SAS Institute Inc.
2013. ... 5. Sashelp.air — Airline Data (Monthly: Jan49-Dec60) .
Sashelp Data Sets
The correct bibliographic citation for this manual is as follows: SAS Institute Inc. 2016. Sashelp Data Sets. Cary, NC: SAS Institute Inc. Sashelp Data Sets Copyright © 2016, SAS Institute Inc., Cary, NC, USA ISBN None (PDF) All Rights Reserved. Produced in the United States of America. For a hard-copy book: No part of this publication may be reproduced, stored in a retrieval system, or transmitted, in any form or by any means, electronic, mechanical, photocopying, or otherwise, without the prior written permission of the publisher, SAS Institute Inc. For a web download or e-book: Your use of this publication shall be governed by the terms established by the vendor at the time you acquire this publication. The scanning, uploading, and distribution of this book via the Internet or any other means without the permission of the publisher is illegal and punishable by law. Please purchase only authorized electronic editions and do not participate in or encourage electronic piracy of copyrighted materials. Your support of others’ rights is appreciated. U.S. Government License Rights; Restricted Rights: The Software and its documentation is commercial computer software developed at private expense and is provided with RESTRICTED RIGHTS to the United States Government. Use, duplication, or disclosure of the Software by the United States Government is subject to the license terms of this Agreement pursuant to, as applicable, FAR 12.212, DFAR 227.7202-1(a), DFAR 227.7202-3(a), and DFAR 227.7202-4, and, to the extent required under U.S. federal law, the minimum restricted rights as set out in FAR 52.227-19 (DEC 2007). If FAR 52.227-19 is applicable, this provision serves as notice under clause (c) thereof and no other notice is required to be affixed to the Software or documentation. The Government’s rights in Software and documentation shall be only those set forth in this Agreement. SAS Institute Inc., SAS Campus Drive, Cary, NC 27513-2414 SAS® and all other SAS Institute Inc. product or service names are registered trademarks or trademarks of SAS Institute Inc. in the USA and other countries. ® indicates USA registration. Other brand and product names are trademarks of their respective companies. SAS software may be provided with certain third-party software, including but not limited to open-source software, which is licensed under its applicable third-party software license agreement. For license information about third-party software distributed with SAS software, refer to http://support.sas.com/thirdpartylicenses.
Chapter 1
Sashelp Data Sets Contents Sashelp.aacomp . . . . . . . . . . . . . . . . . . . . . . . . . . . . . . . . . . . . . . . . .
3
Sashelp.aarfm . . . . . . . . . . . . . . . . . . . . . . . . . . . . . . . . . . . . . . . . . .
5
Sashelp.air — Airline Data (Monthly: Jan49-Dec60) . . . . . . . . . . . . . . . . . . . . .
6
Sashelp.airline . . . . . . . . . . . . . . . . . . . . . . . . . . . . . . . . . . . . . . . . .
7
Sashelp.applianc — Sales Time Series for 24 Appliances By Cycle . . . . . . . . . . . . . .
8
Sashelp.assocwa — Current Association List . . . . . . . . . . . . . . . . . . . . . . . . .
10
Sashelp.baseball — 1986 Baseball Data . . . . . . . . . . . . . . . . . . . . . . . . . . . .
11
Sashelp.bei — Tropical Rain Forest Trees and Covariates . . . . . . . . . . . . . . . . . . .
13
Sashelp.bmimen — Body Mass Index and Age for Men . . . . . . . . . . . . . . . . . . . .
16
Sashelp.bmt — Bone Marrow Transplant Patients . . . . . . . . . . . . . . . . . . . . . . .
17
Sashelp.burrows — Isopod Burrow Locations and Covariates from an Israeli Desert . . . . .
19
Sashelp.buy . . . . . . . . . . . . . . . . . . . . . . . . . . . . . . . . . . . . . . . . . . .
21
Sashelp.bweight — Infant Birth Weight . . . . . . . . . . . . . . . . . . . . . . . . . . . . Sashelp.cars — 2004 Car Data . . . . . . . . . . . . . . . . . . . . . . . . . . . . . . . . .
22 23
Sashelp.citiday — Citibase Daily Indicators: Jan88-Feb92 . . . . . . . . . . . . . . . . . .
25
Sashelp.citimon — Citibase Monthly Indicators: Jan80-Jan92 . . . . . . . . . . . . . . . .
26
Sashelp.citiqtr — Citibase Quarterly Indicators: 80: 1-91: 4 . . . . . . . . . . . . . . . . .
28
Sashelp.citiwk — Citibase Weekly Indicators: Dec85-Jan92 . . . . . . . . . . . . . . . . .
29
Sashelp.citiyr — Citibase New File Format . . . . . . . . . . . . . . . . . . . . . . . . . .
30
Sashelp.class — Student Data . . . . . . . . . . . . . . . . . . . . . . . . . . . . . . . . .
31
Sashelp.classfit — Predicted Weights With Confidence Limits . . . . . . . . . . . . . . . .
32
Sashelp.comet — Comet Assay Data . . . . . . . . . . . . . . . . . . . . . . . . . . . . . .
33
Sashelp.company — Several Hierarchical Levels of a Company . . . . . . . . . . . . . . .
34
Sashelp.countseries . . . . . . . . . . . . . . . . . . . . . . . . . . . . . . . . . . . . . . .
35
Sashelp.demographics — Data Derived from World Population Prospects: the 2004 Revision
36
Sashelp.electric — Electric Power Generation and Revenue . . . . . . . . . . . . . . . . . .
38
Sashelp.eng_multi . . . . . . . . . . . . . . . . . . . . . . . . . . . . . . . . . . . . . . .
40
Sashelp.enso — El Nino Southern Oscillation . . . . . . . . . . . . . . . . . . . . . . . . .
41
Sashelp.failure — MOS Capacitor Failure . . . . . . . . . . . . . . . . . . . . . . . . . . .
42
Sashelp.fish — Measurements of 159 Fish Caught in Lake Laengelmaevesi, Finland . . . .
44
Sashelp.frnch_multi . . . . . . . . . . . . . . . . . . . . . . . . . . . . . . . . . . . . . . .
46
Sashelp.ftable . . . . . . . . . . . . . . . . . . . . . . . . . . . . . . . . . . . . . . . . . .
47
Sashelp.gas — Nitrogen Oxide Emissions from a Single Cylinder Engine . . . . . . . . . .
48
Sashelp.gcdirect — Standard Street Direction Abbreviations for US Geocoding . . . . . . .
50
Sashelp.gcstate — State/Province Names and Abbreviations for Geocoding . . . . . . . . .
51
2 F Chapter 1: Sashelp Data Sets
Sashelp.gctype — Street Type Abbreviations for US Geocoding . . . . . . . . . . . . . . . Sashelp.geoexm — Primary Street Lookup Data for PROC GEOCODE (Tiger 2014) . . . . Sashelp.geoexp — Tertiary Street Lookup Data for PROC GEOCODE (Tiger 2014) . . . . . Sashelp.geoexs — Secondary Street Lookup Data for PROC GEOCODE (Tiger 2014) . . . Sashelp.germ_multi . . . . . . . . . . . . . . . . . . . . . . . . . . . . . . . . . . . . . . . Sashelp.gisimp — GISIMP: SAS/GIS Import Data Set . . . . . . . . . . . . . . . . . . . . Sashelp.gngsmp1 — Sample Chart Data for Graph-N-Go . . . . . . . . . . . . . . . . . . . Sashelp.gngsmp2 . . . . . . . . . . . . . . . . . . . . . . . . . . . . . . . . . . . . . . . . Sashelp.gnp — GNP/Macro Data (Quarterly: 1960-1991) . . . . . . . . . . . . . . . . . . . Sashelp.gridded — Gridded Weight and Height . . . . . . . . . . . . . . . . . . . . . . . . Sashelp.gulfoil — Monthly Oil and Gas Production . . . . . . . . . . . . . . . . . . . . . . Sashelp.heart — Framingham Heart Study . . . . . . . . . . . . . . . . . . . . . . . . . . . Sashelp.holiday — Holiday Data for En US and En CA Locale . . . . . . . . . . . . . . . . Sashelp.humid — Source: W. L. Donn, Meteorology, 4th Edition . . . . . . . . . . . . . . . Sashelp.iris — Fisher’s Iris Data (1936) . . . . . . . . . . . . . . . . . . . . . . . . . . . . Sashelp.ital_multi . . . . . . . . . . . . . . . . . . . . . . . . . . . . . . . . . . . . . . . . Sashelp.ja . . . . . . . . . . . . . . . . . . . . . . . . . . . . . . . . . . . . . . . . . . . . Sashelp.junkmail — Classifying Email as Junk Or Not . . . . . . . . . . . . . . . . . . . . Sashelp.ko . . . . . . . . . . . . . . . . . . . . . . . . . . . . . . . . . . . . . . . . . . . . Sashelp.lake — Sample 3D Data of Lake Depth . . . . . . . . . . . . . . . . . . . . . . . . Sashelp.leutest — Leukemia Data Set - Validation Data . . . . . . . . . . . . . . . . . . . . Sashelp.leutrain — Leukemia Data Set - Training Data . . . . . . . . . . . . . . . . . . . . Sashelp.ltheme . . . . . . . . . . . . . . . . . . . . . . . . . . . . . . . . . . . . . . . . . Sashelp.macrs10 . . . . . . . . . . . . . . . . . . . . . . . . . . . . . . . . . . . . . . . . Sashelp.macrs15 . . . . . . . . . . . . . . . . . . . . . . . . . . . . . . . . . . . . . . . . Sashelp.macrs20 . . . . . . . . . . . . . . . . . . . . . . . . . . . . . . . . . . . . . . . . Sashelp.macrs3 . . . . . . . . . . . . . . . . . . . . . . . . . . . . . . . . . . . . . . . . . Sashelp.macrs5 . . . . . . . . . . . . . . . . . . . . . . . . . . . . . . . . . . . . . . . . . Sashelp.macrs7 . . . . . . . . . . . . . . . . . . . . . . . . . . . . . . . . . . . . . . . . . Sashelp.margarin — Margarine Purchase Data . . . . . . . . . . . . . . . . . . . . . . . . . Sashelp.mdv — Sales Data and Forecast . . . . . . . . . . . . . . . . . . . . . . . . . . . . Sashelp.mileages — Flying Mileages Between 10 US Cities . . . . . . . . . . . . . . . . . Sashelp.mon1001 — M-Competition 1001 Series, Monthly . . . . . . . . . . . . . . . . . . Sashelp.mon111 — M-Competition 111 Series, Monthly . . . . . . . . . . . . . . . . . . . Sashelp.mwelect — Midwest Electrical Supply Monthly Sales By Productgroup . . . . . . . Sashelp.nvst1 . . . . . . . . . . . . . . . . . . . . . . . . . . . . . . . . . . . . . . . . . . Sashelp.nvst2 . . . . . . . . . . . . . . . . . . . . . . . . . . . . . . . . . . . . . . . . . . Sashelp.nvst3 . . . . . . . . . . . . . . . . . . . . . . . . . . . . . . . . . . . . . . . . . . Sashelp.nvst4 . . . . . . . . . . . . . . . . . . . . . . . . . . . . . . . . . . . . . . . . . . Sashelp.nvst5 . . . . . . . . . . . . . . . . . . . . . . . . . . . . . . . . . . . . . . . . . . Sashelp.orsales — Orion Star Sports & Outdoors Sales 1999 - 2002 . . . . . . . . . . . . . Sashelp.plfips — FIPS Place Codes from USGS Geographic Names Information System (GNIS) . . . . . . . . . . . . . . . . . . . . . . . . . . . . . . . . . . . . . . . . . . Sashelp.port_multi . . . . . . . . . . . . . . . . . . . . . . . . . . . . . . . . . . . . . . .
52 53 54 55 56 57 59 61 62 63 64 65 67 68 69 71 72 73 77 78 79 79 80 81 82 83 84 85 86 87 88 89 90 90 93 94 95 96 97 98 99 101 103
Sashelp.aacomp F 3
Sashelp.prdsal2 — Furniture Sales Data . . . . . . . . . . . . . . . . . . . . . . . . . . . . Sashelp.prdsal3 — Furniture Sales Data . . . . . . . . . . . . . . . . . . . . . . . . . . . . Sashelp.prdsale — Furniture Sales Data . . . . . . . . . . . . . . . . . . . . . . . . . . . . Sashelp.pricedata — Simulated Monthly Sales Data With Hierarchy of Region, Line, Product Sashelp.proj4def . . . . . . . . . . . . . . . . . . . . . . . . . . . . . . . . . . . . . . . . Sashelp.qtr1001 — M-Competition 1001 Series, Quarterly . . . . . . . . . . . . . . . . . . Sashelp.qtr111 — M-Competition 111 Series, Quarterly . . . . . . . . . . . . . . . . . . . Sashelp.quakes — Earthquake Locations in the United States . . . . . . . . . . . . . . . . . Sashelp.rent . . . . . . . . . . . . . . . . . . . . . . . . . . . . . . . . . . . . . . . . . . . Sashelp.retail — Retail Sales (Quarterly: 1980q1-1994q2) . . . . . . . . . . . . . . . . . . Sashelp.revhub2 — Airline Data . . . . . . . . . . . . . . . . . . . . . . . . . . . . . . . . Sashelp.rockpit . . . . . . . . . . . . . . . . . . . . . . . . . . . . . . . . . . . . . . . . . Sashelp.shoes — Fictitious Shoe Company Data . . . . . . . . . . . . . . . . . . . . . . . Sashelp.snacks — Daily Snack Food Sales . . . . . . . . . . . . . . . . . . . . . . . . . . . Sashelp.span_multi . . . . . . . . . . . . . . . . . . . . . . . . . . . . . . . . . . . . . . . Sashelp.springs — Hot Spring Locations in the United States . . . . . . . . . . . . . . . . . Sashelp.steel — Iron/Steel Exports (Yearly: 1937-1980) . . . . . . . . . . . . . . . . . . . Sashelp.stocks — Performance of Three Stocks from 1996 to 2005 . . . . . . . . . . . . . . Sashelp.syr1001 — M-Competition 1001 Series, Semiannual . . . . . . . . . . . . . . . . . Sashelp.tgrmapc — US County Names and State/County FIPS Codes . . . . . . . . . . . . Sashelp.tgrmaps — US State Names and FIPS Codes . . . . . . . . . . . . . . . . . . . . . Sashelp.thick — Coal Seam Thickness . . . . . . . . . . . . . . . . . . . . . . . . . . . . . Sashelp.timedata — Time-Stamped Data . . . . . . . . . . . . . . . . . . . . . . . . . . . . Sashelp.tourism — Tourism Demand Modeling and Forecasting . . . . . . . . . . . . . . . Sashelp.usecon — Source: US BEA, "Business Statistics" . . . . . . . . . . . . . . . . . . Sashelp.us_data — Apportionment, Population Change, Population Density . . . . . . . . . Sashelp.vbplayrs . . . . . . . . . . . . . . . . . . . . . . . . . . . . . . . . . . . . . . . . Sashelp.vote1980 — US 1980 Presidential Election Data . . . . . . . . . . . . . . . . . . . Sashelp.workers — Employment (Monthly: Jan77-Jul82) . . . . . . . . . . . . . . . . . . . Sashelp.yr1001 — M-Competition 1001 Series, Annual . . . . . . . . . . . . . . . . . . . . Sashelp.yr111 — M-Competition 111 Series, Annual . . . . . . . . . . . . . . . . . . . . . Sashelp.zh . . . . . . . . . . . . . . . . . . . . . . . . . . . . . . . . . . . . . . . . . . . . Sashelp.zipcode — US ZIP Codes; Source: Zipcodedownload.com Jan 2015, SAS Release 9.4m3 . . . . . . . . . . . . . . . . . . . . . . . . . . . . . . . . . . . . . . . . . . . Sashelp.zipmil — US Military ZIP Codes-Lat/Long, NA Assigned Missing . . . . . . . . . Sashelp.zt . . . . . . . . . . . . . . . . . . . . . . . . . . . . . . . . . . . . . . . . . . . . References . . . . . . . . . . . . . . . . . . . . . . . . . . . . . . . . . . . . . . . . . . .
104 106 108 110 113 114 118 119 120 121 122 124 125 127 129 130 131 132 133 134 135 136 137 138 139 140 146 148 149 150 150 153 154 156 158 159
Sashelp.aacomp The Sashelp.aacomp data set provides advanced analytics model variable labels and error text. The following steps display information about the data set Sashelp.aacomp and create Figure 1.1. The data set contains 2,020 observations.
4 F Chapter 1: Sashelp Data Sets
title "Sashelp.aacomp"; proc contents data=sashelp.aacomp varnum; ods select position; run; title "The First Five Observations Out of 2020"; proc print data=sashelp.aacomp(obs=5) noobs; run;
Figure 1.1 Sashelp.aacomp
Sashelp.aacomp The CONTENTS Procedure Variables in Creation Order # Variable Type Len 1 locale
Char
5
2 key
Char
60
3 lineno
Num
4
4 text
Char 1200
The First Five Observations Out of 2020 locale key
lineno text
en
MODEL_ASE_VLABEL
1 Average Squared Error
en
MODEL_CCUT_VLABEL
1 Classification Cutoff
en
MODEL_CODEDEPENDENCY_ERROR
1 Unable to determine the code variable dependencies.
en
MODEL_CORRECTRATE_VLABEL
1 Overall Precision Rate
en
MODEL_CRCUT_VLABEL
1 CR Cutoff
Sashelp.aarfm F 5
Sashelp.aarfm The following steps display information about the data set Sashelp.aarfm and create Figure 1.2. The data set contains 64 observations. title "Sashelp.aarfm"; proc contents data=sashelp.aarfm varnum; ods select position; run; title "The First Five Observations Out of 64"; proc print data=sashelp.aarfm(obs=5) noobs; run;
Figure 1.2 Sashelp.aarfm
Sashelp.aarfm The CONTENTS Procedure Variables in Creation Order # Variable Type Len 1 locale
Char
5
2 key
Char
60
3 lineno
Num
4
4 text
Char 1200
The First Five Observations Out of 64 locale key
lineno text
en
AVERAGE_PLURAL
1 Averages
en
AVERAGE_SINGULAR
1 Average
en
COMMON_ERRMSG_PROC_ERROR
1 %1z (%#1s) Errors occurred in procedures while invoking this macro. Please refer to the LOG for details.
en
CUSTOMERIDLABEL
1 Customer Identifier
en
CUSTOMER_ID_VARIABLE_NOT_FOUND
1 %1z (%#1s) Required customer identifier variable is not specified.
6 F Chapter 1: Sashelp Data Sets
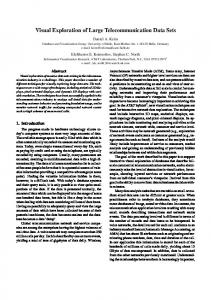
Sashelp.air — Airline Data (Monthly: Jan49-Dec60) The Sashelp.air data set provides airline data (monthly: Jan49–Dec60). The following steps display information about the data set Sashelp.air and create Figure 1.3. The data set contains 144 observations. title "Sashelp.air --- Airline Data (Monthly: Jan49-Dec60)"; proc contents data=sashelp.air varnum; ods select position; run; title "The First Five Observations Out of 144"; proc print data=sashelp.air(obs=5) noobs; run;
Figure 1.3 Sashelp.air — Airline Data (Monthly: Jan49-Dec60)
Sashelp.air --- Airline Data (Monthly: Jan49-Dec60) The CONTENTS Procedure Variables in Creation Order # Variable Type Len Format Label 1 DATE
Num
8 MONYY.
2 AIR
Num
8
international airline travel (thousands)
The First Five Observations Out of 144 DATE AIR JAN49 112 FEB49 118 MAR49 132 APR49 129 MAY49 121
Sashelp.airline F 7
Sashelp.airline The following steps display information about the data set Sashelp.airline and create Figure 1.4. The data set contains 144 observations. title "Sashelp.airline"; proc contents data=sashelp.airline varnum; ods select position; run; title "The First Five Observations Out of 144"; proc print data=sashelp.airline(obs=5) noobs; run;
Figure 1.4 Sashelp.airline
Sashelp.airline The CONTENTS Procedure Variables in Creation Order # Variable Type Len Format Label 1 DATE
Num
8 MONYY.
2 AIR
Num
8
3 Region
Char
3
international airline travel (thousands)
The First Five Observations Out of 144 DATE AIR Region JAN49 112 ALL FEB49 118 ALL MAR49 132 ALL APR49 129 ALL MAY49 121 ALL
8 F Chapter 1: Sashelp Data Sets
Sashelp.applianc — Sales Time Series for 24 Appliances By Cycle The Sashelp.applianc data set provides sales time series for 24 appliances by cycle. The following steps display information about the data set Sashelp.applianc and create Figure 1.5. The data set contains 156 observations. title "Sashelp.applianc --- Sales Time Series for 24 Appliances By Cycle"; proc contents data=sashelp.applianc varnum; ods select position; run; title "The First Five Observations Out of 156"; proc print data=sashelp.applianc(obs=5) noobs; run;
Figure 1.5 Sashelp.applianc — Sales Time Series for 24 Appliances By Cycle
Sashelp.applianc --- Sales Time Series for 24 Appliances By Cycle The CONTENTS Procedure Variables in Creation Order # Variable Type Len Label 1 units_1
Num
8 units, appliance 1
2 units_2
Num
8 units, appliance 2
3 units_3
Num
8 units, appliance 3
4 units_4
Num
8 units, appliance 4
5 units_5
Num
8 units, appliance 5
6 units_6
Num
8 units, appliance 6
7 units_7
Num
8 units, appliance 7
8 units_8
Num
8 units, appliance 8
9 units_9
Num
8 units, appliance 9
10 units_10 Num
8 units, appliance 10
11 units_11 Num
8 units, appliance 11
12 units_12 Num
8 units, appliance 12
13 units_13 Num
8 units, appliance 13
14 units_14 Num
8 units, appliance 14
15 units_15 Num
8 units, appliance 15
16 units_16 Num
8 units, appliance 16
17 units_17 Num
8 units, appliance 17
18 units_18 Num
8 units, appliance 18
19 units_19 Num
8 units, appliance 19
20 units_20 Num
8 units, appliance 20
21 units_21 Num
8 units, appliance 21
22 units_22 Num
8 units, appliance 22
23 units_23 Num
8 units, appliance 23
24 units_24 Num
8 units, appliance 24
25 cycle
8
Num
Sashelp.applianc — Sales Time Series for 24 Appliances By Cycle F 9
Figure 1.5 continued
The First Five Observations Out of 156 units_1 units_2 units_3 units_4 units_5 units_6 units_7 units_8 units_9 units_10 units_11 units_12 units_13 units_14 1
14
1
1
2
1
1
7
1
33
20
1
8
1
0
14
0
1
0
1
1
6
1
32
20
1
8
0
0
19
0
3
6
1
1
7
1
42
27
1
10
0
1
22
1
7
4
1
5
7
1
51
32
5
12
1
1
33
1
6
4
3
5
5
1
80
49
5
19
1
units_15 units_16 units_17 units_18 units_19 units_20 units_21 units_22 units_23 units_24 cycle 1
1
1
1
1
1
1
1
1
1
1
0
2
1
1
1
1
1
1
0
1
2
1
3
1
3
1
1
1
0
0
1
3
1
9
5
7
1
1
1
0
1
1
4
1
9
5
7
1
1
1
1
1
1
5
10 F Chapter 1: Sashelp Data Sets
Sashelp.assocwa — Current Association List The Sashelp.assocwa data set provides an association list. The following steps display information about the data set Sashelp.assocwa and create Figure 1.6. The data set contains 17,459 observations. title "Sashelp.assocwa --- Current Association List"; proc contents data=sashelp.assocwa varnum; ods select position; run; title "The First Five Observations Out of 17459"; proc print data=sashelp.assocwa(obs=5) noobs; run;
Figure 1.6 Sashelp.assocwa — Current Association List
Sashelp.assocwa --- Current Association List The CONTENTS Procedure Variables in Creation Order # Variable
Type Len Format
1 DELPRED
Num
8 1.
Informat
Label Delete Predecessor when delete successor
2 DELSUCC
Num
8 1.
Delete Successor when delete predecessor
3 PREDCLAS Char
20 $20.
Predecessor Object Class
4 PREDROLE Char
40 $40.
Predecessor Role Name
5 SUCCCLAS Char
20 $20.
Successor Object Class
6 SUCCROLE Char
40 $40.
Successor Role Name
7 DELPREDC Num
8 1.
Delete Predecessor when cascade delete
8 DELSUCCC Num
8 1.
Delete Successor when cascading delete
9 VERSION
Num
8
Version number of association
10 _LOADTM
Num
8 DATETIME20. DATETIME20. DateTime Stamp of when row was loaded
The First Five Observations Out of 17459 DELPRED DELSUCC PREDCLAS PREDROLE SUCCCLAS SUCCROLE DELPREDC DELSUCCC VERSION
_LOADTM
0
1 COLUMN
ANALYSIS
SUMMCOL STAT
0
1
1.1 03FEB2000:11:22:00
0
1 CURRCOL ANALYSIS
SUMMCOL STAT
0
1
1.1 03FEB2000:11:22:00
0
1 DATACOL
ANALYSIS
SUMMCOL STAT
0
1
1.1 03FEB2000:11:22:00
0
1 OLAPCOL
ANALYSIS
SUMMCOL STAT
0
1
1.1 03FEB2000:11:22:00
0
1 OLTPCOL
ANALYSIS
SUMMCOL STAT
0
1
1.1 03FEB2000:11:22:00
Sashelp.baseball — 1986 Baseball Data F 11
Sashelp.baseball — 1986 Baseball Data The Sashelp.Baseball data set contains salary and performance information for Major League Baseball players (excluding pitchers) who played at least one game in both the 1986 and 1987 seasons (Time Inc. 1987). The salaries are for the 1987 season, and the performance measures are from the 1986 season. The following steps display information about the data set Sashelp.baseball and create Figure 1.7. The data set contains 322 observations. title "Sashelp.baseball --- 1986 Baseball Data"; proc contents data=sashelp.baseball varnum; ods select position; run; title "The First Five Observations Out of 322"; proc print data=sashelp.baseball(obs=5) noobs; run;
Figure 1.7 Sashelp.baseball — 1986 Baseball Data
Sashelp.baseball --- 1986 Baseball Data The CONTENTS Procedure Variables in Creation Order # Variable Type Len Label 1 Name
Char
18 Player's Name
2 Team
Char
14 Team at the End of 1986
3 nAtBat
Num
8 Times at Bat in 1986
4 nHits
Num
8 Hits in 1986
5 nHome
Num
8 Home Runs in 1986
6 nRuns
Num
8 Runs in 1986
7 nRBI
Num
8 RBIs in 1986
8 nBB
Num
8 Walks in 1986
9 YrMajor
Num
8 Years in the Major Leagues
10 CrAtBat
Num
8 Career Times at Bat
11 CrHits
Num
8 Career Hits
12 CrHome Num
8 Career Home Runs
13 CrRuns
Num
8 Career Runs
14 CrRbi
Num
8 Career RBIs
15 CrBB
Num
8 Career Walks
16 League
Char
8 League at the End of 1986
17 Division
Char
8 Division at the End of 1986
18 Position
Char
8 Position(s) in 1986
19 nOuts
Num
8 Put Outs in 1986
20 nAssts
Num
8 Assists in 1986
21 nError
Num
8 Errors in 1986
22 Salary
Num
23 Div
Char
24 logSalary Num
8 1987 Salary in $ Thousands 16 League and Division 8 Log Salary
12 F Chapter 1: Sashelp Data Sets
Figure 1.7 continued
The First Five Observations Out of 322 Name
Team
Allanson, Andy
Cleveland
nAtBat nHits nHome nRuns nRBI nBB YrMajor CrAtBat CrHits CrHome 293
66
1
30
29
14
1
293
66
1
Ashby, Alan
Houston
315
81
7
24
38
39
14
3449
835
69
Davis, Alan
Seattle
479
130
18
66
72
76
3
1624
457
63
Dawson, Andre
Montreal
496
141
20
65
78
37
11
5628
1575
225
Galarraga, Andres Montreal
321
87
10
39
42
30
2
396
101
12
CrRuns CrRbi CrBB League 30
29
321
414
375 National
224
266
828
838
48
46
Division Position nOuts nAssts nError Salary Div logSalary
14 American East
C
446
33
20
C
632
43
10 475.0 NW
6.16331
263 American West
1B
880
82
14 480.0 AW
6.17379
354 National
East
RF
200
11
3 500.0 NE
6.21461
33 National
East
1B
805
40
4
4.51634
West
. AE
91.5 NE
.
Sashelp.bei — Tropical Rain Forest Trees and Covariates F 13
Sashelp.bei — Tropical Rain Forest Trees and Covariates The Sashelp.BEI data set contains the locations of 3,604 trees in a tropical rain forest (Condit 1998; Hubbell and Foster 1983; Condit, Hubbell, and Foster 1996). A study window of 1,000 � 500 square kilometers is used. The data set also contains covariates, represented by the variables Gradient and Elevation, which were collected at over 20,301 locations on a regular grid across the study region. The variable Trees distinguishes the event observations in the data set. The following steps display information about the data set Sashelp.bei and create Figure 1.8. The data set contains 24,205 observations. title "Sashelp.bei --- Tropical Rain Forest Trees and Covariates"; proc contents data=sashelp.bei varnum; ods select position; run; title "The First Five Observations Out of 24205"; proc print data=sashelp.bei(obs=5) noobs; run; title "The Trees Variable"; proc freq data=sashelp.bei; tables Trees; run;
14 F Chapter 1: Sashelp Data Sets
Figure 1.8 Sashelp.bei — Tropical Rain Forest Trees and Covariates
Sashelp.bei --- Tropical Rain Forest Trees and Covariates The CONTENTS Procedure Variables in Creation Order # Variable
Type Len
1 X
Num
8
2 Y
Num
8
3 Elevation
Num
8
4 Gradient
Num
8
5 Aluminum
Num
8
6 Boron
Num
8
7 Calcium
Num
8
8 Copper
Num
8
9 Iron
Num
8
10 Potassium
Num
8
11 Magnesium
Num
8
12 Manganese
Num
8
13 Sodium
Num
8
14 Phosphorus Num
8
15 Sulphur
Num
8
16 Zinc
Num
8
17 Ammonia
Num
8
18 Nitrate
Num
8
19 TotalNitro
Num
8
20 MinAmmonia Num
8
21 MinNitrate
Num
8
22 MinNitrogen Num
8
23 pH
Num
8
24 Trees
Num
8
The First Five Observations Out of 24205 X
Y Elevation Gradient Aluminum Boron Calcium Copper Iron Potassium Magnesium Manganese Sodium
11.7 151.1
.
.
.
.
.
.
.
.
.
.
.
998.9 430.5
.
.
.
.
.
.
.
.
.
.
.
980.1 433.5
.
.
.
.
.
.
.
.
.
.
.
986.5 425.8
.
.
.
.
.
.
.
.
.
.
.
944.1 415.1
.
.
.
.
.
.
.
.
.
.
.
Phosphorus Sulphur Zinc Ammonia Nitrate TotalNitro MinAmmonia MinNitrate MinNitrogen pH Trees .
.
.
.
.
.
.
.
.
.
1
.
.
.
.
.
.
.
.
.
.
1
.
.
.
.
.
.
.
.
.
.
1
.
.
.
.
.
.
.
.
.
.
1
.
.
.
.
.
.
.
.
.
.
1
Sashelp.bei — Tropical Rain Forest Trees and Covariates F 15
Figure 1.8 continued
The Trees Variable The FREQ Procedure Cumulative Cumulative Trees Frequency Percent Frequency Percent 0
20601
85.11
20601
85.11
1
3604
14.89
24205
100.00
16 F Chapter 1: Sashelp Data Sets
Sashelp.bmimen — Body Mass Index and Age for Men The Sashelp.BMIMen data set was collected from the 1999–2000 and 2001–2002 surveys of men that are published by the National Center for Health Statistics. This data set contains the variables BMI and Age. Body mass index (BMI) is defined as the ratio of weight in kilograms to the square of height in meters. BMI is widely used to categorize individuals as overweight or underweight. The following steps display information about the data set Sashelp.bmimen and create Figure 1.9. The data set contains 3,264 observations. title "Sashelp.bmimen --- Body Mass Index and Age for Men"; proc contents data=sashelp.bmimen varnum; ods select position; run; title "The First Five Observations Out of 3264"; proc print data=sashelp.bmimen(obs=5) noobs; run;
Figure 1.9 Sashelp.bmimen — Body Mass Index and Age for Men
Sashelp.bmimen --- Body Mass Index and Age for Men The CONTENTS Procedure Variables in Creation Order # Variable Type Len 1 Age
Num
8
2 BMI
Num
8
The First Five Observations Out of 3264 Age BMI 2.0 18.6 2.0 17.1 2.0 19.0 2.0 16.8 2.1 19.0
Sashelp.bmt — Bone Marrow Transplant Patients F 17
Sashelp.bmt — Bone Marrow Transplant Patients The Sashelp.BMT (bone marrow transplant) data set is used to illustrate survival analysis methods (Klein and Moeschberger 1997). At the time of transplant, each patient is classified into one of three risk categories: ALL (acute lymphoblastic leukemia), AML-Low Risk (acute myelocytic leukemia, low risk), and AML-High Risk. The endpoint of interest is the disease-free survival time, which is the time in days to death, relapse, or the end of the study. In this data set, the variable Group represents the patient’s risk category, the variable T represents the disease-free survival time, and the variable Status is the censoring indicator such that the value 1 indicates an event time and the value 0 indicates a censored time. The following steps display information about the data set Sashelp.bmt and create Figure 1.10. The data set contains 137 observations. title "Sashelp.bmt --- Bone Marrow Transplant Patients"; proc contents data=sashelp.bmt varnum; ods select position; run; title "The First Five Observations Out of 137"; proc print data=sashelp.bmt(obs=5) noobs; run; title "The Group Variable"; proc freq data=sashelp.bmt; tables Group; run;
Figure 1.10 Sashelp.bmt — Bone Marrow Transplant Patients
Sashelp.bmt --- Bone Marrow Transplant Patients The CONTENTS Procedure Variables in Creation Order # Variable Type Len Label 1 Group
Char
2 T
Num
13 Disease Group 8 Disease-Free Survival Time
3 Status
Num
8 Event Indictor: 1=Event 0=Censored
The First Five Observations Out of 137 Group
T Status
ALL
2081
0
ALL
1602
0
ALL
1496
0
ALL
1462
0
ALL
1433
0
18 F Chapter 1: Sashelp Data Sets
Figure 1.10 continued
The Group Variable The FREQ Procedure Disease Group Group
Cumulative Cumulative Frequency Percent Frequency Percent
ALL
38
27.74
38
27.74
AML-High Risk
45
32.85
83
60.58
AML-Low Risk
54
39.42
137
100.00
Sashelp.burrows — Isopod Burrow Locations and Covariates from an Israeli Desert F 19
Sashelp.burrows — Isopod Burrow Locations and Covariates from an Israeli Desert The Sashelp.Burrows data set contains the locations of 2,089 burrows, which are the habitat of isopods (“pill bugs”) in the Negev desert in Israel (Banerjee and Gelfand 2002). Each burrow has a Status variable that records whether a burrow still contains live isopods, has been emptied by an isopod predator, or has failed for some other environmental reason. The data set also contains covariates, which are measured on a square-meter grid over the study region. These covariates include topographical characteristics such as Elevation, Slope, Aspect, and PercentRock (the percentage of rocks). The data set also contains environmental characteristics such as PercentShrub (the percentage of shrubs), and Dew (the time in hours since midnight required to evaporate the dew). The following steps display information about the data set Sashelp.burrows and create Figure 1.11. The data set contains 24,591 observations. title "Sashelp.burrows --- Isopod Burrow Locations and Covariates from an Israeli" " Desert"; proc contents data=sashelp.burrows varnum; ods select position; run; title "The First Five Observations Out of 24591"; proc print data=sashelp.burrows(obs=5) noobs; run;
Figure 1.11 Sashelp.burrows — Isopod Burrow Locations and Covariates from an Israeli Desert
Sashelp.burrows --- Isopod Burrow Locations and Covariates from an Israeli Desert The CONTENTS Procedure Variables in Creation Order # Variable
Type Len
1 ID
Num
8
2 X
Num
8
3 Y
Num
8
4 Z
Num
8
5 Status
Num
8
6 Watershed
Num
8
7 BurrowCount Num
8
8 Elevation
Num
8
9 Aspect
Num
8
10 Slope
Num
8
11 Dew
Num
8
12 PercentRock Num
8
13 PercentShrub Num
8
14 Burrow
8
Num
20 F Chapter 1: Sashelp Data Sets
Figure 1.11 continued
The First Five Observations Out of 24591 ID
X
Y
Z Status Watershed BurrowCount Elevation Aspect Slope Dew PercentRock PercentShrub Burrow
448 128324.66 1031421.00 531.75
1
5
.
.
.
.
.
.
.
1
679 128344.23 1031391.63 530.79
0
5
.
.
.
.
.
.
.
1
680 128344.77 1031391.31 530.86
1
5
.
.
.
.
.
.
.
1
683 128343.09 1031402.81 531.24
0
5
.
.
.
.
.
.
.
1
686 128343.84 1031415.25 532.11
-1
5
.
.
.
.
.
.
.
1
Sashelp.buy F 21
Sashelp.buy The Sashelp.buy data set provides yearly date and amount for purchases. The following steps display information about the data set Sashelp.buy and create Figure 1.12. The data set contains 11 observations. title "Sashelp.buy"; proc contents data=sashelp.buy varnum; ods select position; run; title "The First Five Observations Out of 11"; proc print data=sashelp.buy(obs=5) noobs; run;
Figure 1.12 Sashelp.buy
Sashelp.buy The CONTENTS Procedure Variables in Creation Order # Variable Type Len Format Label 1 DATE
Num
2 AMOUNT Num
8 DATE9. Date 8
The First Five Observations Out of 11 DATE AMOUNT 01JAN1996
-110000
01JAN1997
-1000
01JAN1998
-1000
01JAN1999
-51000
01JAN2000
-2000
22 F Chapter 1: Sashelp Data Sets
Sashelp.bweight — Infant Birth Weight The Sashelp.BWeight data set provides 1997 birth weight data from National Center for Health Statistics (Koenker and Hallock 2001; Abreveya 2001). The data record live, singleton births to mothers between the ages of 18 and 45 in the United States who were classified as black or white. The following steps display information about the data set Sashelp.bweight and create Figure 1.13. The data set contains 50,000 observations. title "Sashelp.bweight --- Infant Birth Weight"; proc contents data=sashelp.bweight varnum; ods select position; run; title "The First Five Observations Out of 50000"; proc print data=sashelp.bweight(obs=5) noobs; run;
Figure 1.13 Sashelp.bweight — Infant Birth Weight
Sashelp.bweight --- Infant Birth Weight The CONTENTS Procedure Variables in Creation Order # Variable
Type Len Label
1 Weight
Num
8 Infant Birth Weight
2 Black
Num
8 Black Mother
3 Married
Num
8 Married Mother
4 Boy
Num
8 Baby Boy
5 MomAge
Num
8 Mother's Age
6 MomSmoke Num
8 Smoking Mother
7 CigsPerDay Num
8 Cigarettes Per Day
8 MomWtGain Num
8 Mother's Pregnancy Weight Gain
9 Visit
8 Prenatal Visit
Num
10 MomEdLevel Num
8 Mother's Education Level
The First Five Observations Out of 50000 Weight Black Married Boy MomAge MomSmoke CigsPerDay MomWtGain Visit MomEdLevel 4111
0
1
1
-3
0
0
-16
1
0
3997
0
1
0
1
0
0
2
3
2
3572
0
1
1
0
0
0
-3
3
0
1956
0
1
1
-1
0
0
-5
3
2
3515
0
1
1
-6
0
0
-20
3
0
Sashelp.cars — 2004 Car Data F 23
Sashelp.cars — 2004 Car Data The Sashelp.cars data set provides the 2004 car data. The following steps display information about the data set Sashelp.cars and create Figure 1.14. The data set contains 428 observations. title "Sashelp.cars --- 2004 Car Data"; proc contents data=sashelp.cars varnum; ods select position; run; title "The First Five Observations Out of 428"; proc print data=sashelp.cars(obs=5) noobs; run; title "The Type Variable"; proc freq data=sashelp.cars; tables Type; run;
Figure 1.14 Sashelp.cars — 2004 Car Data
Sashelp.cars --- 2004 Car Data The CONTENTS Procedure Variables in Creation Order # Variable
Type Len Format
1 Make
Char
13
2 Model
Char
40
3 Type
Char
8
4 Origin
Char
6
5 DriveTrain
Char
5
6 MSRP
Num
8 DOLLAR8.
7 Invoice
Num
8 DOLLAR8.
8 EngineSize
Num
8
9 Cylinders
Label
Engine Size (L)
Num
8
10 Horsepower
Num
8
11 MPG_City
Num
8
MPG (City)
12 MPG_Highway Num
8
MPG (Highway)
13 Weight
Num
8
Weight (LBS)
14 Wheelbase
Num
8
Wheelbase (IN)
15 Length
Num
8
Length (IN)
24 F Chapter 1: Sashelp Data Sets
Figure 1.14 continued
The First Five Observations Out of 428 Make Model
Type
Origin DriveTrain
Acura MDX
SUV
Asia
MSRP Invoice EngineSize Cylinders Horsepower MPG_City
All
$36,945 $33,337
3.5
6
265
17
Acura RSX Type S 2dr Sedan Asia
Front
$23,820 $21,761
2.0
4
200
24
Acura TSX 4dr
Sedan Asia
Front
$26,990 $24,647
2.4
4
200
22
Acura TL 4dr
Sedan Asia
Front
$33,195 $30,299
3.2
6
270
20
Acura 3.5 RL 4dr
Sedan Asia
Front
$43,755 $39,014
3.5
6
225
18
MPG_Highway Weight Wheelbase Length 23
4451
106
189
31
2778
101
172
29
3230
105
183
28
3575
108
186
24
3880
115
197
The Type Variable The FREQ Procedure Type Hybrid
Cumulative Cumulative Frequency Percent Frequency Percent 3
0.70
3
0.70
60
14.02
63
14.72
Sedan
262
61.21
325
75.93
Sports
49
11.45
374
87.38
Truck
24
5.61
398
92.99
Wagon
30
7.01
428
100.00
SUV
Sashelp.citiday — Citibase Daily Indicators: Jan88-Feb92 F 25
Sashelp.citiday — Citibase Daily Indicators: Jan88-Feb92 The Sashelp.citiday data set provides Citibase daily indicators: Jan88–Feb92. The following steps display information about the data set Sashelp.citiday and create Figure 1.15. The data set contains 1,069 observations. title "Sashelp.citiday --- Citibase Daily Indicators: Jan88-Feb92"; proc contents data=sashelp.citiday varnum; ods select position; run; title "The First Five Observations Out of 1069"; proc print data=sashelp.citiday(obs=5) noobs; run;
Figure 1.15 Sashelp.citiday — Citibase Daily Indicators: Jan88-Feb92
Sashelp.citiday --- Citibase Daily Indicators: Jan88-Feb92 The CONTENTS Procedure Variables in Creation Order # Variable
Type Len Format Label
1 DATE
Num
7 DATE9. Date of Observation
2 SNYDJCM
Num
8
STOCK MKT INDEX:NY DOW JONES COMPOSITE,
3 SNYSECM Num
8
STOCK MKT INDEX:NYSE COMPOSITE, (WSJ)
4 DSIUSWIL
Num
8
STOCK MKT INDEX:WILSHIRE 500, (WSJ)
5 DFXWCAN Num
8
FOREIGN EXCH RATE WSJ:CANADA,CANADIAN $/
6 DFXWUK90 Num
8
FOREIGN EXCH RATE WSJ:U.K.,CENTS/POUND(9
7 DSIUKAS
Num
8
STOCK MKT INDEX:U.K. - ALL SHARES
8 DSIJPND
Num
8
STOCK MKT INDEX:JAPAN - NIKKEI-DOW
9 DCP07
Num
8
7 DAY COMMERCIAL PAPER RATE, SHORT-TERM
10 DCD1M
Num
8
INT.RATE:1MO CERTIFICATES OF DEPOSIT, SH
11 DTBD3M
Num
8
INT.RATE:3MO T-BILL, DISCOUNT YIELD (FRB
The First Five Observations Out of 1069 DATE SNYDJCM SNYSECM DSIUSWIL DFXWCAN DFXWUK90 DSIUKAS DSIJPND DCP07 DCD1M DTBD3M 01JAN1988
.
.
.
1.29630
186.950
886.500 21217.04
.
.
.
04JAN1988
740.200
142.900
2494.93
.
.
886.500 21217.04
. 6.89000
5.88000
05JAN1988
747.380
144.540
2526.99
.
.
908.210 21575.28
. 6.85000
5.93000
06JAN1988
750.400
144.820
2534.49
1.28920
180.250
908.210 22790.50
. 6.87000
5.84000
07JAN1988
757.040
145.890
2553.39
1.28700
179.930
908.490 22792.13
. 6.88000
5.78000
26 F Chapter 1: Sashelp Data Sets
Sashelp.citimon — Citibase Monthly Indicators: Jan80-Jan92 The Sashelp.citimon data set provides Citibase monthly indicators: Jan80–Jan92. The following steps display information about the data set Sashelp.citimon and create Figure 1.16. The data set contains 145 observations. title "Sashelp.citimon --- Citibase Monthly Indicators: Jan80-Jan92"; proc contents data=sashelp.citimon varnum; ods select position; run; title "The First Five Observations Out of 145"; proc print data=sashelp.citimon(obs=5) noobs; run;
Figure 1.16 Sashelp.citimon — Citibase Monthly Indicators: Jan80-Jan92
Sashelp.citimon --- Citibase Monthly Indicators: Jan80-Jan92 The CONTENTS Procedure Variables in Creation Order # Variable Type Len Format 1 DATE
Num
Label
7 MONYY7. Date of Observation
2 CCIUAC Num
8
CONSUMER INSTAL CR OUTST'G: AUTOMOBILE,C
3 CCIUTC Num
8
CONSUMER INSTAL CR OUTST'G: TOTAL, COM'L
4 CONB
Num
8
CONSTRUCT.PUT IN PLACE: COMM'L & INDUSTR
5 CONQ
Num
8
CONSTRUCT.PUT IN PLACE: TOTAL PUBLIC, (M
6 EEC
Num
8
ENERGY CONSUM:TOTAL(QUADRILLION BTU)
7 EEGP
Num
8
GASOLINE:RETAIL PRICE, ALL TYPES (CTS/GA
8 EXVUS
Num
8
WEIGHTED-AVERAGE EXCHANGE VALUE OF U.S.D
9 FM1
Num
8
MONEY STOCK: M1(CURR,TRAV.CKS,DEM DEP,OT
10 FM1D82 Num
8
MONEY STOCK: M-1 IN 1982$ (BIL$,SA)(BCD
11 FSPCAP Num
8
S&P'S COMMON STOCK PRICE INDEX: CAPITAL
12 FSPCOM Num
8
S&P'S COMMON STOCK PRICE INDEX: COMPOSIT
13 FSPCON Num
8
S&P'S COMMON STOCK PRICE INDEX: CONSUMER
14 IP
Num
8
INDUSTRIAL PRODUCTION: TOTAL INDEX (1987
15 LHUR
Num
8
UNEMPLOYMENT RATE: ALL WORKERS, 16 YEARS
16 LUINC
Num
8
AVG WKLY INITIAL CLAIMS,STATE UNEMPLOY.I
17 PW
Num
8
PRODUCER PRICE INDEX: ALL COMMODITIES (8
18 RCARD
Num
8
RETAIL SALES: NEW PASSENGER CARS, DOMEST
19 RTRR
Num
8
RETAIL SALES: TOTAL (MIL$,SA)
Sashelp.citimon — Citibase Monthly Indicators: Jan80-Jan92 F 27
Figure 1.16 continued
The First Five Observations Out of 145 DATE CCIUAC CCIUTC CONB CONQ
EEC
EEGP EXVUS
FM1 FM1D82 FSPCAP FSPCOM
JAN1980
67166 153636 48579 66820 7.40300 111.000 85.5200 386.100 477.800 126.680
110.870
FEB1980
67119 153308 47759 64049 6.96200 118.600 86.3700 389.800 476.500 131.270
115.340
MAR1980
66786 152347 46705 64831 6.84800 123.000 90.2600 389.300 468.500 116.200
104.690
APR1980
65837 150937 45835 63913 5.98600 124.200 91.0900 383.700 457.300 110.200
102.970
MAY1980
65035 149238 46819 64598 5.83700 124.400 86.9600 383.200 452.400 113.460
107.690
FSPCON
IP
LHUR LUINC
PW RCARD RTRR
85.0900 85.9000 6.30000
416 85.2000 8.34000 79407
83.1400 86.2000 6.30000
397 86.9000 7.86000 78787
75.5000 86.2000 6.30000
438 87.5000 7.14000 77685
76.9300 84.5000 6.90000
532 87.8000 5.92000 76658
82.8100 82.5000 7.50000
616 88.3000 5.32000 76613
28 F Chapter 1: Sashelp Data Sets
Sashelp.citiqtr — Citibase Quarterly Indicators: 80: 1-91: 4 The Sashelp.citiqtr data set provides Citibase quarterly indicators: Jan80–Apr91. The following steps display information about the data set Sashelp.citiqtr and create Figure 1.17. The data set contains 48 observations. title "Sashelp.citiqtr --- Citibase Quarterly Indicators: 80: 1-91: 4"; proc contents data=sashelp.citiqtr varnum; ods select position; run; title "The First Five Observations Out of 48"; proc print data=sashelp.citiqtr(obs=5) noobs; run;
Figure 1.17 Sashelp.citiqtr — Citibase Quarterly Indicators: 80: 1-91: 4
Sashelp.citiqtr --- Citibase Quarterly Indicators: 80: 1-91: 4 The CONTENTS Procedure Variables in Creation Order # Variable Type Len Format Label 1 DATE
Num
7 YYQC6. Date of Observation
2 BPB
Num
8
BAL OF P'MENT:BALANCE ON MERCHANDISE TRA
3 BPCR
Num
8
BAL OF P'MENT:BAL ON CURRENT A/C(INC REI
4 GC
Num
8
PERSONAL CONSUMPTION EXPENDITURES
5 GCQ
Num
8
PERSONAL CONSUMPTION EXPENDITURES (BIL.
6 GCD
Num
8
PERSONAL CONS. EXPENDITURES, DURABLE GOO
7 GCDQ
Num
8
PERSONAL CONSUMPTION EXPENDITURES:DUR GO
8 GD
Num
8
IMPLICIT PR DEFLATOR: GROSS NATIONAL PRO
9 GDP
Num
8
GROSS DOMESTIC PRODUCT (BIL.$,SAAR)(T.1.
10 GDPQ
Num
8
GROSS DOMESTIC PRODUCT (BIL. 1987$)(T.1.
11 GNP
Num
8
GROSS NATIONAL PRODUCT, TOTAL
12 GNPQ
Num
8
GROSS NATIONAL PRODUCT (BILL.1987$)(T1.1
13 GY
Num
8
NATIONAL INCOME, TOTAL
14 GYD
Num
8
PERSN'L INCOME: DISPOSABLE PERSONAL INCO
15 GYDQ
Num
8
DISPOSABLE PERSONAL INCOME: TOTAL (BIL.8
The First Five Observations Out of 48 DATE
BPB BPCR
GC
GCQ
GCD
GCDQ
GD
GDP
GDPQ
GNP
GNPQ
GY
GYD
GYDQ
1980:1 -10575 -2785 1701.50 2464.60 218.700 279.700 69.2000 2650.10 3830.80 2687.70 3884.60 2163.40 1893.70 2742.90 1980:2
-6253 -1197 1704.90 2414.20 198.200 246.300 70.8000 2643.90 3732.60 2679.40 3782.30 2136.80 1901.10 2692.00
1980:3
-3856
3396 1762.30 2440.30 211.300 258.400 72.5000 2705.30 3733.50 2739.80 3780.50 2189.70 1966.10 2722.50
1980:4
-4797
1704 1823.60 2469.20 221.800 266.600 74.4000 2832.90 3808.50 2861.50 3846.20 2302.90 2050.90 2777.00
1981:1
-5663
2450 1876.00 2475.50 230.800 274.400 76.5000 2953.50 3860.50 2985.50 3901.60 2375.70 2106.50 2779.70
Sashelp.citiwk — Citibase Weekly Indicators: Dec85-Jan92 F 29
Sashelp.citiwk — Citibase Weekly Indicators: Dec85-Jan92 The Sashelp.citiwk data set provides Citibase weekly indicators: Dec85–Jan92. The following steps display information about the data set Sashelp.citiwk and create Figure 1.18. The data set contains 319 observations. title "Sashelp.citiwk --- Citibase Weekly Indicators: Dec85-Jan92"; proc contents data=sashelp.citiwk varnum; ods select position; run; title "The First Five Observations Out of 319"; proc print data=sashelp.citiwk(obs=5) noobs; run;
Figure 1.18 Sashelp.citiwk — Citibase Weekly Indicators: Dec85-Jan92
Sashelp.citiwk --- Citibase Weekly Indicators: Dec85-Jan92 The CONTENTS Procedure Variables in Creation Order # Variable Type Len Format
Label
1 DATE
Num
7 WEEKDATX16. Date of Observation
2 MF3505
Num
8
MONEY STOCK:M1(CURRENCY+DEMAND DEP+OTHER
3 TCJ
Num
8
INDUSTRIAL MATERIALS PRICE INDEX, 18 COM
4 WSPCA Num
8
STANDARD & POOR'S WEEKLY BOND YIELD: COM
5 WSPUA Num
8
STANDARD & POOR'S WEEKLY BOND YIELD: UTI
6 WSPIA
Num
8
STANDARD & POOR'S WEEKLY BOND YIELD:INDU
7 WSPGLT Num
8
STANDARD & POOR;S WEEKLY BOND YIELD: GOV
8 HFBI20
Num
8
BOND BUYERS INDEX: 20 BOND GENERAL OBLIG
9 FF142B
Num
8
BOND YIELD:"A" UTILITY(RECENTLY OFFERED)
10 FCPOIL
Num
8
PETROLEUM, REFINED OIL PRICES: FUEL OIL,
The First Five Observations Out of 319 DATE MF3505 TCJ WSPCA WSPUA WSPIA WSPGLT HFBI20 FF142B FCPOIL Sun, 22 Dec 85
.
. 10.4340 10.5380 10.3290
9.24000 8.33000 10.5900 0.76750
Sun, 29 Dec 85 620.800
. 10.4900 10.4200 10.5600
9.32000 8.04000 10.8300 0.73250
Sun, 5 Jan 86 620.900
. 10.5700 10.6900 10.4500
9.51000 8.10000 10.7500 0.64000
Sun, 12 Jan 86 620.500
. 10.5800 10.5800 10.5800
9.50000 8.05000 10.8200 0.58250
Sun, 19 Jan 86 622.200
. 10.2600 10.4200 10.1000
9.30000 7.86000 10.6700 0.57250
30 F Chapter 1: Sashelp Data Sets
Sashelp.citiyr — Citibase New File Format The Sashelp.citiyr data set provides Citibase new file format. The following steps display information about the data set Sashelp.citiyr and create Figure 1.19. The data set contains 10 observations. title "Sashelp.citiyr --- Citibase New File Format"; proc contents data=sashelp.citiyr varnum; ods select position; run; title "The First Five Observations Out of 10"; proc print data=sashelp.citiyr(obs=5) noobs; run;
Figure 1.19 Sashelp.citiyr — Citibase New File Format
Sashelp.citiyr --- Citibase New File Format The CONTENTS Procedure Variables in Creation Order # Variable Type Len Format Label 1 DATE
Num
6 YEAR4. Date of Observation
2 PAN
Num
7
POPULATION EST.: ALL AGES, INC.ARMED F.
3 PAN17
Num
7
POPULATION EST.: 16 YRS AND OVER,INC ARM
4 PAN18
Num
7
POPULATION EST.: 18-64 YRS,INC.ARMED F.O
5 PANF
Num
7
POPULATION EST.: FEMALES,ALL AGES,INC.AR
6 PANM
Num
7
POPULATION EST.: MALES, ALL AGES, INC.AR
The First Five Observations Out of 10 DATE
PAN PAN17 PAN18
PANF PANM
1980 227757 172456 138358 116869 110888 1981 230138 175017 140618 118074 112064 1982 232520 177346 142740 119275 113245 1983 234799 179480 144591 120414 114385 1984 237001 181514 146257 121507 115494
Sashelp.class — Student Data F 31
Sashelp.class — Student Data The Sashelp.Class data set provides information about a small fictitious class of students. Variables include Sex, Age, Height, and Weight. This data set is frequently used in SAS documentation to illustrate basic SAS coding. The following steps display information about the data set Sashelp.class and create Figure 1.20. The data set contains 19 observations. title "Sashelp.class --- Student Data"; proc contents data=sashelp.class varnum; ods select position; run; title "The First Five Observations Out of 19"; proc print data=sashelp.class(obs=5) noobs; run;
Figure 1.20 Sashelp.class — Student Data
Sashelp.class --- Student Data The CONTENTS Procedure Variables in Creation Order # Variable Type Len 1 Name
Char
8
2 Sex
Char
1
3 Age
Num
8
4 Height
Num
8
5 Weight
Num
8
The First Five Observations Out of 19 Name
Sex Age Height Weight
Alfred
M
14
69.0
112.5
Alice
F
13
56.5
84.0
Barbara F
13
65.3
98.0
Carol
F
14
62.8
102.5
Henry
M
14
63.5
102.5
32 F Chapter 1: Sashelp Data Sets
Sashelp.classfit — Predicted Weights With Confidence Limits The Sashelp.classfit data set provides predicted weights with confidence limits. The following steps display information about the data set Sashelp.classfit and create Figure 1.21. The data set contains 19 observations. title "Sashelp.classfit --- Predicted Weights With Confidence Limits"; proc contents data=sashelp.classfit varnum; ods select position; run; title "The First Five Observations Out of 19"; proc print data=sashelp.classfit(obs=5) noobs; run;
Figure 1.21 Sashelp.classfit — Predicted Weights With Confidence Limits
Sashelp.classfit --- Predicted Weights With Confidence Limits The CONTENTS Procedure Variables in Creation Order # Variable
Type Len Label
1 Name
Char
8
2 Sex
Char
1
3 Age
Num
8
4 Height
Num
8
5 Weight
Num
8
6 predict
Num
8 Predicted Value of Weight
7 lowermean Num
8 Lower Bound of 95% C.I. for Mean
8 uppermean Num
8 Upper Bound of 95% C.I. for Mean
9 lower
Num
8 Lower Bound of 95% C.I.(Individual Pred)
10 upper
Num
8 Upper Bound of 95% C.I.(Individual Pred)
The First Five Observations Out of 19 Name
Sex Age Height Weight predict lowermean uppermean
lower
upper
Joyce
F
11
51.3
50.5 56.9933
43.8044
70.1823 29.8835
84.103
Louise
F
12
56.3
77.0 76.4885
67.9601
85.0169 51.3145 101.662
Alice
F
13
56.5
84.0 77.2683
68.9066
85.6300 52.1503 102.386
James M
12
57.3
83.0 80.3875
72.6671
88.1079 55.4757 105.299
Thomas M
11
57.5
85.0 81.1673
73.6000
88.7346 56.3025 106.032
Sashelp.comet — Comet Assay Data F 33
Sashelp.comet — Comet Assay Data The Sashelp.Comet data set provides information from the following experiment. Twenty-four male rats were divided into four groups. Three groups received a daily oral dose of a 1,2-dimethylhydrazine dihydrochloride in three dose levels (low, medium, and high, respectively); the fourth group was a control group. Three additional animals received a positive control. Cell suspensions for each animal were scored for DNA damage by using a comet assay (Ghebretinsae et al. 2013). The following steps display information about the data set Sashelp.comet and create Figure 1.22. The data set contains 4,050 observations. title "Sashelp.comet --- Comet Assay Data"; proc contents data=sashelp.comet varnum; ods select position; run; title "The First Five Observations Out of 4050"; proc print data=sashelp.comet(obs=5) noobs; run;
Figure 1.22 Sashelp.comet — Comet Assay Data
Sashelp.comet --- Comet Assay Data The CONTENTS Procedure Variables in Creation Order # Variable Type Len Label 1 Dose
Num
8 1,2 Dimethylhydrazine dihydrochloride Dose Level
2 Rat
Num
8 Rat Index
3 Sample Num
8 Slide Index of Grouped Cells from a Rat
4 Length
8 Tail Length of the Comet
Num
The First Five Observations Out of 4050 Dose Rat Sample Length 0
1
1 15.3527
0
1
1 16.1826
0
1
1 14.9378
0
1
1 12.4481
0
1
1 12.8631
34 F Chapter 1: Sashelp Data Sets
Sashelp.company — Several Hierarchical Levels of a Company The Sashelp.company data set provides several hierarchical levels of a company. The following steps display information about the data set Sashelp.company and create Figure 1.23. The data set contains 48 observations. title "Sashelp.company --- Several Hierarchical Levels of a Company"; proc contents data=sashelp.company varnum; ods select position; run; title "The First Five Observations Out of 48"; proc print data=sashelp.company(obs=5) noobs; run;
Figure 1.23 Sashelp.company — Several Hierarchical Levels of a Company
Sashelp.company --- Several Hierarchical Levels of a Company The CONTENTS Procedure Variables in Creation Order # Variable
Type Len
1 LEVEL2
Char
13
2 LEVEL1
Char
16
3 LEVEL5
Char
30
4 DEPTHEAD Char
15
5 LEVEL3
Char
20
6 LEVEL4
Char
30
7 JOB1
Char
15
8 N
Num
8
The First Five Observations Out of 48 LEVEL2 LEVEL1
LEVEL5
DEPTHEAD LEVEL3 LEVEL4
JOB1
N
TOKYO
International Ai So Suumi
1
ADMIN
CONTRACTS MANAGER
1
TOKYO
International Ai Steffen Graff
2
ADMIN
CONTRACTS ASSISTANT
1
TOKYO
International Ai Karin Schmidt 2
ADMIN
FINANCE
ACCOUNTANT 1
LONDON International Ai Anne Bauer
1
ADMIN
PERSONNEL MANAGER
1
TOKYO
2
ADMIN
PERSONNEL ADMIN
1
International Ai Barbara Bial
Sashelp.countseries F 35
Sashelp.countseries The following steps display information about the data set Sashelp.countseries and create Figure 1.24. The data set contains 108 observations. title "Sashelp.countseries"; proc contents data=sashelp.countseries varnum; ods select position; run; title "The First Five Observations Out of 108"; proc print data=sashelp.countseries(obs=5) noobs; run;
Figure 1.24 Sashelp.countseries
Sashelp.countseries The CONTENTS Procedure Variables in Creation Order # Variable Type Len Format 1 Date
Num
8 DATE9.
2 Units
Num
8
The First Five Observations Out of 108 Date Units 01JAN2004
0
01FEB2004
0
01MAR2004
4
01APR2004
0
01MAY2004
4
36 F Chapter 1: Sashelp Data Sets
Sashelp.demographics — Data Derived from World Population Prospects: the 2004 Revision The Sashelp.demographics data set provides the 2004 revision of data derived from world population prospects. The following steps display information about the data set Sashelp.demographics and create Figure 1.25. The data set contains 197 observations. title "Sashelp.demographics --- Data Derived from World Population Prospects: the 2004" " Revision"; proc contents data=sashelp.demographics varnum; ods select position; run; title "The First Five Observations Out of 197"; proc print data=sashelp.demographics(obs=5) noobs; run; title "The region Variable"; proc freq data=sashelp.demographics; tables region; run;
Figure 1.25 Sashelp.demographics — Data Derived from World Population Prospects: the 2004 Revision
Sashelp.demographics --- Data Derived from World Population Prospects: the 2004 Revision The CONTENTS Procedure Variables in Creation Order # Variable
Type Len Format
Label
1 CONT
Num
8
Numeric Rep. for Continent
2 ID
Num
8
GLC Country ID Number
3 ISO
Num
8 Z3.
ISO Country Number: 900+ Undefined
4 NAME
Char
45
GLC Country Name
5 ISONAME
Char
45
ISO Name for Country
6 region
Char
6
Region
7 pop
Num
8 COMMA15.
Population (2005)
8 popAGR
Num
8 PERCENTN9.2 Population Annual Growth Rate Percentage (1995-2005)
9 popUrban
Num
8 PERCENTN9.2 Population in Urban Areas Percentage (2005)
10 totalFR
Num
8
11 AdolescentFPpct
Num
8 PERCENTN9.2 Adolescent Fertility Proportion Percentage
Total Fertility Rate (per woman 2004)
12 AdolescentFPyear Num
8
13 AdultLiteracypct
Num
8 PERCENTN9.2 Adult Literacy Rate Percentage (2000-2004)
Adolescent Fertility Proportion Year
14 MaleSchoolpct
Num
8 PERCENTN9.2 Net Primary School Enrollment Ratio - Male Percentage (1998-2004)
15 FemaleSchoolpct Num
8 PERCENTN9.2 Net Primary School Enrollment Ratio - Female Percentage (1998-2004)
16 GNI
Num
8
17 PopPovertypct
Num
8 PERCENTN9.2 Population Living Below the Poverty Line (% with