data, in order to allow the domain expert to set parameters of the encounter detection algorithm. ... ables domain experts and researchers to analyze movement data and discover ...... http://developer. reittiopas.fi/pages/en/other-apis.php. 5.
Eurographics Conference on Visualization (EuroVis) 2012 S. Bruckner, S. Miksch, and H. Pfister (Guest Editors)
Volume 31 (2012), Number 3
Scalable Detection of Spatiotemporal Encounters in Historical Movement Data P. Bak , M. Marder, S. Harary, A. Yaeli and H. J. Ship IBM Research Lab Haifa, Israel
Abstract The widespread adoption of location-aware devices is resulting in the generation of large amounts of spatiotemporal movement data, collected and stored in digital repositories. This forms a fertile ground for domain experts and scientists to analyze such historical data and discover interesting movement behavioral patterns. Experts in many domains, such as transportation, logistics and retail, are interested in detecting and understanding movement patterns and behavior of objects in relation to each other. Their insights can point to optimization potential and reveal deviations from planned behavior. In this paper, we focus on the detection of the encounter patterns as one possible type in movement behavior. These patterns refer to objects being close to one another in terms of space and time. We define scalability as a core requirement when dealing with historical movement data, in order to allow the domain expert to set parameters of the encounter detection algorithm. Our approach leverages a designated data structure and requires only a single pass over chronological data, thus resulting in highly scalable and fast technique to detect encounters. Consequently, users are able to explore their data by interactively specifying the spatial and temporal windows that define encounters. We evaluate our proposed method as a function of its input parameters and data size. We instantiate the proposed method on urban public transportation data, where we found a large number of encounters. We show that single encounters emerge into higher level patterns that are of particular interest and value to the domain. Categories and Subject Descriptors (according to ACM CCS): Interfaces—H.5.2 [User Interfaces]: Interaction Styles—
1. Introduction With the widespread adoption of location-aware technologies, such as Global Positioning System (GPS), Radio Frequency Identification (RFID), and wireless sensor networks, huge amounts of data about moving objects are captured and stored in digital repositories. These objects may represent anything from people to pieces of equipment to shipping containers, or buses and planes. The movement of objects is captured by recording their locations during consecutive moments in time. The collection of such spatiotemporal data enables domain experts and researchers to analyze movement data and discover valuable behavioral patterns. An important class of movement patterns deals with the movement of objects in relation to one another. For example, in the context of maritime security, this may involve c 2012 The Author(s)
c 2012 The Eurographics Association and Blackwell PublishComputer Graphics Forum ing Ltd. Published by Blackwell Publishing, 9600 Garsington Road, Oxford OX4 2DQ, UK and 350 Main Street, Malden, MA 02148, USA.
D.2.2 [Design Tools and Techniques]: User
finding two nearby ships that are moving in the same direction and speed for some period of time. In another example from transportation planning and optimization, this may entail finding two cars that pass through the same road junction within a five-minute time window. These examples belong to the encounter pattern as introduced by Laube et al. [LKI05]. Encounter refers to objects being close to one another in space and time. Encounters can further be classified into specific types based on additional attributes of the moving objects, such as direction and speed. The notion of what can be classified as an encounter is not absolute. Rather, it is highly dependent on the domain, the data, and the specific encounter type that a domain expert may look for. For example, detecting dangerous situations in which ships in a harbor get too close to one another
P. Bak et al / Movement Encounters
will require different spatial and temporal windows than observing the meeting places of people in a mall. Therefore, a one-size-fits-all encounter analysis cannot be hard-coded in an algorithmic computation. Domain experts need a highly interactive and visual environment, in which they can tweak the encounter parameters, such as the windows for the spatial and temporal distance within which an encounter occurs. Finally, then can interactively refine the analysis as they try to detect and investigate behavioral patterns. To meet these requirements, an encounter detection algorithm needs to scale up with the number of moving objects, location points, and the temporal and spatial resolution of the data. The algorithm must not only cope with the growing size of a historical dataset, but must also be fast enough to facilitate the interactive nature of the user’s tasks. This imposes a new demand for sophisticated and efficient algorithms that can handle such scalability requirements. The main contribution of our paper is a novel method for the scalable detection of spatiotemporal encounters. Our proposed method leverages a designated data structure to discover encounters with only a single sweep over the dataset. Our method is shown to be highly scalable, enabling users to interactively specify the spatial and temporal windows that define encounters, until they have generated satisfactory insights and can understand the different types of encounters that are found. We evaluate the proposed method as a function of its input parameters and data size to asses its complexity. We demonstrate the usefulness by instantiating the method using real world datasets from urban public transportation.
2. Related Work In recent years, much work has been conducted in an attempt to understand the anatomy of movement. This research mainly focused on developing taxonomies, defining possible movement patterns and developing visualization and analytic techniques for movement data. A comprehensive taxonomy of movement data was provided by Dodge et al. [DWL08] and by Andrienko et al. [AAH11a], who developed a conceptual framework for tasks and methods involved in the analysis of movement. The former describes movement behavior based on single, multiple and complex relations among moving objects. The latter focuses mostly on the data and the task, which can be distinguished by the type of information they target and by the level of analysis. On a more conceptual level, Andrienko et al. [AAB∗ 11] describe possible aspects of the relation between moving objects and their environment. These researchers suggest using movement trajectories as possible analytic targets, in that they describe the spatial, temporal and thematic characteristics over space and time. This work also focuses on the distance relationships among trajectories as a function of these characteristics. In a later work, An-
drienko et al. [AAH11a] propose a model for the spatiotemporal analysis of movement data to interactively explore various types of events, such as trajectories and encounters. Another approach was introduced by Laube [LIW05], who developed the concept of lifelines. Lifelines are identified by individual motion behavior, events of distinct group motion behavior, and by the relation of individuals to groups. Many examples of techniques to extract patterns from movement data often focus on anomaly detection in maritime trajectories. Scheepens et al. [SWvdWvW11] developed a method for using density maps to visualize trajectory data to find anomalies. Villa & Camossi [VC11] developed a method to discover suspicious movement patterns. De Vries et al. [DVVHVS10] provide a method to compare and classify trajectories for their classification using both trajectory information and domain knowledge. Lane et al. [LNHB10] use statistical analysis to identify outliers in maritime trajectories. Another statistical approach was suggested by Etienne et al. [EDB∗ 10] to extract patterns of one itinerary from large datasets of mobile objects. Similarly, Eckman & Holt [EH08] provide an algorithmic framework called Incremental Stream Clustering for extracting patterns. Willems [Wil11] identifies maritime use cases and vessel behavior patterns such as collisions, drifters, common routes, and interactions. In the same paper, Willems alos presents an approach and architecture based on composite density maps, which enable domain experts to specify trajectory patterns using filters and expressions on density fields and trajectory data. A novel technique for enhancing the quality of noisy GPSdata-generated trajectories can be found in the work by Gou et al [GLJ10]. By modeling trajectories as weighted directed graphs, they are able to discover unique patterns in sets of trajectories using graph partitioning techniques. Other movement patterns have been modeled using a space-time cube. The works of Orellana et al. [OWK∗ 10] on elephants in South Africa and of Orellana & Wachowicz [OW11] on pedestrians, both utilize a statistical model applied to movement vectors, to detect the suspension of movement. Andrienko et al. [AAH∗ 11b] present a visualanalytics procedure for extracting the suspension of movement from trajectories. Our definition of encounter closely matches that of Laube, et al [LKI05]. More studies focused on encounter detection can be found in Andrienko et al. [AAH11a] and in Andrienko & Orellana [AAWO08]. These works address the detection of interactions among moving objects by spatial proximity, which occurs between two or more objects at some point in time or during a time interval. The authors also elaborate on user interaction and the use of visualization. Interactions are represented by symbols on a map, as are the objects’ trajectories. The user of the tool can specify spatial windows, temporal filters, and attribute filters. This approach, therefore, focuses on the combination of visually c 2012 The Author(s)
c 2012 The Eurographics Association and Blackwell Publishing Ltd.
P. Bak et al / Movement Encounters
exploring trajectories and their interactions, rather than on the computation method of detecting these encounters. Andienko et al. [AAH11a] and Yu [Yu06] suggest using indexing, as well as space-time prisms to compute spatial and temporal relations, although they do not provide further information on the algorithm itself.
can interactively change the parameters of the algorithm, until they obtain the desired insights of the data. �
,
�
�
�
�
�
�
-
.
�
�
-
�
�
/
0
�
�
1
0
�
�
�
�
�
�
�
�
�
�
�
�
�
�
"
.
�
�
�
#
$
%
�
�
2
�
Laube & Imfeld [LI02] and Gudmundsson et al. [GKS∗ 06] describe the REMO algorithm for detecting patterns in sets of trajectories. The type of patterns they address is based on the geometry features of trajectories and focuses on motion patterns, such as direction, heading for the same location and proximity. Their method performs better when algorithmic parameters are allowed to be approximate, rather than exact. Several algorithms in computer graphics and robotics have been proposed for collision detection, e.g., [MW88], [CS05], and [Cam90]. These works describe methods that are aimed at finding collisions between 3D objects in simulated scenes. Such a scene would contain multiple moving objects, with each object usually represented by a set of polygons and a time-stamp. In these works, the locations of all the objects are known at all the exact same points in time. Therefore, there application is mainly limited to simulated data. Bentley & Friedman [BF78] compares and contrasts several well known algorithms and data structures used for range searching, such as Projection and k-d trees. The common aspect of these algorithms is that they are designed for facilitating range queries in space without considering time distribution. In summary, literature in the filed have focused more on real time applications, and domains, in which coping with large data volumes is not priority. Much work has been done in the past to provide taxonomies, geometric assessment of trajectories and movement data. We intend to extend existing work in the filed of movement analysis, by providing a scalable algorithm for detecting user-defined encounters from historical data in a scalable manner. Consequently, we enable users to interact with the properties of the algorithm to return a meaningful set of encounters for discovery and understanding of the domain and tasks at hand. 3. Method
�
'
+
+
3
4
5
(
&
'
(
)
*
+
�
�
�
�
�
�
(
�
�
�
�
�
�
�
�
�
�
�
!
�
�
�
�
�
�
�
�
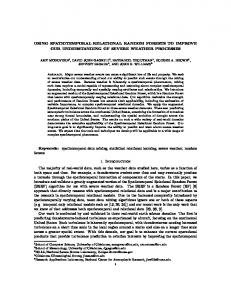
Figure 1: Pipeline showing the overall flow of activities and iterative process from interactive visualization via parameter settings to automatic algorithm of encounter detection. The input data used in our method is historical movement dataset that was created by sampling trajectories of multiple objects. We refer to this input as a list of instances; each consists of a unique ID of the moving object, location information in the form of xy-coordinates, and a time stamp. We assume the data instances are in chronological order. If not, sorting has to be conducted upfront. 3.1. Interactive Visualization The proposed method was motivated by a domain expert’s requirements. As part of our method we provide interaction interface, through witch the user can alter the properties of the algorithm and investigate its results visually to draw insight. The main properties that can be set interactively are the temporal window (∆T ) and the spatial window (∆S) that determine an encounter. Since we deal with expert users, we can rely on their domain knowledge for defining reasonable and meaningful initial values, while interaction is required for fine-tuning. Defining the initial values automatically for a general audience, which has no domain knowledge, requires a different line of research and is therefore beyond the scope of the current work. Visualizing the results of the encounter detection algorithm is a critical part of the method. Per definition, the algorithm returns the points on the two (or more) trajectories that were detected. We propose a simple but powerful visualization, of connecting the points of an encounter by colored lines. Color can be mapped to different semantic of temporal attributes of the resulting encounters. This visualization reveals the nature and enable detection of abstract levels of encounter patterns. Users will be able to draw conclusions from the geometric constellation of the encounters, and their spatial and temporal distribution. Some examples for visualization of possible types are presented in Figure 2.
The idea behind the encounter detection algorithm is to rearrange the data in a special structure, such that only one sweep over the data is needed to build the new data structure and detect all the encounters. This algorithm is followed by a post-processing step, in which the detected encounter list can be limited according to various types of user-specified features, such as the direction and velocity of the encountered objects.
3.2. The Encounter Detector
As illustrated in the general pipeline scheme in Figure 1, our method is embedded in an interactive analysis system. That is, the results are graphically displayed, and the users
The detector receives the data and the user’s choice for ∆S, ∆T . Its purpose is to find all locations and times at which an encounter occurred, including the ID of the objects that
c 2012 The Author(s)
c 2012 The Eurographics Association and Blackwell Publishing Ltd.
P. Bak et al / Movement Encounters
spatial container. Meanwhile, for simplicity we refer to the chosen container as a list.
3.2.2. Interpolation (a) Parallel encounter
(b) Cross encounter
(c) Head front encounter
(d) Parking encounter
Figure 2: Examples for higher level encounter patterns emerging from single encounters, showing trajectories as discrete instances and their direction of move. Encounters are represented by connecting lines between instances of movement.
participate in the encounter. A brute force encounter detector would check all possible pairs of data instances. However, such a solution is not scalable and therefore not applicable to massive historical datasets. Instead, our proposed method rearranges the data in a set of sorted lists (SSL), such that only a minimal number of instances needs to be compared. 3.2.1. Set of Sorted Lists (SSL) Clearly, comparing only the locations of objects with time difference shorter than ∆T is sufficient when looking for encounters. To limit the search to only such objects, we arrange the data into an SSL. Since the data is chronologically ordered, our algorithm performs only one sweep over it, to both arrange it into an SSL and to find the encounters. Define the integer N such that the ratio dt = ∆T N is the desired temporal resolution, so that any duration shorter than dt is negligible. Each list in the SSL corresponds to a different time interval with duration dt, and they are arranged chronologically. That is, the first list corresponds to the interval [0, dt), the second list to [dt, 2dt), and so on. This yields a total time interval of ∆T for any N sequential lists. Therefore, when looking for encounters between a particular data instance and all the instances in the SSL, checking 2N lists is sufficient. Furthermore, since the data is arrange chronologically, the SSL contains only instances earlier than that particular instance, such that checking only N lists is sufficient. The SSL is not necessarily composed of regular lists; it can be a set of other structures that contain 2D points. For instance K-D trees or range trees [Sam06]. We discuss in Section 3.2.3 the consideration in the selection of the specific
Some encounter points can be missed due to the discretization of the data. These are encounters that occur in between samples of the objects’ trajectory, where there is no sample close enough to the encounter point (according to ∆S, ∆T ). Therefore, we perform an interpolation of the data when the sampling is too sparse. We refer to samples of an object trajectory as too sparse when the distance between two sequential instances (samples) of the object is greater than ∆S, or when the time between them is greater than ∆T . As explained below, during the process of adding new instances to the SSL, we check the sampling rate and perform interpolation if necessary. We denote an encounter between two instances of the same object by a self encounter. If we do not find any selfencounters when we examine a new instance of an object, we conclude that an interpolation is in order. We perform a linear interpolation between the new instance and the last instance of the same object. We start by adding a new instance exactly in the middle between the two instances (regarding both time and space). If we still do not find any selfencounters between the new instance and the previous ones, then we add a new instance between every two sequential instances. We keep adding instances in this fashion until selfencounters occur between every two sequential instances. See Figure 3 for an illustration of the interpolation in one spatial dimension. In case of very sparse data, where intensive interpolation is in order, it can be useful to preform interpolation on the input data before running the algorithm, such that less interpolation step are required within the algorithm. However, a priori interpolation is not sufficient since it needs to match the sampling rate, which we have no assumption on, and the user parameter setting, which change interactively.
7
8
6
8
(a)
(b)
(c)
Figure 3: Interpolation example in 1D. (a) The original instances. (b) An interpolated instance is added in the middle. (c) Two more interpolated instances are added, and there is no need in more interpolation steps.
c 2012 The Author(s)
c 2012 The Eurographics Association and Blackwell Publishing Ltd.
P. Bak et al / Movement Encounters
3.2.3. The Algorithm We can now turn to our proposed algorithm for encounter detection. This algorithm sweeps through the data once, and for each data instance performs the following: 1. Finds the list in the SSL whose time interval contains the time of the new instance. 2. Sweeps over the N lists in the SSL that are previous to the list from step 1 (including the list from step 1), and looks for encounters with the new instance, in each list. 3. Adds to the encounter list any non-self encounters (encounters between two objects with different ID’s) that are found in step 2. 4. Adds the instance to the list from step 1. 5. If no self encounters are found in step 2, performs interpolation between the last two instances of the object. For each interpolated instance we perform steps 2-4, where in step 2, in addition to checking the previous N lists, we also check the subsequent N lists. The idea behind the process in steps 1 through 5 is that if the time of the new instance is t, then it is compared only to instances with time not earlier than t − ∆T . Moreover, due to the sorting of each list the search for instances with spatial proximity to the new instance is efficient. Memory space can be saved by dropping lists that are too old from the SSL. To understand which lists can be dropped, we denote the largest time difference between two sequential instances of the same object by T . If the time of the latest instance that was added to the SSL is t, then any list that corresponds to a time earlier than t − T − ∆T can be dropped from the SSL. Note that T is just an upper bound; we have no assumptions over the sampling of the object trajectories. The sampling rates can be different between different objects and can vary in time. In order to assess the complexity of our proposed method, we assume that the data instances are spread roughly uniformly over time. This assumption is only for the simplicity of the calculation. In practice as long as the distribution over time is not singular the complexity assessment still roughly applies. We also assume that the data is not too sparse and such that there is no need in interpolation. We denote the total number of data instances by M, and its density in time by m, such that at every time duration dt there are about mdt instances. The complexity obviously depends on the specific spatial container (list) that we use in the SSL. Let n denote the number of instances in �such a list. In our case ! n ≈ mdt. Moreover, let O C(n, ∆S) denote the complexity of inserting a new instance to this list and locating all instances within a specific square of size ∆S. For each data instance, our algorithm looks for encounters in at most N = ∆T the complexdt lists of! the SSL. Therefore, � ity of these searches is O NC(mdt, ∆S) . We perform these c 2012 The Author(s)
c 2012 The Eurographics Association and Blackwell Publishing Ltd.
searches for each of the M data instances, thus the complexity is:
� � � ∆T � O MNC(mdt, ∆S) = O M C(mdt, ∆S) . dt
(1)
This shows that for constant resolution and density our algorithm is linear, and thus scalable, in the size of the data (M) and temporal windows (∆T ). That is regardless of the selection of the spatial container. This also shows that the spatial container should be chosen such that C(mdt, ∆S) is small, which means low complexity for both adding a new point and locating all points within a specified square. For instance, using R-tree [Sam06] is not recommended, due to its quadratic complexity of inserting a new object. But, it is possible to use structures with logarithmic complexity such as K-D tree, range tree, or a simple list sorted according to one of the coordinate. For those choices of container the algorithm is scalable also in the spatial window (∆S).
3.3. Post-Processing After finding all the encounters we can execute a postprocessing step whose purpose is to filter out encounters of certain patterns. For example, the user may want to limit the presented encounters to contain only encounters of objects of certain velocity and direction. In this work we enable the user to set three parameters: the velocity, the angle between the trajectories, and the duration of the encounters. The user can set a range of possible values for each parameter individually. Obviously other parameters can easily be added. For example, all the encounter types in Figure 2 can be identified using those three parameters: A parallel encounter has long duration and angle of approximately 0◦ ; a cross encounter has angle between 0◦ and 180◦ and short duration; a head front encounter has angle of approximately 180◦ ; and a parking encounter has long duration and low speed.
4. Instantiation of The Method To demonstrate the usefulness and efficiency of our proposed algorithm for encounter detection, we collected realworld data on public transportation. The advantage of this domain is that data is publicly accessible and available in very large amounts. Public transportation is not only the heart-beat of urban life but also very interesting and challenging to examine from both a research and business perspective. Encounter detection in the domain of public transportation is a fundamental task for service optimization. In the following chapters we describe stages of the analytic pipeline, from data collection, preprocessing, encounter detection, and interactive exploration, to the definition of higher level encounter patterns and its implications for the domain.
P. Bak et al / Movement Encounters
4.1. Data Collection and Preprocessing We gathered traffic data using the Helsinki Regional Transport’s HSL Live web service [HSL11]. A request was made to the HSL Live URL once every 9 seconds, for the duration of 24 hours. The response to this request was a list of the locations of all active buses and trams within a given bounding box. We parsed and saved these locations together with the routes and vehicle numbers. We then pre-processed the resulting log file, as described in Section 3.2. The data covered more than a hundred vehicles on 16 tram routes and 8 bus routes. The final dataset contained more than 800 trajectories, with approximately 430,000 geographic positions. We plotted the resulting trajectories in our spatiotemporal visual analytics workbench. The workbench is a webbased visualization and analytic tool that supports cartographic rendering and the visualization of spatiotemporal data, such as trajectories, sensor networks, events, and other spatial data. As a background, we used a cartographic map provided by OpenStreetMap [HW08]. Figure 4 shows the trajectories with the map background.
4.2. Interactive Visualization and Encounter Detection We began our exploration of the public transportation data by mapping colors on the trajectories. We used Colorbrewer’s [BH02] divergent color palette and selected two distinct colors to show the route direction of the vehicles. GPS data can be rather noisy, especially when presented on such a small geographic scale. Techniques and approaches for data cleaning are discussed by Gou et al [GLJ10]. We ran the encounter detection algorithm in an iterative way, by increasing and decreasing the sizes of the spatial and temporal windows. We experienced great benefit from defining these limits interactively. When we first ran the algorithm with fairly large windows, it resulted in millions of redundant encounters. After a few iterations, we finally defined the spatial window at 10 meters and the temporal window at 30 seconds. These values resulted in a reasonable number of close encounters and a sufficient diversity of patterns. Areas with high vs. low density of encounters could be pointed out immediately. When zooming in, the geometric constellations of corresponding encounters revealed valuable information. We used a simple visual encoding of encounters that connected the lines between two discrete instances on the trajectory. The length of the encounter therefore corresponds to the spatial distance during the encounter, whereas the temporal distance can be mapped for example to the color of the line. In our investigations, we found that color is more useful when mapped to the hours of the day. Even though the current description do not relate to this particular aspect of the data. Our exploration was conducted primarily by highlighting encounter lines by hovering over with the mouse. Highlighting made not only the selected encounter,
but also co-occurring encounters and trajectories that triggered the specific encounter visually salient. We recognized at this stage that further investigations to cluster and aggregate co-occurring encounters should be conducted. The fact that an encounter can not only result from the actual discrete instance of the trajectory, but also from an interpolated instance, was not of concern of the current investigation.
4.3. Encounter Patterns Visual cues and interaction capabilities proved to be very useful, as we were able to detect multiple patterns of encounters, as shown in Figure 5. and discussed here in detail: A.At junctions we discovered multiple types of encounters. The case presented in Figure 5A is one example, in which one end of the encounters is at a fixed location, whereas the other end shows distinct locations. We show Line 3B standing at the junction and waiting for Line 4 to pass by in front of it. The encounters between the two lines were detected in the junction. Further down the road to the west, Line 3B followed Line 4, but from a sufficient distance, so no further encounters between these lines were detected. This encounter is particularly insightful indicating that a transfer from Line 3B to Line 4 is supported, but not vice versa. This encounter implicitly shows that two different lines are sharing each others routes, indicating a potential for optimization. B. Figure 5B presents a head-front encounter, in which two vehicles pass by each other fairly quickly in opposite directions, therefore leaving a single encounter line as a sign of their meeting point. Due to the noise in the GPS data, it is difficult to detect these types of encounters. However, the existence of such patterns indicates the actual meetings of vehicles, which can be compared to the planned meetings as a means to reduce passenger waiting times for transitions at certain locations, for example. C. Figure 5C presents a parallel encounter between line 6 and line 64, as shown by a series of parallel encounters that are orthogonal to the driving direction and road. Parallel driving is an encounter type of major interest. It explicitly shows that two vehicles drive in close distance, in the same direction, for a long period of time. These findings can clearly be used to reduce the number of lines and more efficiently exploit vehicles’ capacities. D.In Figure 5D , we present another type of parallel encounter. These encounters are visualized as patterns of consecutive lines creating one long line of encounters. The potential for optimization is clear, a short delay between the lines would significantly reduce the overall waiting times for passengers. In addition, we observed that these encounters occur mostly during the early morning and late night hours. This fact can help the authorities understand the reasons behind such a pattern. E. A high-density of encounters can be found in multiple locations. Figure 5E shows a location close to one train c 2012 The Author(s)
c 2012 The Eurographics Association and Blackwell Publishing Ltd.
P. Bak et al / Movement Encounters
9
:
:
;
:
?
:
@
:
:
=
:
Figure 4: Trajectories of public transportation routes in Helsinki, showing one day of traffic data. The labeled locations refer to the discussed encounter patterns found during exploration. Color of the trajectories is mapped to route direction.
station and the stadium. The colors of the encounters are mapped to hours of the day, using a three-hour interval for all color intensities. This figure indicates a highlyfrequented area, with multiple encounter types at all times throughout the day. F. Another example of a high-density area is shown in Figure 5F, close to the city center and downtown, at the main train station. Especially noteworthy is the fact that not all segments of the trajectories are highly frequented with encounters. We can clearly distinguish between the station areas (lower left, with numerous encounters) and the fastdriving segment with no traffic lights joining into the main road (center of the image, with no encounters). G.Finally, we show interleaving encounter patterns as typical for large stations, final destinations, and parking arc 2012 The Author(s)
c 2012 The Eurographics Association and Blackwell Publishing Ltd.
eas. These patterns are defined by the large amount of arbitrarily-placed encounter lines, many times one side of the encounters is located at one single location resulting in a fan-like image. In multiple cases, one vehicle was standing and other vehicles were passing by back and forth multiple times. In our dataset, this type of pattern could only be found at the location shown in Figure 5G, the maintenance area for trams. In summary, the above pattern descriptions show examples of possible encounters within the context of public transportation. We demonstrate here that the current method can be instantiated efficiently on a real-world dataset. We show that encounters create the basis for defining higher level patterns, which are of particular interest to domain experts. This could include detecting vehicles that happen to
P. Bak et al / Movement Encounters
Figure 5: Examples of encounter patterns found during exploration: (A) junction, (B) head-front , (C) parallel driving, (D) following, (E) high density area, (F) high- vs. low-density area, and (G) interleaving encounter pattern. Color on trajectories is mapped to their direction, and on encounters to the hour of the day of their ocurance.
run in parallel and are too-closely spaced to improve services to citizens by reducing waiting times, performing realworld consistency tests for planned transitions, and many more tasks. Together with the actual or real-time usage patterns of the lanes, the authorities could gain a more comprehensive picture of how to make their service more economic and citizen friendly, in order create a truly commercial and ecological alternative to private transportation. 5. Evaluation The main purpose of this evaluation is to verify the correctness of our algorithm and to demonstrate the dependency of the computation time on various parameters, showing that it indeed is scalable. We first verified the correctness of our results by comparing them to the results of an exhaustive encounter search. This brute force strategy demands M(M − 1)/2 comparisons, since each data point is compared to every other sample in the data set.
As discussed in Section 3.2, in our approach different spatial data containers can be used in the SSL. For this evaluation we chose to use a list sorted by the x-coordinate. While this container is very simple to implement, it is not optimal when searching for instances constrained by a spatial rectangle. This is in contrast to KD-trees that are designed for this purpose. However, in case the data is spatially sparse, like transportation data, the sorted list provides results similar to what can be expected from KD-trees. We ran the two algorithms on real data and on synthetic data. The synthetic data consisted of M samples, equally distributed along a slanted straight line in time and space. Each sample point was made to represent a different object ID and the spatiotemporal window was chosen so the two closest neighbors of each data point were considered encounters. This implied a total of 2(M − 1) encounters, and indeed both algorithms found this number of encounters. In the real-life dataset, we selected a continuous subset of one hour from the Helsinki traffic dataset. We verified that the encounters found in the exhaustive search were indeed c 2012 The Author(s)
c 2012 The Eurographics Association and Blackwell Publishing Ltd.
P. Bak et al / Movement Encounters H
E
A
A
H
A
A
A
G
E
A
A
Y
w
t
p
p
w
p
p
p
v
t
p
p
X
C
C
C
D
E
A
A
T
r
r
s
t
p
p
~
|
A
A
A
B
C
C
M
l
m
m
n
«
p
p
q
r
r
G
A
]
^
I
\
_
`
^
a
b
c
d
A
e
J
f
A
K
¡
¡
¬
©
¨
p
\
ª
p
A
[
o
z
Z
k
y
A
£
¢
®
j
}
s
L
¢
i
{
D
¡
©
h
N
¡
¯
~
Q
P
¡
°
z
R
O
¤
± r
Q
ª
u
M
S
£
¯
F
¥
²
U
¦
ª
{
N
³
S
´
{
V
£
µ
N
W
¦
A
g
p
s
p
v
(a)
p
w
p
x
p
t
p
¢
¶
·
¥
¸
¹
º
(b)
»
¼
½
¾
¦
¿
¸
À
Á
º
Â
Ã
Ä
Å
§
Æ
£
Ç
(c)
Figure 6: Computation time as a function of (a) the spatial window size, (b) the temporal window size and (c) the data size.
detected by our method, and vice verse. In addition, as expected, we saw that the computation time of our algorithm (less than 400 ms) was only a small fraction of the computation time of the exhaustive search (35 seconds). We ran our proposed algorithm several times using different parameters and measured the computation time for each run. In one experiment, ∆S was set to 15 meters and ∆T was adjusted from 10 seconds to 40 seconds, with a 2.5-second interval. In a second experiment, ∆T was fixed to 10 seconds, while ∆S was adjusted between 15 meters and 60 meters, in intervals of 3.75 meters. In both of these experiments, the dataset consisted of M = 82 × 103 instances. Finally, both windows were fixed to 10 seconds and 15 meters, respectively, while M was changed from 100 × 103 to 400 × 103 , by using different temporally continuous subsets of the original data. In all these executions of the algorithm described above, the temporal resolution was kept constant at 1 second. Figure 6 presents our measurements. Figure 6(a) shows the performance time as a function of ∆S; Figure 6(b) shows it a function of ∆T ; and in Figure 6(c), we present the dependency on the data size. In Figures 6(b) and 6(c), linear trend-lines are presented in addition to the measured time. When using sorted list, the container’s complexity in (1) is: C(mdt, ∆S) = log(mdt)+k(∆S), where mdt is the average number of instances per list, and k is the number of instances within the selected range of x values (defined by ∆S). Thus, according to (1) the complexity of our algorithm in this case is: h ∆T ! �i O M log(mdt) + k(∆S) . (2) dt All three graphs of the computation time are compatible with (2). In all the experiments, the temporal resolution dt was fixed and also the temporal density m was more or less fixed. We accomplished this by avoiding a dataset with rush hour traffic. (2) implies a linear relation between the computation time and both ∆T and M. The R2 values of the trend lines in Figure 6(b) and 6(c) supports this expected linc 2012 The Author(s)
c 2012 The Eurographics Association and Blackwell Publishing Ltd.
ear complexity. Moreover, according to (2), the computation time is linear in k(∆S), which is a non-decreasing function of ∆S. Indeed, in Figure 6(a) the computation time is almost constant in ∆S, with a slight monotonic increase. 6. Conclusions and Future Work This paper introduced a novel algorithm to detect spatiotemporal encounters in historical movement data. Our main contribution to the domain of movement pattern detection is by providing a highly scalable and therefore interactive algorithm that exploits user-set spatial and temporal windows that define encounters. We instantiated our method on a realworld dataset containing trajectories of a public transportation system. We detected a large number of encounters of different patterns and discussed their types, and business value. Evaluation was carried out to prove the scalability of the proposed algorithm to large datasets. We realize some limitations of the current implementation. First, the user is not guided on how to optimize the input parameters of the algorithm, so without any knowledge about the density of the data and its sampling rate. Especially if the sampling rate is very different between objects, users may find it difficult to set the spatial and temporal windows efficiently. Further, future work will need to extend the post-processing stage by intelligent means to aggregate, filter, sample or cluster consecutive encounters into abstract but still meaningful levels of encounter patterns. Finally, visualization will need to be extended to reveal different encounter constellations using more sophisticated glyph representations. Movement patterns in general, and encounters in particular, are in need of more investigation. We have plans to further elaborate on this subject and to create a comprehensive taxonomy of movement encounters that are of value for a particular domain, user task and data. Such a taxonomy is also intended to create more sophisticated visualization metaphors that make the higher level patterns of encounter visually salient.
P. Bak et al / Movement Encounters
References [AAB∗ 11] A NDRIENKO G., A NDRIENKO N., BAK P., K EIM D., K ISILEVICH S., W ROBEL S.: A conceptual framework and taxonomy of techniques for analyzing movement. Journal of Visual Languages and Computing 22, 3 (2011), 213–232. 2 [AAH11a] A NDRIENKO G., A NDRIENKO N., H EURICH M.: An event-based conceptual model for context-aware movement analysis. International Journal of Geographical Information Science 25, 9 (2011), 1347–1370. 2 [AAH∗ 11b] A NDRIENKO G., A NDRIENKO N., H URTER C., R INZIVILLO S., W ROBEL S.: From movement tracks through events to places: Extracting and characterizing significant places from mobility data. IEEE Symposium on Visual Analytics Science and Technology (2011). 2 [AAWO08] A NDRIENKO N., A NDRIENKO G., WACHOWICZ M., O RELLANA D.: Uncovering interactions between moving objects. Proceedings of the GIScience 2008 Conference (2008), 16–26. 2 [BF78] B ENTLEY J., F RIEDMAN J.: A survey of algorithms and data structures for range searching. Computer Science Dep., Carnegie-Mellon Univ., 1978. 3 [BH02] B REWER C., H ARROWER M.: Colorbrewer. On-line color brewing tool available from URL http://www. colorbrewer. org (2002). 6
[LIW05] L AUBE P., I MFELD S., W EIBEL R.: Discovering relative motion patterns in groups of moving point objects. International Journal of Geographical Information Science 19, 6 (2005), 639–668. 2 [LKI05] L AUBE P., K REVELD M., I MFELD S.: Finding remo detecting relative motion patterns in geospatial lifelines. Developments in spatial data handling (2005), 201–215. 1, 2 [LNHB10] L ANE R., N EVELL D., H AYWARD S., B EANEY T.: Maritime anomaly detection and threat assessment. In Information Fusion (FUSION), 2010 13th Conference on (2010), IEEE, pp. 1–8. 2 [MW88] M OORE M., W ILHELMS J.: Collision detection and response for computer animation. In Computer Graphics (1988), pp. 289–298. 3 [OW11] O RELLANA D., WACHOWICZ M.: Exploring patterns of movement suspension in pedestrian mobility. Geographical Analysis 43, 3 (2011), 241–260. 2 [OWK∗ 10] O RELLANA D., WACHOWICZ M., K NEGT H., L IGTENBERG A., B REGT A.: Uncovering patterns of suspension of movement. GIScience (2010). 2 [Sam06] S AMET H.: Foundations of Multidimensional and Metric Data Structures. Elsevier, 2006. 4, 5
[Cam90] C AMERON S.: Collision detection by four-dimensional intersection testing. IEEE Transactions on Robotics and Automation 6 (1990), 291–302. 3
[SWvdWvW11] S CHEEPENS R., W ILLEMS N., VAN DE W E TERING H., VAN W IJK J.: Interactive visualization of multivariate trajectory data with density maps. In Pacific Visualization Symposium (PacificVis), 2011 IEEE (2011), IEEE, pp. 147–154. 2
[CS05] C OMING D. S., S TAADT O. G.: Kinetic sweep and prune for collision detection. In In Proc. Workshop on Virtual Reality Interactions and Physical Simulations (2005), pp. 81–90. 3
[VC11] V ILLA P., C AMOSSI E.: A description logic approach to discover suspicious itineraries from maritime container trajectories. GeoSpatial Semantics (2011), 182–199. 2
[DVVHVS10] D E V RIES G., VAN H AGE W., VAN S OMEREN M.: Comparing vessel trajectories using geographical domain knowledge and alignments. In Data Mining Workshops (ICDMW), 2010 IEEE International Conference on (2010), IEEE, pp. 209–216. 2
[Wil11] W ILLEMS N.: Visualization of Vessel Traffic. PhD thesis, Eindhoven University of Technology, 2011. 2 [Yu06] Y U H.: Spatio-temporal gis design for exploring interactions of human activities. Cartography and Geographic Information Science 33, 1 (2006), 3–19. 2
[DWL08] D ODGE S., W EIBEL R., L AUTENSCHÜTZ A.: Towards a taxonomy of movement patterns. Information visualization 7, 3-4 (2008), 240. 2 [EDB∗ 10] E TIENNE L., D EVOGELE T., B OUJU A., ET AL .: Spatio-temporal trajectory analysis of mobile objects following the same itinerary. In Proceedings of the International Symposium on Spatial Data Handling (SDH) (2010), p. 6. 2 [EH08] E KMAN J., H OLST A.: Incremental stream clustering and anomaly detection. 2 [GKS∗ 06] G UDMUNDSSON J., K REVELD M., S PECKMANN B., G UDMUNDSSON J., ( B M. V. K., S PECKMANN B.: Efficient detection of patterns in 2d trajectories of moving points. In: Geoinformatica 11 (2006), 195–215. 3 [GLJ10] G UO D., L IU S., J IN H.: A graph-based approach to vehicle trajectory analysis. Journal of Location Based Services 4, 3-4 (2010), 183–199. 2, 6 [HSL11] HSL: Helsinki region transport - live vehicle api documentation. Website, 2011. http://developer. reittiopas.fi/pages/en/other-apis.php. 5 [HW08] H AKLAY M., W EBER P.: Openstreetmap: Usergenerated street maps. Pervasive Computing, IEEE 7, 4 (2008), 12–18. 6 [LI02] L AUBE P., I MFELD S.: Analyzing relative motion within groups oftrackable moving point objects. Geographic information science (2002), 132–144. 3 c 2012 The Author(s)
c 2012 The Eurographics Association and Blackwell Publishing Ltd.