1. The framework of computational model for the SVSP. image/video coding systems, the YCbCr color space is often more preferable, due to three reasons: 1) Y, ...
Scalable Visual Sensitivity Profile Estimation Guangtao Zhai, Qian Chen, Xiaokang Yang, and Wenjun Zhang Institute of Image Communication and Information Processing Shanghai Jiao Tong University, Shanghai, 200240, China
Abstract—We propose a computational model for estimating scalable visual sensitivity profile (SVSP) of video, which is a hierarchy of saliency maps that simulates the bottom-up and topdown attention of the human visual system (HVS). The bottomup process considers low level stimulus-driven visual features such as intensity, color, orientation and motion. The top-down process simulates the high level task-driven cognitive features such as finding human faces and captions in the video. The nonlinear addition model has been used for integrating low level visual features. A full center-surrounded receptive field profile is introduced to provide spatial salability of the model. Due to the hierarchical nature, the proposed SVSP can be directly used to augment the visual quality of spatial scalability. To justify the effectiveness of the proposed SVSP, extended experiments of its application in visual quality assessment are conducted. Index Terms—Human visual system, perceptual quality assessment, scalable video coding,
I. I NTRODUCTION Visual attention is one of the most important mechanisms of the human visual system (HVS). Most of the successful computational visual attention models are based upon Treisman’s pioneering work on visual attention [1], which divides the process into the pre-attentive and attentive stages. The pre-attentive stage, also referred as bottom-up attention stage, extracts low-level visual features such as intensity, color, orientation and movement, and integrates them into a saliency map. The attentive stage, or the top-down stage, involves much more complex psychological process, and directs attention into certain objects within the scene. The pre-attentive and attentive stages are also known as stimulus driven- and knowledge driven- attentions, respectively. Koch and Ullman’s model [12] firstly proposed the biologically-plausible computational steps in bottom-up attention simulating such central representation and winner-take-all networks. And their work largely motivated Itti’s model [2] [16] and the most recent Oliver et al.’s model [13]. Compared with bottom-up attention, the investigation on top-down attention lays its emphasis on the top-down modulation processing on bottom-up features of visual attention [2] [14]. Commonly these models lack explicit expression. One exception is Lu et al.’s PQSM [15], which takes human face detection as a evidence of top-down attention. With a mathematical visual attention model, it is straightforward to generate a topographic saliency map of visual attention, which indicates the sensitivity level of every location in the input image. However, scalable video coding (SVC) is recently being developed to enable decoding from partial streams with respect to the specific rate and resolution required
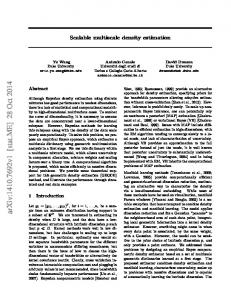
by a certain application. Therefore, it requires the computational visual attention model to offer more flexibilities, because it may need saliency maps under various spatial/temporal resolutions to facilitate the coding process instead of one with fixed resolution. In this paper, we propose a computational model for scalable visual sensitivity profile (SVSP), i.e., a hierarchy of saliency maps that simulate both the bottomup and top-down attention of HVS. Due to the hierarchical structure, the proposed SVSP can be directly used to augment the visual quality of SVC applications. In addition, it can be applied to assess the visual quality of image and video, with improved accuracy benefiting from the systematic simulations of both pre-attentive and attentive features. For the rest part of the paper, the framework of the proposed SVSP is introduced in Section II. The bottom-up and topdown attention models are detailed in Section III and IV, respectively. The results are integrated into SVSP in Section V, followed by the verification of SVSP in image quality assessment in Section VI. And finally Section VII concludes the paper. II. T HE C OMPUTATIONAL F RAMEWORK FOR SVSP The diagram of the computation model of SVSP is shown in Fig.1, and the outputs of each step, using the example of present debate, are also illustrated. We take Itti’s bottom-up attention model [2] as a reference and make some modifications towards more accurate prediction for specific applications. 1) We extend the receptive field profile computation into a full center-surrounded structure, so as to provide hierarchical saliency maps to be used in SVC. 2) Nothdurft’s nonlinear addition model [3] is used to integrate low-level stimulus features instead of Itti’s direct summation [2] to account for possible overlap between features map. For the top-down attention part, it is widely known that human face and captions in the picture often indicate useful recognition clues and attract knowledge-driven human attention. As a consequence, we apply face and caption as top-down attention directors. It is noted that other high level attentive features can also be easily added into the proposed framework. These top-down feature maps also take a hierarchical shape to be seamlessly combined with the afore-computed bottom-up features. With the hierarchical bottom-up and top-down saliency maps, we can integrate them into a final SVSP. III. B OTTOM - UP ATTENTION M ODEL A. Low-level Feature Detection Itti’s model operates in the RGB color space for expression and computation simplicity [2]. However, in digital
Fig. 1.
The framework of computational model for the SVSP.
image/video coding systems, the YCbCr color space is often more preferable, due to three reasons: 1) Y, Cb and Cr are uncorrelated; 2) Cb, Cr can be represented using lower bandwidth; and 3) Y can be extracted and used as luminance directly. So in this work, we adapt Itti’s model into the YCbCr space. Let f1 · · · fn be n consecutive frames in a video sequence. In YCbCr system, for a frame fi , Y is taken as the intensity channel, i.e. cii = Yi (1) This luminance component is more accurate than that of Itti’s model, where an approximation cii = (Ri + Gi + Bi )/3 was used. For color componnet, Itti created four broadly tuned color channels of red, green, blue and yellow in RGB space [2], denoted as cri , cgi , cbi and cyi , respectively. Considering the conversion matrix between RGB and YCbCr, the color channels in YCbCr space would be cri = −0.813(Cbi − 128) + 2.003(Cri − 128)
(2)
cgi = −1.401(Cbi − 128) − 1.661(Cri − 128) cbi = 2.213(Cbi − 128) − 0.392(Cri − 128)
(3) (4)
cyi = 3.642(Cbi − 128) + 0.783(Cri − 128) +0.392(Cbi − 128) + 2.409(Cri − 128)
(5)
The orientation channel coi is obtained by filtering the intensity channel cii in four directions with Gabor filters (GF (θ)) o
o
o
o
coi (θ) = cii ∗ GF (θ), θ ∈ {0 , 45 , 90 , 135 } (6) Motion is another important factor that modulates visual attention. For video sequences, we use Ogale’s optical flow algorithm [4] to estimate absolute motion of image objects between consecutive frames. For three consecutive frames fi−1 , fi , fi+1 , the horizontal and vertical motion channels of fi are determined as the averaged directional optical flows between (fi−1 , fi ) and (fi , fi+1 ) Θ Θ cmΘ i = [of (fi , fi+1 ) + of (fi−1 , FI )]/2, Θ ∈ (h, v) (7) The final motion channel is a combination of the horizontal and vertical motion
cmi = [(cmhi )2 + (cmvi )2 ]1/2
(8)
By iteratively dyadic down-sampling for L times of these channels, we can create pyramids for each of these channels of the frame fi {cii (l), cri (l), cgi (l), cbi (l), cyi (l), coi (l), cmi (l)|l ∈ (0, L)} (9) where l = 0 indicates no down-sampling, i.e. the original image size. We use MPEG-4 down-sampling filter [8] to generate the pyramids instead of Itti’s Gaussian low-pass filter [2] to be compliable with existing video coding standards. Hereinafter, we omit the subscription “i” in the expressions for brevity. B. Center-surround Receptive Field Simulation A full center-surround structure is implemented to simulate the receptive fields in the HVS. The center level c and surround level s are defined as: c ∈ [0, 8], s = c + δ, δ ∈ [−3, −2, −1, 1, 2, 3] and s is thrown away if s ∈ / [0, 8]. The full center-surround receptive field profiles are computed for each pair of the five feature components: intensity, redgreen channel, blue-yellow channel, orientation, and motion, based on the computed pyramids. I(c, s) = RG(c, s) =
|ci(c) ◦ ci(s)| (10) |(rc(c) − gc(c)) ◦ (gc(s) − rc(s))| (11)
BY (c, s) = O(c, s, θ) =
|(bc(c) − yc(c)) ◦ (yc(s) − bc(s))| (12) |co(c, θ) ◦ co(s, θ)| (13)
M (c, s) =
|cm(c) ◦ cm(s)|
(14)
where the operator | ◦ | denotes to convert the size of the surround level s to the center level c through up-sampling or subsampling, and then calculate the difference. For compliance with coding standards, AVC 6-tap up-sampling filter [9] and the MPEG-4 down-sampling filter [8] are used. Accordingly, the sizes of these profiles are the same as the corresponding center levels in the pyramids. C. Non-linear Feature Combination To combine the channel information to generate one single saliency profile on certain pyramid level, the contents-based
TABLE I Q UALITATIVE P ERFORMANCE A NALYSIS OF I MAGE Q UALITY A SSESSMENT M ODELS VC: VARIANCE WEIGHED CORRELATION AFTER NONLINEAR REGRESSION SC: S PEARMAN RANK ORDER CORRELATION VC SC model JPEG2000 JPEG All JPEG2000 JPEG All PSNR 0.8962 0.8596 0.8728 0.8898 0.8409 0.8646 SSIM 0.9367 0.9283 0.9295 0.9317 0.9028 0.9174 P SN RV SP 0.9168 0.8688 0.8826 0.9161 0.8566 0.8776 SSIM V SP 0.9478 0.9365 0.9401 0.9420 0.9136 0.9267
global non-linear amplification is firstly used to normalize the profiles [2]. The processed profiles are ¯ I(c) = ¯ C(c) = ¯ O(c) =
X
N or(I(c, s))
s P
s N or(RG(c, s)) + 2 X N or (O(c, s))
(15) P
s N or(BY (c, s)) (16)
(17)
s
¯ (c) = M
X
N or (M (c, s))
(18)
s
Note that the RG and BY channels are combined to generate ¯ In order to integrate these profiles, one color channel C. Nothdurft’s nonlinear addition model [3] is employed to count for the possible overlaps between stimuli features. The bottomup attention profile (BAP) is computed as ¯ + C(c) ¯ + O(c) ¯ +M ¯ (c) BAP (c) = I(c) � � ¯ ¯ ¯ ¯ −λIC · M IN I(c), C(c) − λIO · M IN I(c), O(c) � � ¯ ¯ (c) − λCO · M IN C(c), ¯ ¯ −λIM · M IN I(c), M O(c) � � ¯ ¯ (c) − λOM · M IN O(c), ¯ ¯ (c) (19) −λCM · M IN C(c), M M
The control coefficients λ are set according to psycho-visual experiment findings [3]: λIC = 0, λIO = 0.2, λIM = 0.25, λCO = 0.8, λCM = 0.2, λOM = 0.5. IV. T OP - DOWN ATTENTION S IMULATION We implement two top-down cognitive-related features of visual attention in the current work, namely skin tone color and caption detections. As has been pointed out by many researchers [15], the skin color area indicates the appearance of people and often attracts human attention. More often than not, caption in video sequence contains much useful information and has already been used as a key element in content-based video indexing and retrieval. A. Skin Color Detection Since YCbCr color space has inherent natures in separation between luminance and chrominance and compaction of skincolor clusters, some successful skin detection methods based on YCbCr space have been developed. Among them, we adopte Hsu et.al’s elliptical skin model on nonlinear transformed chrominance components for detecting skin areas in
color images [5]. For a frame fi , the detected skin area in a color map is defined as � 1 : (x, y) ∈ skinarea SMi (x, y) = (20) 0 : otherwise where (x, y) is the pixel index. When false alarm occurs (in our algorithm, we ensure a little over-detection through adjusting the thresholds), a morphological “open” operation is applied, denoted as SM ′ = SM ⊙ se, where se is a 5x5 disk structure element. After excluding false skin regions through morphological processing, we compute a convex hull to cover the survived skin color regions, so as to combat the possible “holes” resulted from the detection. B. Caption Detection Caption in video sequence contains lots of high-level semantic information, which certainly attracts human attention. To fully utilize the temporal information, we incorporate Luo at. al’s TFV (Temporal Feature Vector) based caption detection method in our system [6]. The detected caption map is denoted as � 1 : (x, y) ∈ captionarea CMi (x, y) = (21) 0 : otherwise V. SVSP I NTEGRATION To incorporate with the pyramidal bottom-up attention profile BAP (l) , l ∈ [0, L], the top-down attention features skin map and caption map are firstly smoothed with a 5x5 Gaussian window and then iteratively filtered with MPEG-4 downsampling filters [8]. Let the generated pyramids corresponding to skin map and caption map be SP (l) and CP (l) respectively, with l ∈ [0, L]. The visual sensitivity profile is integrated as V SP (l) = BAP (l) · αSP
(l)
· β CP
(l)
l ∈ [0, L]
(22)
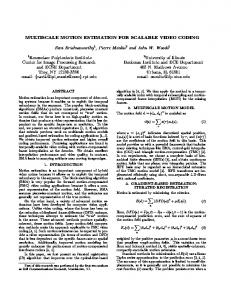
where α,β ≥ 1 are weighting coefficients. Note that when α = β = 1, the top-down features take no effect in modulating bottom-up attention map. Considering the fact that human face by its nature attracts more low-level human attention, we emphasize skin map more and α = 1.5, β = 1.2 are set in this paper. Fig.2 presents the generated level 0 VSP of 50th frame in president debate. VI. SVSP V ERIFICATION
WITH
Q UALITY A SSESSMENT
The proposed SVSP can be used to augment visual quality in either scalable (0 < l < L) or non-scalable (l = 0) scenarios. Limited by the space, we only justify its validity in quality assessment in non scalable mode. For more applications in scalable modes, one may refer to [17]. We design two simple image quality assessment algorithms by modifying the simple PSNR (Peal Signal to Noise Ratio) and well known mean SSIM (Structural SIMilarity) [7], namely P SN RV SP and SSIM V SP , as ! M X N X 2552 · [V SP (0) (x, y)]−κ V SP P SN R = 10 · log [f0 (x, y) − fd (x, y)]2 x=1 y=1 (23)
(a)
(b)
(c)
(d)
Fig. 2. (a) Frame 50 of video clip ”president debate”. (b) Frame 51 of video clip ”president debate”. (c) BAP level 0. (d) VSP level 0. M N 1 XX SSIM (x, y) · [V SP (0) (x, y)]κ M · N x=1 y=1 (24) where f0 (x, y) and fd (x, y) are original and distorted images, V SP (0) (x, y) is computed from f0 (x, y), SSIM (x, y) is the structural similarity map computed using Wang’s algorithm [7], M ,N are the image dimensions, and κ = 1 is simply used in this paper. The proposed methods are tested on LIVE image database release 2 [10] with JPEG and JPEG2000 coded images of various bit rates and collected DMOS (Different Mean Opinion Score) from subjective tests. We evaluate the quantitative performance of the two proposed metrics using methods introduced by Video Quality Experts Group (VQEG) [11]. 1) The correlation between objective and subjective scores after variance-weighted regression, which evaluates the prediction accuracy. 2) The spearman rank order correlation between objective and subjective scores, which evaluates the prediction monotonicity. As can be found in Tab.I, as well as the scatter plots in Fig. 3 the proposed VSP can effectively enhance the performances of image quality metrics by differentiating important and trivial image contents and assign dissimilar weights to different regions.
SSIM V SP =
VII. C ONCLUSION We propose the scalable visual sensitivity profile (SVSP): a hierarchy of saliency maps that simulate the bottom-up and top-down attention of the HVS. The bottom-up module is based on some earlier work with modifications and adaptations towards a hierarchical representation and more accurate simulation. The top-down module utilizes human skin-color detection and caption extraction as cognition clues. SVSP’s application in image quality assessment has been analyzed to demonstrate the validity of SVSP. ACKNOWLEDGEMENT This work was supported by National Natural Science Foundation of China (60332030, 60502034, 60625103), Shanghai Rising-Star Program (05QMX1435), Hi-Tech Research
(a)
Fig. 3.
(b)
(c) (d) Scatter plots of DMOS vs. predictions of image quality metrics
and Development Program of China 863 (2006AA01Z124), NCET-06-0409, and the 111 Project. R EFERENCES [1] A.M.Treisman, G.Gelade, ”A feature-integration theory of attention,” Cognitive Psychology, pp. 97-136, 1980. [2] Laurent Itti, ”Models of bottom-up and top-down visual attention.” Ph.D. Dissertation California Institute of Technology, Pasadena, California, 2000 [3] H.C.Nothdurft, ”Saliency from feature contrast: additivity across dimensions,” Vision Research, vol. 44, no. 10, pp. 1183-1201, 2000. [4] A.S.Ogale and Y.Aloimonos, ”A roadmap to the integration of early visual modules,” International Journal on Computer Vision:Special issue on early cognitive vision, 2006. [5] R. L. Hsu, M. bdel-Mottaleb, A. K. Jain, ”Face detection in color images,” IEEE Transactions on Pattern Analysis and Machine Intelligence, vol. 24, no. 5, pp. 696-706, 2002. [6] B. Luo, X. Tang, J. Liu, H. Zhang, ”Video caption detection and extraction using temporal information,” in IEEE International Conference on Image Processing, 1 ed Barcelona, Spain: Institute of Electrical and Electronics Engineers Computer Society, 2003, pp. 297-300. [7] Z. Wang, A.C. Bovik, H.R. Sheikh, and E.P. Simoncelli, ”Image quality assessment: from error visibility to structural similarity,” IEEE Transactions on Image Processing, vol.13, no.4, pp.600-612, April 2004. [8] ”Mpeg4 video verification model version 18.0,” JTC1/SC29/WG11 N3908, Pisa, 2002. [9] ”ITU-T Recommendation H.264 — ISO/IEC 14496-10 AVC,” 2004. [10] ”http://live.ece.utexas.edu/research/quality/subjective.htm,” 2005. [11] VQEG, ”Final Report from the Video Quality Experts Group on the Validation of Objective Models of Video Quality Assessment,” http://www. vqeg. org, Mar.2000. [12] C.Koch and S.Ullman, ”Shifts in selective visual attention:towards the underlying neural circuitry,” Human Neurobiology, vol. 4, no. 4, pp. 219-227, 1985. [13] O. Le Meur, P. Le Callet, D. Barba, and D. Thoreau, ”A coherent computational approach to model bottom-up visual attention,” IEEE Transactions on Pattern Analysis and Machine Intelligence, vol. 28, no. 5, pp. 802-817, 2006. [14] A. Oliva, A. Torralba, M. S. Castelhano, and J. M. Henderson, ”Topdown control of visual attention in object detection,” in IEEE International Conference on Image Processing, 2003, pp. 253-256. [15] Z. Lu, W. Lin, X. Yang, E. Ong, and S. Yao, ”Modeling visual attention’s modulatory aftereffects on visual sensitivity and quality evaluation,” IEEE Transactions on Image Processing, vol. 14, no. 11, pp. 1928-1942, 2005. [16] L.Itti and C.Koch, ”Computational Modeling of Visual Attention,” Nature Reviews Neuroscience, vol. 2, no. 3, pp. 194-203, 2001. [17] G. T. Zhai, Q. Chen, X. K. Yang, W. J. Zhang, ”Application and Performance of Scalable Visual Sensitivity Profile,” submitted to IEEE International Symposium on Circuits and Systems, May, 2008, Washington, USA