Annals of Operations Research, 2013, Vol. 211(1): 381-‐398. The final publication is available at link.springer.com: http://www.springerlink.com/openurl.asp?genre=article&id=doi:10.1007/s10479-‐013-‐ 1441-‐1
Scale directional distance function and its application to the measurement of eco-efficiency in the manufacturing sector Noor Asiah Ramli Faculty of Economics and Administration, University of Malaya, Kuala Lumpur, Malaysia MARA University of Technology, Shah Alam Selangor, Malaysia E-mail:
[email protected] Susila Munisamy Faculty of Economics and Administration, University of Malaya, Kuala Lumpur, Malaysia E-mail:
[email protected] Behrouz Arabi Institute of Graduate Studies, University of Malaya, Kuala Lumpur, Malaysia E-mail:
[email protected]
Abstract Directional distance function (DDF) is a recognized technique for measuring efficiency while incorporating undesirable outputs. This approach allows for desirable outputs to be expanded while undesirable outputs are contracted simultaneously. A drawback of the DDF approach is that the direction vector to the production boundary is fixed arbitrarily, which may not provide the best efficiency measure. Therefore, this study extends the previous framework of efficiency analysis to introduce a new slacks-based measure of efficiency called the scale directional distance function (SDDF) approach. This new approach determines the optimal direction to the frontier for each unit of analysis and provides dissimilar expansion and contraction factors to achieve a more reasonable eco-efficiency score. This new approach is employed to measure the eco-efficiency of the Malaysian manufacturing sector. In addition, the paper demonstrates the use of the new approach to establish target values for the reduction/expansion of outputs in order for the inefficient DMUs to achieve full eco-efficiency. The results indicate that Melaka, Pulau Pinang, Negeri Sembilan, Sabah, Sarawak and Labuan have attained full ecoefficiency while Terengganu is the least eco-efficient. The overall eco-efficiency of the manufacturing sector in Malaysia is 80.5% with wide variations across the states. Keywords Data envelopment analysis (DEA), Directional distance function (DDF), Scale directional distance function (SDDF), undesirable output, eco-efficiency
1
Annals of Operations Research, 2013, Vol. 211(1): 381-‐398.
1 Introduction Malaysia’s manufacturing industry has grown very rapidly since the early 1980s when the country witnessed a structural transformation from a predominantly agricultural economy to a more industrialized economy. This sector is especially crucial for the continuous growth and development of the Malaysian economy as it provides a significant contribution to the GDP with a 27.5 percent share of GDP in 2011. The manufacturing sector recorded the highest productivity growth of 7.56% followed by the services sector with 4.89% (Malaysia Productivity Corporation 2011). To enable the Malaysian economy to increase its competitiveness, the manufacturing sector has developed more than ten Free Industrial Zone (FIZ) areas (formerly known as Free Trade Zone areas) throughout the country as a catalyst to accelerate the value-added of the manufacturing sector. A Free Industrial Zone comprises a free zone for commercial activities, which include trading (except retail trading), breaking bulk, grading, repacking, relabeling as well as transit for manufacturing activities, specifically established for manufacturing companies that produce or assemble products mainly for export purposes. Todate, FIZ areas have been developed in Malaysia in the states of Johor, Melaka, Pulau Pinang, Perak and Selangor. Trade-off exists between economic development and preservation of the environment (Nahorski and Ravn 2000). In Malaysia, the rapid economic development is closely connected with the degradation of environmental quality. As revealed by the Department of Statistics, Malaysia (2008), the manufacturing sector is one of the main contributors to environmental pollution. Carbon dioxide, which is released by the industrial sector, is among the biggest elements contributing to pollution and poor environmental performance. In fact, the Malaysian economy is amongst the largest carbon emitters in the world. Of the developing countries in Southeast Asia, Malaysia had one of the largest carbon footprints at 7.32 metric tonnes of carbon dioxide per capita in 2007, and a total carbon dioxide emission of 148 million metric tonnes in 2009 from the burning of fossil fuels (International Energy Agency 2009). The Department of Environment (DOE), under the Ministry of Science, Technology and Environment, undertakes environmental protection through clean air legislation, i.e. Environmental Quality Act (EQA) 1974, limiting industrial and automobile emissions. However, air pollution from industrial and automobile sources is still a problem. In 2009, a survey by the Department of Statistics, Malaysia disclosed that the manufacturing sector spent about RM3057.7 million on environmental protection. The Malaysian Government is targeting to reduce the carbon dioxide emissions by up to 40% by 2020 compared to the 2005 level of 7.03 metric tonnes per capita. Thus, environmental performance is a practical tool to incentivize reduction in fuel consumption, costs and carbon emissions simultaneously. Since the last decade, environmental performance has received more attention and there has been a growth in the number of empirical and methodological studies from the application of the Data Envelopment Analysis (DEA) framework. The DEA technique, which originated from the seminal work of Charnes et al. (1978) is an estimation to measure the relative efficiency score of units of assessment based on the use of multiple inputs to produce multiple outputs. Despite the existence of many DEA-related approaches for modelling environmental performance (for instance Coli et al. 2011; Choia et al. 2012; Jaraitėa and Maria 2012; Wu et al. 2012), little attention has been given to measuring the eco-efficiency of the Malaysian manufacturing sector. To date, research has not sought to integrate carbon dioxide emissions in efficiency analysis, which is one of the main contributors to climate change and is easily calculable from material input quantities. Therefore, this study evaluates the eco-efficiency of the Malaysian manufacturing sector by using a joint production framework involving desirable (sales) and undesirable outputs (CO2 emissions) simultaneously. An approach that has gained popularity, called the directional distance function (DDF) proposed by Chung et al. (1997), uses the hyperbolic DEA method based on the notion of weakly disposable bad outputs. This approach allows for desirable outputs to be expanded while undesirable outputs are contracted simultaneously. A limitation of the DDF approach is that the direction vector to the production boundary is fixed arbitrarily, which may not provide the best efficiency measure. This is because a different direction vector may provide a different efficiency 2
Annals of Operations Research, 2013, Vol. 211(1): 381-‐398. score. Indeed, there is still no consensus concerning what is the best direction vector to be employed in this model. Therefore, this study provides an alternative solution to decision makers through the extension of the previous DDF framework by introducing a new efficiency model called the scale directional distance function (SDDF) which provides an appropriate direction for each inefficient DMU to attain full eco-efficiency. The SDDF model is calculated using the slacks-based measure (SBM) proposed by Färe and Grosskopf (2010a; 2010b). While Färe and Grosskopf (2010a; 2010b) demonstrate a slacks based measure of efficiency incorporating only input and desirable outputs, in addition, the SDDF approach, incorporates undesirable outputs to enable the measurement of eco-efficiency. This new approach is employed to measure the eco-efficiency of the Malaysian manufacturing sector. Furthermore, the paper demonstrates the use of the new approach to establish target values for the reduction/expansion of outputs in order for the inefficient DMUs to achieve full eco-efficiency. The remainder of the paper is organized as follows. In Section 2, the measurement of technical efficiency and eco-efficiency is discussed and the relevant methodological and empirical literature on productivity growth and environmental performance is reviewed. In Section 3, we discuss the DDF approach to measure eco-efficiency and introduce the new SDDF technique. Section 4 offers an explanation of the data, and is followed by empirical results on both eco-efficiency and target setting. Section 5 provides some discussion on the new model and the final section presents the conclusion and implications. 2 Literature Review The underpinning of the efficiency measurement began with the work of Debreu (1951) and Koopmans (1957). Debreu provided the first measure of efficiency, which is the ‘coefficient of resource utilization’, while Koopmans is the first who defined the concept of technical efficiency. Technical efficiency focuses on the ability to increase the output while keeping the input constant or the ability to reduce the input while keeping the output constant. Technical efficiency involves either a single or multiple input and output in the analysis. When incorporating undesirable outputs, such as pollutants, the measurement is essentially on environmental efficiency or ecological efficiency. The concept of ecological efficiency, in short, eco-efficiency, can be classified as a measurement of efficiency with the integration of environmental pollution that is regarded as undesirable outputs together with desirable outputs (Dyckhoff and Allen 2001). Since the last decade, environmental performance measurement has received more attention and there has been a growth in the number of empirical and methodological studies. Research carried out by Tyteca (1996) reviewed previous studies on environmental performance indicators and employed the index number approach to assess performance. Based on the literature, he measured the resources used, desirable outputs produced and pollutants using the index number approach. He also recommended employing the DEA approach when estimating environmental performance. Another paper, published by Sarkis (2006), employed a multitude of DEA models to gauge diverse aspects of environmental performance related to small manufacturing enterprises based on the development of hypotheses. Zhou et al. (2008) conducted a survey of previous studies whereby about 100 publications were reviewed on the measurement of environmental efficiency as well as the application of DEA. Most of the studies that were reviewed tried to employ an appropriate technique to measure the environmental performance of industries in their application area. From their review, they found that if both desirable and undesirable outputs are considered simultaneously, the DDF is one of the most frequently used to provide more reasonable results. To assess eco-efficiency, several approaches that address the separation of desirable and undesirable outputs in the analysis have been proposed. Pittman (1983) made the earliest effort to include the undesirable output in efficiency measurement. By using the translog multilateral productivity index, he calculated the shadow prices on the pollution abatement cost. However, the limitation of this model is that it can only be measured if the cost of the pollution shadow price can be estimated. In DEA efficiency measurement, several approaches have been proposed to account for undesirable outputs. An evaluation pertaining to this topic has been discussed previously by several researchers, for example, Hua and Bian (2007), Bian (2008), Liu et al. (2010) and Song et 3
Annals of Operations Research, 2013, Vol. 211(1): 381-‐398. al. (2012). One of the popular approaches to incorporate undesirable outputs in the literature is treating the undesirable output as a classical input. In this approach the variable is moved from the output side to the input side of the model. However, treating the undesirable outputs as input opposes the physical laws and standard production theory. It also leads to conceptual confusion and will not reflect the true production process in the DEA result (Seiford and Zhu 2002). Therefore, Seiford and Zhu (2002) developed the linear monotone decreasing transformation approach. This translation transforms negative data to non-negative data. Kuosmanen (2005) presents a simple formulation of weak disposability that allows for non-uniform abatement factors and preserves the linear structure of the model by introducing inactive firms in the data set. Another approach is the hyperbolic output efficiency measure whereby the undesirable outputs are treated as a nonlinear constraint in the DEA model. This model, which was introduced by Färe et al. (1989), extended the work of Pittman (1983). Using the hyperbolic approach, the efficiency measure allows the desirable outputs to be increased while the undesirable outputs are decreased asymmetrically. An alternative approach is to treat the undesirable outputs by adjusting the distance measurement in order to restrict the expansion of the undesirable outputs. The concept of this approach, as suggested by Chung et al. (1997), is to expand desirable outputs and reduce undesirable outputs simultaneously based on a given direction vector which is known as the directional distance function (DDF) approach (Chung et al. 1997). Since this approach is employed in our study, the discussion on the DDF approach to gauge eco-efficiency will be broached in the next section. Zhou et al. (2006) proposed the non-radial slacks-based measure (SBM) model extended with the incorporation of undesirable outputs. This model, an extension of Tone’s (2001) original SBM model, attempts to minimize the ratio of the average undesirable outputs reduction to the average desirable output increase. This model combines environmental and economic inefficiencies and provides a composite index for modelling economic environmental performance. According to the authors, this model provides a higher discriminating power in modelling environmental performance (Zhou et al. 2006). More recently, another paper by Bi et al. (2012) also adjusts the original SBM with the slacks-based aggregated efficiency (SAE) to include both desirable and undesirable outputs in their analysis. On the other hand, Bian (2008) extended the additive DEA model by taking into account slack variables. In recent times, Sueyoshi et al. (2010) modified the basic model of range adjusted measure (RAM) to integrate undesirable outputs. In their study, they employed two separated DEA models to estimate the operational as well as environmental performance and then combined both performances to produce a unified efficiency score. However, due to efficiency scores that are close to unity, this model may not provide a valid ranking of performance, especially for the large DMUs. Another solution is the hybrid measure proposed by Tone and Tsutsui (2011). This measure resolves the efficiency in the presence of radial and non-radial inputs or outputs with no separation of desirable and undesirable outputs. According to Tone and Tsutsui (2011), the drawback of the radial approach is the neglect of the non-radial input or output slacks while the non-radial approach, which addresses slacks directly, neglects the radial characteristics of inputs and/or outputs. Therefore, from the weaknesses above, the authors propose a hybrid measure, which follows the original model of the slack based measure. In the hybrid measure, both the desirable and undesirable outputs have been addressed in a unified framework under condition in which certain non-separable associations between some inputs and outputs exist. Another recent development is an approach proposed by Wu et al. (2013) to measure the congestion between desirable and undesirable outputs. In their suggestion, the method of Seiford and Zhu (2002) is combined with the method of Wei and Yan (2004) to develop the new framework for measuring congestion with undesirable outputs. In their new framework, the input constraint of the Seiford and Zhu (2002) model has been revised according to the Wei and Yan (2004) model so that the constraints of the new model are further relaxed than that of model Seiford and Zhu (2002). One of the most preferred approaches in eco-efficiency measurement has been DDF because it allows one to consider non-proportional changes in outputs and makes it possible to expand desirable outputs while contracting the undesirable outputs. However, there is also a major drawback using this model whereby there are no standard techniques concerning how to determine 4
Annals of Operations Research, 2013, Vol. 211(1): 381-‐398. the direction vector to the production boundary. This is because a different direction vector may provide a different efficiency score (Bian 2008). The choice of the direction vector may have an impact on the efficiency score, and therefore, the robustness of the analysis. For that reason, this paper attempts to introduce a new slacks-based measure of efficiency so that an optimal direction to the frontier can be determined for each DMU in order to achieve a more reasonable ecoefficiency score. Turning to the empirical literature, from all the studies that have been found, one of the most popular approaches in measuring environment efficiency is the DDF approach. For example, Watanabe and Tanaka (2007) measured the eco-efficiency of the industrial sector in China using DDF technique. As another sample, Mandal and Madheswaran (2010) also studied the environmental efficiency of the Indian cement industry. Employing DDF, Riccardi et al. (2012) evaluated the impact of CO2 emissions on the efficiency score of the world cement industry. The analysis compares the results with and without the incorporation of CO2 emissions. The evaluation concludes that CO2 emissions influence the efficiency score and that the emissions need to be included when measuring the efficiency score in the cement sector. More recently, Wang et al. (2013) estimated a total factor of CO2 emissions performance index using the DDF approach. The study evaluated CO2 emission performance, emission reduction potential and influences of regulatory policies in Chinese provinces. In addition, Wu et al. (2013) measured congestion with undesirable outputs of the industry in 31 administrative regions of China. The study reveals that five regions have congestion in their industry and the regions located in the east of the country perform the best in ecological efficiency. (Several samples of DDF approach on eco-efficiency measurement, see Picazo-Tadeo et al. 2005; Picazo-Tadeo and Prior 2009; Piot-Lepetit 2010; Wanga et al. 2012; Beltrán-Esteve et al. 2013) In Malaysia, Mahadevan (2002) carried out a study on the manufacturing sector from 1981 to 1996 to investigate the technical efficiency. The results indicate that the technical efficiency score in the 80s increased gradually while the score decreased reversibly in the 90s. A similar study by Jajri and Ismail in 2007 using data from 1985 to 2000 shows that the food, wood, chemical and iron industries provide a higher efficiency score compared to other industries. Both studies show consistent results in terms of the trend in technical efficiency, i.e., increase in the 80s and decrease in the 90s. With regard to the measurement of environmental efficiency, the research done by Ahmed (2006; 2007) leads the way in the Malaysian manufacturing context. Employing the non-frontier Divisia Translog Index approach, Ahmed (2006) found that industrial activities contributed to the growth rate of carbon dioxide emissions and observed a slowdown in the productivity growth of the manufacturing sector when carbon dioxide is included as a productivity indicator. Ahmed (2007) demonstrated the negative impact of organic water pollutant biochemical oxygen demand (BOD) emissions on the productivity growth of the Malaysian manufacturing sector. In contrast to the above Malaysian studies, this paper aims to evaluate the eco-efficiency of the Malaysian manufacturing sector by applying another approach of the frontier technique called the scale directional distance function (SDDF), in a joint production framework involving both desirable and undesirable outputs. 3 Model 3.1 Directional Distance Function (DDF) In conventional production theory, efficiency is measured by maximizing the production (desirable) of outputs with a restricted amount of inputs. However, when there is joint production of the desirable and undesirable outputs, the efficiency measurement is best defined by increasing desirable outputs and simultaneously decreasing undesirable outputs (Färe et al. 1989). To handle this situation, the DDF approach was introduced by Chung et al. (1997) to measure eco-efficiency. The original concept of the DDF approach is to expand the desirable output and reduce the undesirable output simultaneously based on a given direction vector (Chung et al. 1997). Ecoefficiency using the DDF on the technology T can be defined as below: 𝐷! 𝑥, 𝑦, 𝑢; 𝑔! , −𝑔! = max 𝛽: (𝑦 + 𝛽𝑔! , 𝑢 − 𝛽𝑔! ∈ 𝑇)
(1) 5
Annals of Operations Research, 2013, Vol. 211(1): 381-‐398. The distance function on the technology T (𝐷! ) above, tries to look for the extension of desirable output in the 𝑔! direction and reduction of undesirable output in the 𝑔! direction. In other words, a proportion 𝛽 seeks to increase the desirable output and reduce the undesirable output. For example, if 𝛽 is equivalent to 10%, all desirable outputs will be expanded by 10% while concurrently all undesirable outputs will also be contracted by 10%. This measurement expands desirable output and reduces undesirable output by the direction vector of 𝑔. To begin this model, some notations have been made. Let 𝑥 ∈ 𝑅!! represent an input vector, ! 𝑦 ∈ 𝑅! represent a desirable output vector while 𝑢 ∈ 𝑅!! represent an undesirable output vector. Following Chung et al. (1997), the linear program to calculate the directional output distance function in order to gauge the eco-efficiency of the mth DMU can be formulated as below: Max 𝛽! Subject to !
𝑧! 𝑥!" ≤ 𝑥!" ; 𝑖 = 1,2, … , 𝐼 !!! !
(2)
𝑧! 𝑦!" ≥ 𝑦!" + 𝛽! 𝑦!" ; 𝑗 = 1,2, … , 𝐽 !!! !
𝑧! 𝑢!" = 𝑢!" − 𝛽! 𝑢!" ; 𝑘 = 1,2, … , 𝐾 !!!
𝑧! ≥ 0 ; 𝑛 = 1,2, … , 𝑁
Where 0 ≤ 𝛽! ≤ 1 is the inefficiency score of the mth DMU, zn is the intensity variable for the nth observation, xin is the ith input of the nth DMU, yjn is the jth desirable output of the nth DMU, ukn is the kth undesirable output of the nth DMU, xim is the ith input of the mth DMU, yjm is the jth output of the mth DMU and ukm is the kth undesirable output of the mth DMU. The direction vector of 𝑔 is taken as (y,-u) along which the desirable outputs to be extended and the undesirable outputs contracted. A score of zero indicates an efficient DMU while any positive values denote inefficiency. !!" Since 𝛽! is the inefficiency scores, to obtain the eco-efficiency score, 𝜃! , is formulated as follows: !!" 𝜃! = 1 − 𝛽!
(3)
1
Note that 𝛽! is between 0 and 1, thus, 𝜃! also falls into 0 and 1 closed interval. Desirable (y)
E”
B E’
(gy, -gu)
C E
A
0
(y, u)
T D
Undesirable (u)
Fig. 1 Efficient frontier for DDF (original source: Färe and Grosskopf 2005)
1
Färe and Primont (1995) have shown that under the weak disposability, condition β ≤ 1
6
Annals of Operations Research, 2013, Vol. 211(1): 381-‐398. Figure 1 illustrates the environmental output set (T) for the DDF approach, which is bounded by 0ABCD0. Assuming that all DMUs use a similar quantity of a single input 𝑥 to produce a dissimilar quantity of a single desirable 𝑦 and a single undesirable 𝑢 output, the efficient frontier is represented by the line 0, A, B, C and D. From the illustration, DMU E is below the efficient frontier, thus it can be categorized as an inefficient DMU. Through the DDF model, a better direction is from E to E’ whereby it has an effect on the levels of both outputs – desirable and undesirable. It is determined by the direction vector of 𝑔 = (y,-u). The value of the distance function is determined by the ratio of EE’/EE”. Therefore, in Fig. 1, the directional output distance function will expand 𝑦, 𝑢 at E, along the 𝑔 direction until it hits the production boundary of (𝑦 + 𝛽𝑔! , 𝑢 − 𝛽𝑔! ) at E’. (See for example, Färe et al. 2005; Hua and Bian 2007; Bian 2008; Mandal and Madheswaran 2010) that have used (1, -1) as their direction vector). 3.2 Scale Directional Distance Function (SDDF) With the conventional DDF approach, as explained in section 3.1, the direction to expand desirable outputs and reduce undesirable outputs is made subjectively, in other words, user specified. This arbitrary direction (g = (y,-u)) may be inappropriate for each output bundle. In order to measure an appropriate direction for each inefficient DMU to attain full eco-efficiency, we develop a scale directional distance function (SDDF) approach based on the works of Färe and Grosskopf (2010a; 2010b). There are three aspects that are worth emphasizing in this new approach. First, the original DDF model (formulation (2)) is modified so that each output bundle can have a different direction to the production boundary. The objective function of the DDF model 2, which is the single contraction/expansion factor, 𝛽! has been replaced with the summation of 𝛾!" , the expansion factor for desirable outputs, and 𝛾!" , the contraction factor for undesirable outputs in the SDDF approach in formulation (4) below. This linear program is based on the slacks-based measure of efficiency. The SDDF model formulation for mth DMU, which has been adopted from Färe and Grosskopf (2010a; 2010b), is as follows: !
Max ℎ! =
!
𝛾!" + !!!
𝛾!" !!!
Subject to !
𝑧! 𝑥!" ≤ 𝑥!" ; 𝑖 = 1,2, … , 𝐼 !!! !
(4) 𝑧! 𝑦!" ≥ 𝑦!" + 𝛾!" . 1 ; 𝑗 = 1,2, … , 𝐽
!!! !
𝑧! 𝑢!" = 𝑢!" − 𝛾!" . 1 ; 𝑘 = 1,2, … , 𝐾 !!!
𝑧! , 𝛾!" , 𝛾!" ≥ 0 ; 𝑛 = 1,2, … , 𝑁 !""# Since ℎ! is the inefficiency score, to obtain the eco-efficiency score, 𝜃! , is formulated as follows: !""# 𝜃! = 1 − ℎ!
(5)
Second, the optimal solution to (4) is used to derive the direction vector to the production ! boundary. When !!! 𝛾!" + ! !!! 𝛾!" > 0, the scale direction for the jth desirable output and kth undesirable output for the DMU assessed can be obtained by the following equation: 𝑆𝐷! =
∗ !!" ! ! ! ! !!! !!" !!! !"
(6)
and 7
Annals of Operations Research, 2013, Vol. 211(1): 381-‐398. 𝑆𝐷! =
∗ !!" ! ! ! ! !!! !!" !!! !"
∗ ∗ Otherwise, if 𝛾!" and 𝛾!" are equal to 0, it denotes that the particular DMU is located on the efficient frontier, then the direction vectors SDj and SDk can be chosen arbitrarily. Equation (6) explains that each entry of the direction vector from model (4) is divided by the summation of the expansion rate of the desirable and contraction rate of the undesirable output. The minimum and maximum direction for SDj and SDk is between 0 and 1 (0 ≤ 𝑆𝐷! , 𝑆𝐷! ≤ 1). In addition, the total of scale direction 𝑆𝐷! and 𝑆𝐷! must also be equal to 1 (𝑆𝐷! + 𝑆𝐷! = 1) to get an appropriate scale direction for each desirable and undesirable output variable. Third, from the scale directions obtained, the target value for each DMU can be measured. The SDDF approach can also be utilized for target setting to determine the target value for inefficient DMUs in order to obtain full eco-efficiency. The target value is measured by the summation of multiplication of the intensity variable (zn) from formulation (4) with the actual value of desirable (yjn) and undesirable (ukn) outputs for each DMU as below: !
𝑧! 𝑦!" !!!
and
(7)
!
𝑧! 𝑢!" !!!
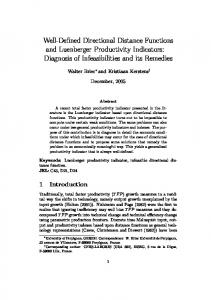
The target value will be similar to the actual value if the mth DMU obtains a zero value for the objective function in model (4). In other words, the mth DMU is 100% fully efficient. To demonstrate the SDDF model, assume that all DMUs use a similar quantity of a single input 𝑥 to produce a dissimilar quantity of a single desirable 𝑦 and a single undesirable 𝑢 output. The set of five DMUs (y, u) are A = (2, 1), B = (3, 2), C = (4, 5), D = (1, 1.5) and E = (2.5, 4.6) (see Fig. 2). Under the VRS model, it is clear that DMUs A, B and C are efficient while the other two DMUs (D and E) are clearly inefficient. Employing the DDF model (equation 2) with the direction vector (gy, -gu) = (y,-u), DMU D is projected onto the efficient frontier at D’ = (2, 1) and DMU E is projected onto the efficient frontier at E’ = (3.3, 3.1). For DMUs D and E, the efficiency score associated with the direction vector of (y,-u) are 0.67 and 0.64, respectively. Employing the SDDF model (equation 4), DMU D and E are projected onto D” = (2.5, 1.5) and E” = (3, 2), respectively. An appropriate direction vector for DMU D and E computed from equation (6) is (1, 0) and (0.19, -0.81), respectively. The efficiency scores with the respective direction vector for D and E are 0.63 and 0.36, respectively. Desirable (y)
4
E’
3 D’
2 (gy, -gu)
C
E” D” B E
A 1
D Undesirable (u)
-1
0
1
2
3
4
5
Fig. 2 DDF and SDDF direction vector
8
Annals of Operations Research, 2013, Vol. 211(1): 381-‐398. Figure 2 above demonstrates how the SDDF approach measures the direction for inefficient DMUs to achieve the efficiency frontier. The SDDF model expands and contracts the desirable and undesirable outputs by a different proportion and this model also determines the optimal direction to the frontier for each of the inefficient DMU. The direction in this approach is determined by the additive slack of the desirable and undesirable output. 4 Data and Results 4.1 Data This study considers the manufacturing sector in 15 states throughout Malaysia. The state level data for the observed period of 2009 was obtained from the Department of Statistics, Malaysia. In this analysis, two inputs and two outputs are employed. The inputs are operating expenditure (opex) and capital. Operating expenditure covers all the costs that are involved in the production process in the manufacturing sector including material, salaries and wages and electricity for the year of 2009. The value of assets has been used as a proxy to the capital. Assets cover all goods, new or used, tangible or intangible, which have a normal economic life span of more than one year. All the above items are the main factors in productivity process. Based on the previous studies on productivity and efficiency, it is typical to use operating expenditure and capital as inputs (Ball et al. 2004; Färe et al. 2006; Watanabe and Tanaka 2007). In terms of the production outputs, they consist of one desirable and one undesirable output. The desirable output is sales in the manufacturing industry while the carbon dioxide (CO2) emission factor has been included as an undesirable output. It has been determined that among the industrial sources of air pollution, CO2 is the main by-product of industrial activities as the combustion of fossil fuels in the manufacturing process that have to be controlled. Therefore, CO2 emission has been included as an undesirable output in this analysis. In addition, CO2 also is the element that has been frequently used by previous studies as an undesirable output (Arocena and Waddams Price 2002; Aiken and Pasurka 2003; Sarkis and Talluri 2004; Lu and Lo 2007). Combustion fuels such as diesel oil, petrol (gasoline), fuel oil, and natural gas of the manufacturing sector was used to calculate CO2 emissions. The calculation which is guided by the 2006 Intergovernmental Panel on Climate Change (IPCC) guidelines for National Greenhouse Gas Inventories (Eggleston et al. 2006) is based on the total amount of fuels combusted and the averaged carbon content of the fuels. Table 1 above provides the summary descriptive statistics of the data set employed in this study. Table 1 Descriptive statistics of the data set for 15 states in 2009 Opex (x1) Capital (x2) Sales (y1) Variables RM ‘000 RM ‘000 RM ‘000 Maximum 176128357 51688873 187570618 Minimum 1002389 425813 1050261 Average 43102384 13057985 47003084 St Deviation 48475297 13274629 51469812
CO2 (u1) ‘000 tonne 2194 30 653 616
4.2 Eco–Efficiency Table 2 presents the results of the eco-efficiency analysis of the manufacturing sector (including the Federal Territories of Kuala Lumpur and Labuan) throughout the 15 states of Malaysia. The analysis was conducted using the software GAMS 23.4 solver. The scores for ecoefficiency are obtained from equation (3) and (5) for DDF and SDDF, respectively. The results are presented by the industrial grouping of the state, i.e., free industrial zone (FIZ) states consist of Johor, Melaka Pulau Pinang, Perak as well as Selangor, while the non-free industrial zone (N-FIZ) states consist of Kedah, Kelantan, Negeri Sembilan, Pahang, Perlis, Terengganu, Sabah, Sarawak, the Federal Territory of Kuala Lumpur, as well as the Federal Territory of Labuan. The ecoefficiency score using the DDF approach is calculated in columns two and four while columns three and five represent the rank of each state for the respective efficiency measure. The direction 9
Annals of Operations Research, 2013, Vol. 211(1): 381-‐398. vector of (1,-1) and (1,-2) were employed in order to gauge the eco-efficiency from equation (3). The sixth and seventh columns present the eco-efficiency scores using the SDDF approach and the rank. We focus on the results of DDF (g = (y,-u) = (1,-1)) that are presented in column 2 of Table 2. The eco-efficiency scores via the DDF approach indicate the extent of desirable output expansion and undesirable output reduction. For instance, Johor was 90.0% efficient. This result suggests that Johor could expand its desirable output by as much as 10% while concurrently contracting its undesirable output by 10% to become fully eco-efficient. It can be observed that Terengganu has the greatest potential to expand its desirable output by up to 40.6% while concurrently contracting the undesirable output by about 40.6% since this state is significantly below the efficient frontier. The DDF results (Column 2) disclose that six states appear as fully eco-efficient – Melaka, Pulau Pinang, Negeri Sembilan, Sabah, Sarawak and Labuan – while the least eco-efficient is Terengganu (Rank 15) with a score of 59.4%. Melaka, with limited heavy industries and approximately 1,071 manufacturing establishments that release air pollution, obtained full ecoefficiency. To explain the result of Melaka, the amount of undesirable output (CO2) released by manufacturing activities in this state is not too high, while the desirable output (sales) contributed is also moderate with a limited amount of operating cost. Hence, Melaka is categorized as 100% eco-efficient. A similar situation also occurs for Pulau Pinang with 100% eco-efficiency. Besides Melaka and Pulau Pinang, Sarawak, which is the largest state in Malaysia, also obtained full ecoefficiency. This result is unsurprising, as Sarawak is the largest state in Malaysia with 80% of its total land area covered by forest. Therefore, Sarawak is largely free of air pollution. Another state with a score of 100% is the federal territory of Labuan. This small state focuses more on the tourism sector rather than the manufacturing sector. Therefore, the impact on air pollution in Labuan is marginal. As for Kuala Lumpur, it is the capital of Malaysia and is the administrative and commercial centre with no heavy industry. Therefore, the impact on air pollution released by the manufacturing sector is also marginal. Thus, with a score of 99.3%, Kuala Lumpur (Rank 7) is close to the efficient frontier. Table 2 Results of eco-efficiency score and rank for each state using DDF and SDDF models States EE score (%) EE score (%) EE score (%) Rank Rank Rank FIZ DDF g = (1,-1) DDF g = (1,-2) SDDF 1. Johor 90.0 % 8 88.0 % 7 49.4 % 14 2. Melaka 100 % 1 100 % 1 100 % 1 3. Pulau Pinang 100 % 1 99.7% 4 100 % 1 4. Perak 79.3 % 13 66.1 % 12 77.1 % 12 5. Selangor 89.7 % 9 85.1 % 8 26.9 % 15 Geometric Mean 91.4 % 86.8 % 63.4 % N-FIZ 6. Kedah 87.5 % 10 70.2 % 10 89.4 % 10 7. Kelantan 85.8 % 11 84.1 % 9 97.8 % 9 8. Negeri Sembilan 100 % 1 98.1 % 5 100 % 1 9. Pahang 81.5 % 12 69.0 % 11 81.1 % 11 10. Perlis 74.8 % 14 64.8 % 13 98.8 % 8 11. Terengganu 59.4 % 15 60.7 % 14 53.9 % 13 12. Sabah 100 % 1 100 % 1 100 % 1 13. Sarawak 100 % 1 100 % 1 100 % 1 14. Kuala Lumpur 99.3 % 7 88.2 % 6 99.5 % 7 15. Labuan 100 % 1 50.0 % 15 100 % 1 Geometric Mean 87.7 % 76.5 % 90.7 % Total Geometric Mean 88.9 % 79.8 % 80.5 % Note : EE = Eco-efficiency
This finding also explains that the average eco-efficiency score using the DDF approach for FIZ states (91.4%) is slightly higher than the N-FIZ states (87.7%). This result discloses that the Malaysian manufacturing activity in the FIZ states, which is categorized under industrial area, performs better than the N-FIZ area. The results may appear to be counter intuitive as these states have a lot of manufacturing activities likely to release air pollution. However, note that eco10
Annals of Operations Research, 2013, Vol. 211(1): 381-‐398. efficiency takes into account undesirable outputs as well as desirable outputs in which, ecoefficiency measures ecological efficiency as well as both economic and ecological efficiencies. In addition, these results are also consistent with the results reported by Watanabe and Tanaka (2007). They found that five coastal provinces/municipalities that have attracted a large amount of foreign direct investment manage to obtain a high score in efficiency when both desirable and undesirable outputs are incorporated. These results exhibit that these five coastal provinces/municipalities are comparable with the states under FIZ category in this study. Both the five coastal provinces/municipalities and the states under FIZ category focus more on foreign direct investment activities and both manage to achieve high efficiency not only on their industrial production but also on their environmental management. Among the states under the FIZ area, Perak (Rank 13) is one of the most eco-inefficient states. This is in keeping with the report that was published by the Department of Environment in 2008 identifying Perak as one of the states with numerous sources of industrial air pollution (Department of Statistics Malaysia 2008). The results for Perak also disclose that this state is not using the input resources appropriately while producing the output. Looking at the overall picture, Malaysia, as a whole obtained an eco-efficiency score of 88.9%, which ranges between 59.4% and 100% across the states. Column 4 of Table 2 presents the DDF results determined by the direction vector of g = (y,-u) = (1,-2), which helps illustrate the impact of the different direction vector to the production boundary on the eco-efficiency score. It is observed that the number of fully efficient observations drops by half (from six to three). Labuan, which is efficient under the direction vector of (1,-1), is inefficient under a direction vector of (1,-2). The eco-efficiency scores are inconsistent under different direction vectors. These results exhibit that utilizing a different direction vector may provide a different eco-efficiency score and perturb the ranking. Thus, the DDF approach lacks robustness since the directions are arbitrarily fixed. Turning to the results using the SDDF approach in Table 2, it can be seen that, generally, the results are rather consistent between DDF and SDDF with the same six observations obtaining full eco-efficiency. The only exceptions are Johor and Selangor, whereby the eco-efficiency score declined dramatically from 90% to 49.4% and 89.7% to 26.9%, respectively. However, these results are more convincing since Johor and Selangor, which are in the FIZ category, have many heavy industries that release higher levels of air pollution, therefore, these states should intuitively attain lower eco-efficiency score. Previous studies in the Malaysian manufacturing sector by Mohamad and Said (2010) and Ismail (2009) provide conflicting results. Unlike our study, these previous studies do not incorporate undesirable outputs in the DEA efficiency measurement. Nevertheless, the results of Ahmed (2006) corroborate our findings where employing the non-frontier DivisiaTranslog Index, he found that the total factor productivity growth regressed about 0.12% during the study period between 1987 and 2001 when pollutant emissions variables was added to the model. According to Ahmed (2006), the period of 1987 to 2001 was indeed the golden era of the Malaysian industrial development, and consequently, it generated high levels of pollutions. Borhan and Ahmed (2012) also found that Malaysian economic growth has an impact on air and water pollutions. The continued rapid industrial development in Malaysia in the last decade has spawned increasing levels of pollution, particularly in the free industrial zones of Johor and Selangor, as observed in this study. Figure 3 depicts in graphical form the difference in eco-efficiency scores between the DDF and SDDF approach. In terms of the geometric means for the two categories of states, interestingly, the SDDF approach demonstrates that the geometric mean for the N-FIZ area (80.5%) is higher than for the FIZ area (63.4%) reversing the results of the DDF approach. This is largely due to the huge drop on the eco-efficiency scores for two states in the FIZ category, i.e., Johor and Selangor.
11
Annals of Operations Research, 2013, Vol. 211(1): 381-‐398.
Fig. 3 The difference in eco-efficiency scores between the DDF (g = (1,-1)) and SDDF approach 4.3 Target Setting Based on the eco-efficiency scores presented in Table 2 above, we further calculate the expansion rate of the desirable and contraction rate of the undesirable output and demonstrate the target value for each state in order to obtain full eco-efficiency using the SDDF approach. The scale directions of the desirable and undesirable outputs are obtained from equation (6) while the target value for each state is measured from equation (7). The results are presented in Table 3. The scale direction vector for sales and CO2 are calculated in columns two and three. Columns four and five represent the target value for sales and CO2 while change percentages are listed in columns six and seven. Using the scale directional distance function (SDDF) approach, the ‘scale direction’ column indicates the extent of desirable output (sales) expansion and undesirable output (CO2) reduction. The ‘target value’ column suggests the levels of sales and CO2 that each state should produce in order to achieve full eco-efficiency, while the ‘change (%)’ column shows in percentage terms how much the target value of sales and CO2 need to be increased and decreased from the actual value, respectively. By referring to previous research, the original DDF approach could suggest that the states should expand and contract both desirable and undesirable outputs by a single scalar without increasing the input. Nevertheless, in this analysis, through the SDDF approach, the states can expand and contract the desirable and undesirable outputs by different proportions. For instance, Johor could expand its desirable output (sales) by 2.65% while concurrently contracting its undesirable output (CO2) by 73.11% to attain full eco-efficiency. From Table 3, the scale direction with a value of zero exhibits that no change to the actual value of outputs is required as the expansion of desirable and contraction of undesirable output become zero. This is because this observation is already located on the frontier. For instance, Melaka, Pulau Pinang, Negeri Sembilan, Sabah, Sarawak and Labuan are not required to increase or decrease their value of sales and CO2 since these states have been assigned an eco-efficiency score of 100 percent. On the other hand, Perak, Kedah, Kelantan, Pahang and Kuala Lumpur need not increase their sales but should decrease their CO2 output. The rest of the observations need to simultaneously increase their sales as well as decrease their CO2 emissions in order to achieve full eco-efficiency scores. Since all observations, except for the fully efficient ones have to reduce their CO2 emissions, this finding shows that the Malaysian states need to prioritize the reduction of CO2 and later increase their sales. This is also supported by the fact that the scale direction for undesirable output is very much larger than the desirable output. Table 3 Results of scale direction, target value and change for the inefficient state States Scale direction Target value Change (%) Sales CO2 Sales (RM ‘000) CO2(‘000 tonne) Sales CO2 FIZ 1. Johor 0.034 -0.966 123911857 393 2.65 73.11 2. Melaka 0 0 53968579 171 0 0 3. Pulau Pinang 0 0 96473350 1013 0 0 4. Perak 0 -1 26237194 102 0 83.12 5. Selangor 0.004 -0.996 188026529 596 0.24 72.85 N-FIZ 6. Kedah 0.001 -0.999 22138867 90 0.22 71.94 7. Kelantan 0 -1 3022240 10 0 82.90 8. Negeri Sembilan 0 0 36986788 232 0 0 9. Pahang 0 -1 24538379 122 0 77.25 12
Annals of Operations Research, 2013, Vol. 211(1): 381-‐398. 10. Perlis 11. Terengganu 12. Sabah 13. Sarawak 14. Kuala Lumpur 15. Labuan
0.002 0.013 0 0 0 0
-0.998 -0.987 0 0 -1 0
1133340 24069986 28808284 57254510 21342086 1904044
4 76 492 1191 175 233
7.91 5.14 0 0 0 0
88.03 92.91 0 0 6.1 0
The results presented for scale direction are almost consistent with the change percentage for sales and CO2. Terengganu possesses the highest change percentage (92.91%) for CO2 whereby this state needs to reduce the amount of CO2 from the actual value of 1075 metric tonnes to the target value of 76 metric tonnes. The achievement of this goal in the short-term appears daunting. Some policy implications will be discussed in the conclusion section so that the amount of CO2 can be reduced gradually in order to achieve the targeted CO2 reduction by the Malaysian Government. 5 Discussion To compare between the DDF and SDDF approaches, some methodological reasons can be taken into consideration for the differences between these two approaches. The original concept of the direction vector in the DDF approach is determined by the method of ratio. The ratio of EE’/EE” can be found in Fig. 1. Giving the expansion of desirable outputs and reduction of undesirable outputs simultaneously with an arbitrary direction (g = (y,-u)) may provide an inappropriate direction for each output variable. This is the drawback of using this approach in as much as there are no standard techniques concerning how to determine the direction vector. This is because a different direction vector may provide a different efficiency score (Bian 2008). The results that have been presented in the previous section in Table 3 exhibit some differences in the DDF approach when utilizing the different direction vector. Labuan, for instance, has become one of the top performers (Rank 1) by utilizing the direction vector of (1,-1). On the other hand, Labuan appears to be the least eco-efficient (Rank 15) by utilizing the direction vector of (1,-2). In addition, the geometric mean by utilizing the direction vector of (1,-1) is generally higher than utilizing the direction vector of (1,-2) (except for Terengganu). The new model with SDDF can determine an appropriate direction while obtaining a more reasonable eco-efficiency score employing the slacks-based measure. The direction vector in this approach is different from the original concept of the DDF approach whereby it is determined by the additive slack of the desirable and undesirable output. This direction is more appropriate because the DMUs can expand and contract the desirable and undesirable outputs by different proportions given by the assumption. The proposed method is particularly useful when the DMUs want to identify the amount of undesirable output that needs to be reduced to attain full ecoefficiency and provides a reasonable direction for the decision makers to achieve a higher target in their productivity. 6 Conclusion and Recommendations This study provides a methodological contribution through the enhancement of the DDF method for measuring eco-efficiency. This study extends the previous framework of efficiency analysis to introduce a new slacks-based measure of efficiency called the SDDF approach. This new approach determines the optimal direction to the frontier for each unit of analysis and provides dissimilar expansion and contraction scales to achieve a more reasonable eco-efficiency score. The SDDF approach also allows for the establishment of target values for the reduction/expansion of outputs in order for the inefficient states to achieve full eco-efficiency. From the results obtained, we found that the manufacturing sector in Melaka, Pulau Pinang, Negeri Sembilan, Sabah, Sarawak and Labuan are the top performers with full eco-efficiency in this study. The results also show that if each state desires to achieve full eco-efficiency, they have to prioritize the reduction of CO2 pollution over increasing sales. This study is especially useful in the Malaysian context, as the integration between industrial production and environmental performance is quite new. The incorporation of both desirable and 13
Annals of Operations Research, 2013, Vol. 211(1): 381-‐398. undesirable outputs in the efficiency analysis is very important since the emission of environmental pollutants is of great concern to the nation. This empirical study may also provide some implications to the Government when formulating policy, laws and regulations pertaining to any environmental performance issues, particularly concerning serious environmental damage caused by industrial pollutants in Malaysia. The study highlights that by using the SDDF approach, the FIZ states are less eco-efficient due to the high levels of pollutants in these areas. The environmental regulation that is implemented currently needs to be improved so that the productivity growth is in balance with the environmental performance. For instance, India implemented the concept of win-win opportunities in the sugar industry whereby environmental regulation has encouraged the firms to reduce pollution. By offering incentives for introducing innovative resource conservation measures for environmental management, this policy may ensure that pollution is reduced while increasing the productivity (Murty and Kumar 2003). For individual firms, it is important to incorporate the undesirable output in efficiency measurement because economic, social as well as environmental efficiency is a necessary step towards sustainable development. The application may also assist individual firms to be more concerned with environmental protection while obtaining the profits for the firms. The balancing between environmental aspects as well as profits may become a good trend to be followed among the firms. In addition, this analysis may be beneficial for productivity comparison across the firms or particular industries with regard to environmental protection. For instance, if this analysis is implemented at the firm level, it may provide appropriate information in terms of environmental efficiency for the Environmental Management System (EMS) for the awarding of the ISO 14000 certification to any qualified firm. ISO 14000 has a positive impact on a firm’s performance, especially on its perceived economic and environmental impact. Acknowledgement The research is financed by the postgraduate research fund, University of Malaya, No. PS168-2010A. References Ahmed, E. M. (2006). Carbon dioxide emissions, impact on Malaysia's manufacturing productivity growth. World Review of Science, Technology and Sustainable Development,3, 58-69. Ahmed, E. M. (2007). The Impact of Biochemical Oxygen Demand Emissions on Malaysia's Manufacturing Productivity Growth. Global Economic Review, 36, 305-319. Aiken, D. V., & Pasurka, C. A. (2003). Adjusting the measurement of US manufacturing productivity for air pollution emissions control. Resource and Energy Economics, 25, 329-351. Arocena, P., & Waddams Price C. (2002). Generating efficiency: economic and environmental regulation of public and private electricity generators in Spain. International Journal of Industrial Organization, 20, 41-69. Ball, V. E., Lovell, C. A. K., Luu, H., & Nehring, R. (2004). Incorporating Environmental Impacts in the Measurement of Agricultural Productivity Growth. Journal of Agricultural and Resource Economics, 29, 436. Beltrán-Esteve, M., Gómez-Limón, J. A., Picazo-Tadeo, A. J., & Reig-Martínez, E. (2013). A metafrontier directional distance function approach to assessing eco-efficiency. Journal of Productivity Analysis, 1-15. Bi, G., Luo, Y., Ding, J., & Liang, L. (2012). Environmental performance analysis of Chinese industry from a slacks-based perspective. Annals of Operations Research, 1-16. Bian, Y. (2008). Efficiency Evaluation with Undesirable Factors Based on DEA. 4th International Conference on Wireless Communications, Networking and Mobile Computing, 1-5. Borhan, H., & Ahmed, E. M. (2012). Green Environment: Assessment of Income and Water Pollution in Malaysia. Procedia - Social and Behavioral Sciences, 42, 166-174. Charnes, A., Cooper, W. W., & Rhodes E. (1978). Measuring the efficiency of decision-making units. European Journal of Operational Research, 2, 429-444. Choia, Y., Zhang, N., & Zhou, P. (2012). Efficiency and abatement costs of energy-related CO2 emissions in China: A slacks-based efficiency measure. Applied Energy, 98, 198-208. 14
Annals of Operations Research, 2013, Vol. 211(1): 381-‐398. Chung, Y. H., Färe, R., & Grosskopf S. (1997). Productivity and Undesirable Outputs: A Directional Distance Function Approach. Journal of Environmental Management, 51, 229-240. Coli, M., Nissi, E., & Rapposelli, A. (2011). Monitoring environmental efficiency: An application to Italian provinces. Environmental Modelling & Software, 26(1), 38-43. Debreu, G. (1951). The coefficient of resource utilization. Econometrica: Journal of the Econometric Society, 273-292. Department of Statistics, Malaysia. (2008). Compendium of Environment Statistics.Department of Statistics, Malaysia. Dyckhoff, H., & Allen, K. (2001). Measuring ecological efficiency with data envelopment analysis (DEA). European Journal of Operational Research, 132, 312-325. Eggleston, Simon, Buendia, L., Miwa, K., Ngara, T., & Tanabe, K. (2006). IPCC Guidelines for National Greenhouse Gas Inventories. Intergovernmental Panel on Climate Change. Färe, R., & Grosskopf, S. (2005). New directions: efficiency and productivity. Springer. Färe, R., & Grosskopf, S. (2010a). Directional distance functions and slacks-based measures of efficiency. European Journal of Operational Research, 200, 320-322. Färe, R., & Grosskopf, S. (2010b). Directional distance functions and slacks-based measures of efficiency: Some clarifications. European Journal of Operational Research, 206, 702. Färe, R., Grosskopf, S., Lovell, C. A. K., & Pasurka, C. (1989). Multilateral Productivity Comparisons When Some Outputs are Undesirable: A Non-Parametric Approach. The Review of Economics and Statistics, 71, 90-98. Färe, R., Grosskopf, S., Noh, D-. W, & Weber, W. (2005). Characteristics of a polluting technology: theory and practice. Journal of Econometrics, 126, 469-492. Färe, R., Grosskopf, S., & Weber, W. L. (2006). Shadow prices and pollution costs in U.S. agriculture. Ecological Economics,56, 89-103. Färe, R., & Primont, D. (1995). Multi-output production and duality: theory and applications: Springer. Hua, Z., & Bian, Y. (2007). Modeling Data Irregularities and Structural Complexities in Data Envelopment Analysis. Springer. International Energy Agency. (2009). Key World Energy Statistics.International Energy Agency. Ismail, R. (2009). Technical efficiency, technical change and demand for skills in Malaysian foodbased industry. European Journal of Social Sciences, 9, 504-515. Jajri, I., & Ismail, R. (2007). Technical Efficiency, Technological Change and Total Factor Productivity in Malaysian Manufacturing Sector. The ICFAI Journal of Industrial Economics, 4, 63-75. Jaraitėa, J., & Maria, C. D. (2012). Efficiency, productivity and environmental policy: a case study of power generation in the EU. Energy Economics, 34(5), 1557-1568. Koopmans, T. C. (1957). Three essays on the state of economic science. McGraw-Hill New York. Kuosmanen, T. (2005). Weak disposability in nonparametric production analysis with undesirable outputs. American Journal of Agricultural Economics, 87, 1077-1082. Liu, W., Meng, W., Li, X., & Zhang, D. (2010). DEA models with undesirable inputs and outputs. Annals of Operations Research, 173, 177-194. Lu, W.-M., & Lo, S.-F. (2007). A closer look at the economic-environmental disparities for regional development in China. European Journal of Operational Research, 183, 882894. Mahadevan, R. (2002). A DEA Approach to Understanding the Productivity Growth of Malaysia's Manufacturing Industries. Asia Pacific Journal of Management, 19, 587-600. Malaysia Productivity Corporation. (2011). Productivity Report 2010/2011. Malaysia Productivity Corporation. Managi, S. (2006). Are there increasing returns to pollution abatement? Empirical analytics of the Environmental Kuznets Curve in pesticides.Ecological Economics, 58, 617-636. Mandal, S. K., & Madheswaran, S. (2010). Environmental efficiency of the Indian cement industry: An interstate analysis. Energy Policy, 38, 1108-1118. Mohamad, N. H., & Said, F. (2010). Decomposing productivity growth in Malaysian food manufacturing industry. African Journal of Business Management, 4, 3522-3529. Murty, M. N., & Kumar, S. (2003). Win-win opportunities and environmental regulation: testing of porter hypothesis for Indian manufacturing industries. Journal of Environmental Management, 67, 139-144. 15
Annals of Operations Research, 2013, Vol. 211(1): 381-‐398. Nahorski, Z., & Ravn, H. F. (2000). A review of mathematical models in economic environmental problems. Annals of Operations Research, 97, 165-201. Picazo-Tadeo, A. J., & Prior, D. (2009). Environmental externalities and efficiency measurement. Journal of Environmental Management, 90, 3332-3339. Picazo-Tadeo, A. J., Reig-Martínez, E., & Hernandez-Sancho, F. (2005). Directional distance functions and environmental regulation. Resource and Energy Economics, 27, 131-142. Piot-Lepetit, I. (2010). Technological externalities and environmental policy. How to simulate manure management regulation within a DEA framework. Annals of Operations Research, 1-18. Pittman, R. W. (1983). Multilateral Productivity Comparisons With Undesirable Outputs. Economic Journal, 93, 883-891. Riccardi, R., Oggioni, G., & Toninelli, R. (2012). Efficiency analysis of world cement industry in presence of undesirable output: Application of data envelopment analysis and directional distance function. Energy Policy, 44, 140-152. Sarkis, J. (2006). The adoption of environmental and risk management practices: Relationships to environmental performance. Annals of Operations Research, 145, 367-381. Sarkis, J., & Talluri, S. (2004). Ecoefficiency Measurement using Data Envelopment Analysis: Research and Practitioner issues. Journal of Environmental Assessment Policy & Management, 6, 91-123. Seiford, L. M., & Zhu, J. (2002). Modeling undesirable factors in efficiency evaluation. European Journal of Operational Research, 142, 16-20. Song, M., An, Q., Zhang, W., Wang, Z., & Wu, J. (2012). Environmental efficiency evaluation based on data envelopment analysis: A review. Renewable and Sustainable Energy Reviews, 16, 4465-4469. Sueyoshi, T., Goto, M., & Ueno, T. (2010). Performance analysis of US coal-fired power plants by measuring three DEA efficiencies. Energy Policy, 38, 1675-1688. Tone, K. (2001). A slacks-based measure of efficiency in data envelopment analysis. European Journal of Operational Research, 130, 498-509. Tone, K., & Tsutsui, M. (2011). Applying an Efficiency Measure of Desirable and Undesirable Outputs in DEA to US Electric Utilities. Journal of CENTRUM Cathedra, 4, 236-249. Tyteca, D. (1996). On the measurement of the environmental performance of firms-a literature review and a productive efficiency perspective. Journal of Environmental Management, 46, 281-308. Wang, Q. W., Zhou, P., Shen, N., & Wang, S. S. (2013). Measuring carbon dioxide emission performance in Chinese provinces: A parametric approach. Renewable and Sustainable Energy Reviews, 21, 324-330. Wanga, Q., Zhou, P., & Zhou, D. (2012). Efficiency measurement with carbon dioxide emissions: The case of China. Applied Energy, 90, 161-166. Watanabe, M., & Tanaka, K. (2007). Efficiency analysis of Chinese industry: A directional distance function approach. Energy Policy, 35, 6323-6331. Wei, Q. L., & Yan, H. (2004). Congestion and returns to scale in data envelopment analysis. European Journal of Operational Research, 153, 641-660. Wu, F., Fan, L. W., Zhou, P., & Zhou, D. Q. (2012). Industrial energy efficiency with CO2 emissions in China: A nonparametric analysis. Energy Policy, 49, 164-172. Wu, J., An, Q., Xiong, B., & Chen, Y. (2013). Congestion measurement for regional industries in China: A data envelopment analysis approach with undesirable outputs. Energy Policy, 57, 7-13. Zhou, P., Ang, B. W., & Poh, K. L. (2006). Slacks-based efficiency measures for modeling environmental performance. Ecological Economics, 60, 111-118. Zhou, P., Ang, B. W., & Poh, K. L. (2008). A survey of data envelopment analysis in energy and environmental studies. European Journal of Operational Research,189, 1-18.
16