Jul 18, 2008 - Compared to single bond breaking, the existence of the chain introduces two new aspects into rupture dynamics: the non-Markovian aspect in the barrier crossing and ... rupture occurs on a time scale shorter than the Rouse.
Scaling in rupture of polymer chains S. Fugmann and I.M. Sokolov
arXiv:0807.2942v1 [cond-mat.soft] 18 Jul 2008
Institut f¨ ur Physik, Humboldt-Universit¨ at Berlin, Newtonstrasse 15, 12489 Berlin, Germany We consider the rupture dynamics of a homopolymer chain pulled at one end at a constant loading rate r. Compared to single bond breaking, the existence of the chain introduces two new aspects into rupture dynamics: the non-Markovian aspect in the barrier crossing and the slow-down of the force propagation to the breakable bond. The relative impact of both these processes is investigated, and the second one was found to be the most important at moderate loading rates. The most probable rupture force is found to decrease with the number of bonds as fmax ∝ const − (ln(N/r))2/3 and finally to approach a saturation value independent on N . All our analytical findings are confirmed by extensive numerical simulations. PACS numbers: 82.37.-j, 05.40.-a
Modern developments of micromanipulation techniques made possible the experiments on the mechanical response of single molecules to a well-defined load. The typical setup here is the load ramping in which the force grows linearly in time until the molecule breaks or changes its structure. Examples are single molecule pulling experiments [1, 2, 3, 4, 5, 6] and the ones on protein unfolding [7]. The dynamic force spectroscopy [7, 8] delivering the complete spectrum of the rupture force versus the loading rate offers an extremely powerful tool to determine the bonds’ strengths and gives deep insights into the internal dynamics of the structure under study [9, 10, 11, 12, 13]. From the theoretical point of view the rupture of a bond under a constant loading rate can be described as a thermally activated escape process from a timedependent potential well [10, 11, 12, 14, 15, 16]. Dudko et al. [10] approximated the energy landscape close to the barrier up to the third order and predicted that the rupture force scales like const + (ln r)2/3 , with r being the loading rate. It is shown [10], that particularly in the strong pulling limit [15, 16] this theory reveals better agreement with numerical simulations then a linear theory given in [8, 14]. In application to polymers this theoretical description concentrates on breaking of one bond (presumably the weakest one) and fully disregards the chain structure of the system. On the other hand, the situation of breaking of the more or less homogeneous chain has hardly been considered. Thus, Ref. [13] discusses breaking of a ring of identical bonds, i.e., of a chain with periodic boundary conditions. We note that although the experimental realization of this situation is possible in the setup discussed in Ref. [17], the typical case corresponds to a linear chain pulled at one of its ends with another end clamped. In what follows we consider this typical situation where the force is applied to one of the terminals of the chain while the other end is grafted to a surface. For sufficiently low loading rates and short chains each bond experiences the same force and the rupture can occur at an arbitrary bond. For a longer chain or for a high
loading rate the actual force profile along the chain has to be taken into account. When pulling at one terminal of the chain the time of the order of the Rouse time τR [18] is necessary for the stress to propagate through the chain; hence the stress in adjacent bonds differs. If bond rupture occurs on a time scale shorter than the Rouse time, only a part of the chain is under stress and accounts for the rupture process. Thus the rupture force will be crucially affected by the number of monomers in the chain. The aim of this work is to investigate the impact of the chain length on the rupture force both numerically and analytically. Our model will correspond to a chain of monomers interacting via the Morse potential. Otherwise, the model is identical to the Rouse one: we disregard hydrodynamical interactions and describe the interaction of the monomers with the heat bath via independent white noises. The monomer-monomer interaction along the chain is modellled by the Morse potential U (q) given by U (q) =
�2 C � 1 − e−α(q) , 2α
(1)
with dissociation energy C/(2α) and stiffness Cα. The constant loading enters through an additional time dependent potential of the form L(q, t) = −qRt with loading rate R. We note that this potential differs from the often used harmonic linker potential [10, 12, 14, 19], but preserves the feature of linearly increasing force within time we are focusing on. Its advantage is that the extrema of the overall potential U (q, t) = U (q)+ L(q, t) can be obtained analytically. To illustrate the viability of the effects let us take the experimentally relevant values of parameters – C/(2α) ∼ 10−19 J with α ∼ 1010 m−1 , the friction γ = 10−6 kg/s, and a loading rate R = 10−7 N/s and obtain, that the effects discussed below are important for chains consisting of around 300 monomers, i.e. already for relatively short ones. To proceed, let us first recall the rupture dynamics of a single Morse bond under constant loading [10, 11, 12, 19, 20]. At smaller loads the overall potential has two extrema, a minimum corresponding to
2
dW1 (f ) 1 = − k(f )W1 (f ) . df r
(2)
The measured PDF for the rupture forces P1 (f ) then is P1 (f ) = −dW1 (f )/df . Under the assumption that f is close to fi when bond rupture occurs, it is usual to expand the potential around the inflection point qi up to the third order in deviations from qi [9, p 10, 11]. The Kramers rate becomes � k(f ) = cα/(4π) 1 − f /fi exp −c/(3αD)(1 − f /fi )3/2 . Solving (2) one derives " ( � 3 #) � f 2 v W1 (f ) = exp − exp −w 1 − (3) r fi with v = cα2 D/(8π) and w = c/(3αD). In the limit of small loading rates the most probable rupture force fmax follows the scaling relation [10] " � �2 # ln (v/r) 3 . (4) fmax = fi 1 − w Let us now turn to a chain of N bonds. One of its ends is fixed and another one is exposed to a monotonously increasing force with loading rate r = const. To get insight into the role of the chain we consider first the situation when only one bond is breakable and take this bond to be either at the fixed or at the pulled end of the chain. The rest of the chain is considered as a harmonic Rouse one. The influence of the chain on the breaking properties of the bond is twofold: First, due to the coupled dynamics, the overall noise force acting on the monomer stems from the whole rest of the chain and is non-Markovian. Second, since the force does not propagate immediately through the chain, a bond at the grafted end of the chain
0.78 0.77 0.76 fmax/fi
a metastable state of the pulled bond, and a maximum providing the activation barrier. There exists a critical load Fi = F (ti ) = C/4 for which the extrema merge at qi = ln(2)/α and disappear. In the purely deterministic dynamics the Morse bond breaks exactly at ti = Fi /R. Since the system is in contact to a heat bath at temperature T , its overdamped dynamics is described by q˙ = p −C/γ(1 − exp(−αq)) exp(−αq) + R/γt + 2kB T /γξ(t), with ξ(t) being Gaussian white noise. We introduce c = C/γ ([c] = nm/µs), r = R/γ ([r] = nm/µs2 ) and f = F/γ (in the following f is referred to as force). The diffusion coefficient is denoted by D = kB T /γ ([D] = nm2 /µs). Then, the above given experimentally relevant loading rate corresponds to r = 10−4 nm/µs2 in our calculations. The probability W1 (t) that the bond remains intact can be expressed through the following kinetic equation [10, 11, 19, 20] dW1 (t)/dt = −k(t)W1 (t), with k(t) being the Kramers rate [21, 22]. Taking f = rt we can rewrite the kinetic equation in the form
Morse bond at the fixed end single bond Morse bond at the pulled end
0.75 0.74 0.73 0.72
10
20 N
30
40
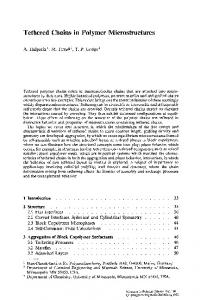
Figure 1: Most probable rupture force fmax as a function of the chain length N . The chain consist of N − 1 harmonic springs and one breakable Morse bond, either situated at the fixed wall or at the pulled terminal of the chain. The coupling parameter of the harmonic springs c˜ is obtained via the first order series expansion of the Morse potential given in Eq. 1, i.e., c˜ = αc. Superimposed is the value of fmax obtained from a single bond pulling experiment. The loading rate is r = 10−5 nm/µs2 . The remaining parameter values are c = 3.5nm/µs, D = 2 × 10⁻³ nm2 /µs, and α = 10/nm. Error bars indicate the uncertainty due to the binning of numerical data.
experiences at the beginning the force smaller then the one that is applied at the pulled terminal. The rupture of a single breakable Morse bond at the fixed wall is affected both by the non-Markovian fluctuations and by the force profile propagation. In contrast, a bond situated at the pulled terminal of the chain feels the instantaneous force, and the deviations from the single-bond rupture statistics are solely due to the non-Markovian character of the noise. Fig. 1 shows the most probable rupture force fmax as a function of the number of bonds in the chain N for both situations. The reference value of the single bond rupture setup is also shown. The difference between different situations is evident. Thus, for a breakable bond at a wall fmax lies well above the reference value (dotted line), while for the breakable bond at a pulled terminal fmax lies slightly below the value of the single bond rupture measurement when the breakable bond is placed at the pulled terminal (dashed line). We conclude that non-Markovian fluctuations accelerate the rupture process while the retarded force propagation delays it. Since the effect of delay is by an order of magnitude stronger, we neglect the impact of the non-Markovian character of the fluctuations and neglect correlations introduced by noise by assuming that the rupture of different bonds is independent. We pass to a chain of N breakable Morse bonds. Let W1 (fi (t)) be the probability of the bond i to be intact. Let r be very small, r ≪ 1. Then, we can assume the forces acting on each spring along the polymer chain are
3
The experimentally obtained curves of the most probable rupture forces are expected to tend to this scaling relation in the limit of vanishing loading rates. Let us now turn to higher loading rates. The probability that all N bonds in the chain are still intact under a pulling force at the terminal of the chain being f (t) is QN then given by WN (fi (t)) = i=1 W1 (fi (t)). Passing to the continuum limit (i → x) we obtain (Z ) N
WN (t) = exp
ln (W1 (f (x, t))) dx
.
(6)
0
Since barrier crossing events are very rare, most of the time the motion of the monomers takes place close to the quadratic potential minima of bond energies. Therefore we derive the force profile by considering a semi-infinite chain of harmonic springs pulled at x = 0 with a force f (t) = rt, i.e., by solving the following continuum equation for the scalar displacement field q(x, t) q(x, ˙ t) = cα∆x q(x, t) + rtδ(x) .
(7)
For not too short chains the impact of the clamped end can be neglected. Then, the force profile f (x, t) connected to q(x, t) via f (x, t) = −cαdq/dx is given by � � �� � �� � ξ2 ξ − ξ2 ξ 4 , 1+ −√ e f (ξ, t) = f (t) 1 − erf 2 2 π (8) √ with ξ = x/ cαt. Linearizing this result close to the pulled end, √ � (9) f (ξ, t) ≃ f (t) 1 − 2ξ/ π ,
and using Eqs. (3) and (6) we get: ( vl p WN (f (t)) = exp − × 2/3 3rw f (t) (10) ��� � � � � 3 2 2 . Γ , a(t) − Γ , a(t)(1 + S(N )) 2 3 3 p Here l = fi cαπ/r, Γ(b, z)R is the upper incomplete ∞ gamma function Γ(b, z) = z tb−1 e−t dt, S(N, f ) =
1 scaling relation, Eq. (4) scaling relation, Eq. (5) theory numerical simulation
0.95 0.9 0.85 fmax/fi
virtually the same. This is expected to be true at least for a not too large value of N . The probability that all N bonds are intact is then given by WN (f ) = W1 (f )N . Then, the probability that a bond breaks in an interval [f, f + df ] is PN (f ) = N W1 (f )N −1 P1 (f ) and is given by the same expression as P1 with v changed for N v. Together with (4) we derive the following limiting scaling relation for the most probable rupture force " � �2 # ln (N v/r) 3 . (5) fmax = fi 1 − w
0.8 0.75 0.7 0.65 −6
10
−5
10
−4
10
−3
2
10
−2
10
r [nm/µs ]
Figure 2: Most probable rupture force fmax as a function of the loading rate r. The length of the chain is N = 100. The remaining parameter values are the same as in Fig. 1.
p 2N r/cαπf (t)/[fi /f (t) − 1] and a(t) = w(1 − f (t)/fi )3/2 . Finally, the probability density distribution reads � vl × PN (f (t)) = −WN (f (t)) 2/3 6w f (t)3/2 � � �� � � 3 2 2 Γ , a(t) − Γ , a(t)(1 + S(N, f )) 2 3 3 (11) vl × + p 2 f (t) " ! #) 3 e−a(t) N/l 1 −a(t)(1+S(N,f )) 2 − −p e . fi fi f (t)
In Fig. 2 we present the numerically obtained most probable rupture force fmax as a function of the loading rate r for a chain of length N = 100. Superimposed are the prediction of Eq. (4) (dashed line), the prediction of Eq. (5) (dotted line), and the most probable rupture force derived from Eq. (11). In the limit of small r the most probable rupture force tends to the prediction of Eq. (5): Virtually all bonds account for the rupture process of the chain. In the opposite limit of very large loading rates only a few bonds contribute to rupture (in the extreme limit only the one at the pulled end of the chain) and the scaling of fmax is given by Eq. (4). The crossover behavior is very well reproduced by the theory (Eq. (11)). Small deviations appear for the intermediate values of r where the exact force profile along the chain plays a role and the linear approximation in Eq. (9) gets slightly inaccurate. Higher order corrections might resolve this issue. In Fig. 3 we present the numerically obtained most probable rupture force fmax as a function of the chain length N for r = 10−5 nm/µs2 . Shown are also the prediction of Eq. (5) (dashed line), and the most probable
4 0.72 scaling relation, Eq. (5) numerical simulation theory
0.71 0.7
/f
max i
0.69
f
0.68 0.67 0.66 0.65 0.64 0
20
40
60
80
100
N
Figure 3: Most probable rupture force fmax as a function of the chain length N for r = 10−5 nm/µs2 . The remaining parameter values are the same as in Fig. 1.
rupture force derived from Eq. (11). For not too large systems, the predictions of Eq. (5) and of Eq. (11) tend to each other and both describe well the results from the numerical simulations. Moreover, it is evident that the scaling relation Eq. (5) gives a lower bound for the most probable rupture force. Deviations appear for larger system sizes N , where both the numerical results and the prediction of Eq. (11) saturate. We also state that the PDF of the actual rupture forces (not shown) is also adequately described by Eq. (11). The overall behavior shown in Fig. 3 corresponds to a transition from the small-N scaling regime to a saturation after some Ns (r) depending on the loading rate. The value of Ns can be estimated as follows. A single bond rupture is governed by P1 (f ) and rupture occurs with highest probability at f (x, t) = fmax with fmax given in Eq. (4). The value of fmax can be translated into the most probable time to break via tmax = fmax /r. The distribution P1 (f ) is strongly skewed to the left [10, 11], and its variance is given by σ12 = (2π 2 /27)fi2 w−4/3 (ln (v))−2/3 , see Ref. [9]. We then can assume that the rupture of a bond hardly occurs if the corresponding force is f < fmax − 2σ1 . The portion of the chain Ns in which the broken bond is localized is then determined by the condition that the force at the bond number Ns is fmax − 2σ1 at the time when the first bond is most probably going to break, i.e. f (Ns , tmax ) = fmax − 2σ1 . resolving Eq. (9) for the corresponding value of x = Ns we get q c2 απ 3 54r
Ns (r) =
1 3
(ln (v)) w
2 3
r
1−
�
ln(v) w
� 23 .
(12)
For r = 10−5 nm/µs2 we have Ns ≃ 100, in qualitative
agreement with the outcome of our numerical simulations, and for r = 10−4 nm/µs2 we get Ns ≃ 35 (again in agreement with simulations, not shown). Let us summarize our findings. Compared to single bond breaking, the existence of the chain introduces new aspects into rupture dynamics, the most important being the delayed stress propagation along the chain. We show that the most probable rupture force decreases with the length of the chain as fmax ∝ const − (ln(N/r))2/3 and then saturates at the value depending on the loading rate. The results of theoretical considerations are confirmed by the ones of numerical simulations. The authors thankfully acknowledge valuable discussions with J. Klafter and M. Urbakh. This research has been supported by DFG within the SFB 555 research collaboration program.
[1] M. Rief, F. Oesterhelt, B. Heymann, and H. E. Gaub, Science 275, 1295 (1997). [2] A. D. Mehta, M. Rief, J. A. Spudich, D. A. Smith, and R. M. Simmons, Science 283, 1689 (1999). [3] M. Grandbois, M. Beyer, M. Rief, H. ClausenSchaumann, and H. E. Gaub, Science 283, 1727 (1999). [4] S. Cui, C. Albrecht, F. K¨ uhner, and H. Gaub, J. Am. Chem. Soc. 128, 6636 (2006). [5] C. Friedsam, A. Wehle, F. K¨ uhner, and H. Gaub, J. Phys.: Condens. Matter 15, 1709 (2003). [6] G. Neuert, C. Albrecht, and H. Gaub, Biophys. J. 93, 1215 (2007). [7] T. Strunz, K. Oroszlan, R. Schafer, and H.-J. G¨ untherodt, Proc. Natl. Acad. Sci. U.S.A. 96, 11277 (1999). [8] E. Evans, Annu. Rev. Biophys. Biomol. Struct. 30, 105 (2001). [9] A. Garg, Phys. Rev. B 51, 15592 (1995). [10] O.K. Dudko, A. Filippov, J. Klafter, and M. Urbakh, Proc. Natl. Acad. Sci. U.S.A. 100, 11378 (2003). [11] O.K. Dudko, G. Hummer, and A. Szabo, Phys. Rev. Lett. 96, 108101 (2006). [12] H.-Y. Chen and Y.-P. Chu, Phys. Rev. E 71, 010901(R) (2005). [13] C.L. Dias, M. Dub´e, F.A. Oliveira, and M. Grant, Phys. Rev. E 72, 011918 (2005). [14] E. Evans and K. Ritchie, Biophys. J. 72, 1541 (1997). [15] H.-J. Lin, H.-Y. Chen, Y.-J. Sheng, and H.-K. Tsao, Phys. Rev. Lett. 98, 088304 (2007). [16] R. W. Friddle, Phys. Rev. Lett. 100, 138302 (2008). [17] N. Severin, W. Zhuang, C. Ecker, A. Kalachev, I. Sokolov, and J. Rabe, Nano Lett. 6, 2561 (2006). [18] M. Doi and S. Edwards, The Theory of Polymer Dynamics (Oxford University Press, Oxford, 1986). [19] Z. Tshiprut, J. Klafter, and M. Urbakh, J. Chem. Phys. 125, 204705 (2006). [20] M. Raible, M. Evstigneev, P. Reimann, F. Bartels, and R. Ros, J. Biotechnol. 112, 13 (2004). [21] H. Kramers, Physica 7, 284 (1940). [22] P. H¨ anggi, P. Talkner, and M. Borkovec, Rev. Mod. Phys. 62, 251 (1990).